


All Issues
California wine industry evolving to compete in 21st century
Publication Information
California Agriculture 62(1):12-18. https://doi.org/10.3733/ca.v062n01p12
Published January 01, 2008
PDF | Citation | Permissions
Abstract
The California wine industry is growing and changing amidst a global revolution in grape growing, wine production, wine marketing and consumer tastes. California accounted for roughly 90% of the value of U.S. wine production in 2006. U.S. per capita wine consumption and the quality of wine consumed continue to rise. The largest California wineries have long accounted for most California wine shipments and continue to expand with respect to volume and number of labels. While small wineries sell most of their wine directly to end-users, many midsized wineries face challenges in an increasingly crowded marketplace.
Full text
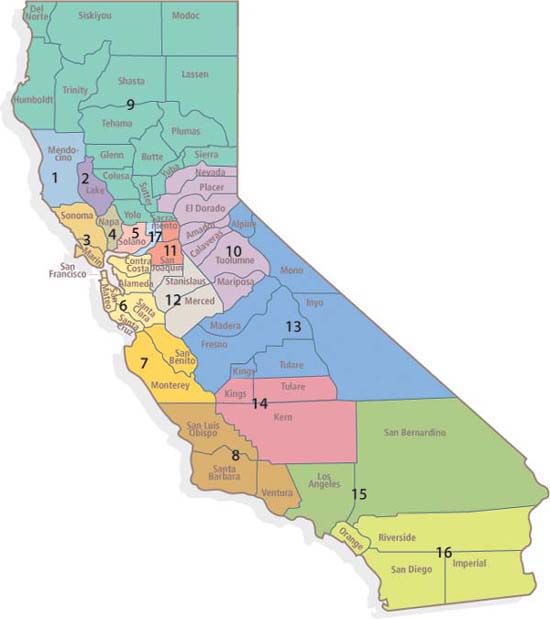
IN 2006, almost 3.1 million tons of California grapes were crushed to make wine (CDFA 2007), enough to make more than 2.3 billion bottles. (A ton of grapes makes 150 gallons, or 750 bottles of wine; California wine grape yields were on average 6.5 tons an acre in 2006.) For wine grape purposes, California has 17 crush districts (fig. 1). Napa County (district 4), for example, accounted for 4% of the 2006 crush but received grower prices that were 5.5 times higher than the state average. Fresno, Madera and Tulare counties (district 13) accounted for one-third of the state's crush, while growers there were paid prices that were just over one-third of the state's average price (table 1).
The average price received by growers for grapes was $548 a ton in 2006, making the value of the grapes in an average bottle of California wine $0.75 (CDFA 2007). The range in prices was wide, from less than $300 a ton in the San Joaquin Valley, where half of California wine grapes are grown (making the grapes in a typical bottle from this region worth $0.40), to over $3,000 a ton in the Napa Valley ($4 a bottle). The average price per ton is generally lower in districts with the largest share of the crush. Few other commodities have 10–to-1 differences in grower prices and even wider retail price differences.
California's wine industry continues to grow and change. The state's 17 crush districts processed 3.5 million tons of wine grapes in 2006. The California Associate of Winegrape Growers is promoting viticulture statewide with its new “One Nation Under Vines” campaign.
The California wine industry is growing and changing amidst a global revolution in grape growing, wine production, wine marketing and consumer tastes (Sumner et al. 2004; Anderson 2004). This article focuses on the marketing and taste factors that are producing a layered or tiered industry in which middle-sized producers are being pushed to get larger or smaller.
Three important trends are influencing the California wine industry: (1) increased production by multiwinery corporations with many labels that cover different price points, (2) the growth of small wineries that sell directly to consumers and (3) the resultant squeeze on midsized wineries. Economies of scale in marketing seem to explain the tendency of multiwinery corporations, including liquor producers and luxury-brand conglomerates, to buy midsized wineries and offer a variety of labels; meanwhile, wine-based tourism and direct sales via the Internet help explain the growth of small wineries. The future is uncertain for wineries producing too little wine to have extensive distribution and marketing activities, but too much to sell directly to consumers.
Wine consumption: More and better
California accounted for roughly 90% of the value of U.S. wine production in 2006, down from about 94% in 2000. About 80% of U.S.-produced wine is consumed domestically, so trends in American wine consumption are an important determinant of the success of the California wine industry.
The average annual consumption per U.S. adult increased from 2.1 gallons (10 bottles) in 1995 to 2.5 gallons in 2000, and to an estimated 2.9 gallons (15 bottles) in 2006 (Wine Market Council 2007). In spite of this growth in per capita consumption, Americans still drink relatively little wine compared to countries such as France or Italy, where adults drink six to seven times as much wine as Americans (Wine Institute 2007). Furthermore, U.S. wine consumption is concentrated among regular wine drinkers. The 30 million Americans who consume wine regularly drink 90% of the wine consumed in the United States, an average of 12 gallons, or 60 bottles a year on average (Wine Market Council 2007).
There have been three important changes in U.S. wine consumption over the past 2 decades. First, consumers everywhere have come to appreciate the quality of California wine, and more Americans are drinking red wine for health reasons. In November 1991, the TV program “60 Minutes” explored the so-called “French paradox,” the fact that there appears to be less heart disease in France than the United States despite the high-fat French diet. The explanation that moderate consumption of red wine may prevent heart disease helped to interest more Americans in wine for health reasons.
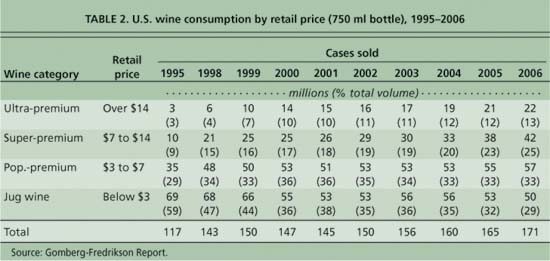
Second, Americans upgraded their palates, with many moving from inexpensive jug wines with retail prices of less than $3 a bottle to better quality wines costing more, including popular-premium wines costing $3 to $7 a bottle, super-premium wines costing $7 to $14 a bottle, and ultra-premium wines costing over $14 a bottle. Third, Americans increasingly prefer the consistent taste of fruity wines produced in “New World” California, Argentina, Australia, Chile and New Zealand to the wines from “Old World” Europe, which can vary significantly from year to year.
The industry uses four retail price categories to classify wine (Gomberg-Fredrikson). The fastest growth in the volume of wine sold has been in the super-premium category, which now accounts for one-quarter of U.S. wine sales, followed by the ultra-premium category (table 2). The only decline has been in jug wine, whose sales dropped to less than one-third of the total.

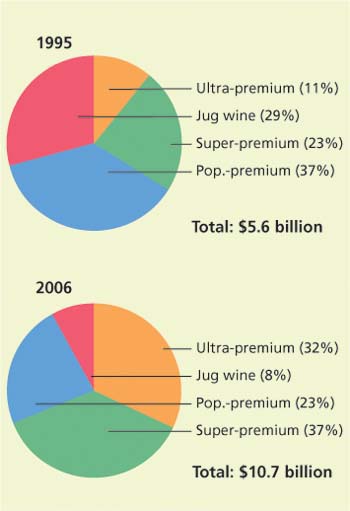
Only the volume of wine sold is reported, not the revenue. We used the average retail price of a bottle of wine in each of the categories (assuming $18 for ultra-premium, $2 for jug wine and the midpoints for the other categories) to estimate nominal revenue: $5.6 billion in 1995, $10.7 billion in 2000 and $14.6 billion in 2007, as well as revenue shares (figs. 2 and 3).
Although prices rose over this period, some of the increase in wine revenue in the higher-price sales classes reflects inflation. The Economic Report of the President (2007) specifies that the consumer price index (CPI) rose from 152 in 1995 to 202 in 2006, an increase of 32%. In order to assess changes in the volume of wine reported in the various price categories (table 2), we corrected for inflation by calculating the Paasche and Laspeyres price indices since 1995. The Paasche price index weights prices using the most recent quantity of wine purchased (2006) in each category, while the Laspeyres price index weights prices using the oldest quantity of wine purchased (1995) in each category.
Using these indices, we found that wine prices declined 7.5% (Paasche) and 6.3% (Laspeyres) between 1995 and 2006. However, wine volumes and revenues are only reported by price category, so the Paasche and Laspeyres price indices do not fully reflect inflation. The price categories are constant in nominal dollars, not real dollars, so that a $3 bottle of wine in 1995 cost the same in real terms as a $3.97 bottle of wine in 2006 (moving it into the popular-premium category), a $7 bottle in 1995 cost $9.26 in 2006 (moving it into the super-premium category), and a $14 bottle in 1995 cost $18.52 in 2006.
If wine prices were uniformly distributed within categories, the inflation-adjusted share of super- and ultra-premium wines in 2006 (bottles selling for over $9.26 in 2006 rather than over $7) would be reduced from 38% to 30% of total wine sales. In other words, taking inflation into account only explains 8% of the increase in sales of super- and ultra-premium wines, so there is a substantial real increase in these categories compared to their 1995 share of 12%. The declining real price of wine likely contributed to the perception of wine as an “affordable luxury.”
New World, Old World
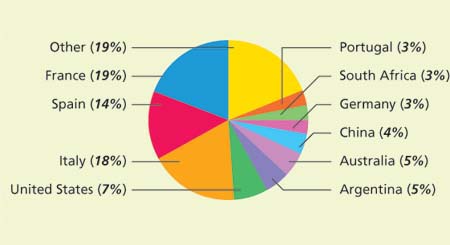
While France, Italy and Spain still accounted for 51% of world wine production in 2004 (fig. 4), wine production has grown considerably in New World countries such as the United States, Australia, Chile, New Zealand and South Africa (IOWV 2005).
Americans seem to prefer the New World style of winemaking, which strives for a consistent taste from vintage to vintage, alcohol levels of 13% to 14% instead of 11% to 12%, and a fresh, fruity taste. New World wineries often grow their own grapes or have considerable control over vineyards, where grape vines are often planted close together, mechanical pruning and harvesting are common, and wineries bristle with technology. Yields are much higher in the New World. For example, Bronco Wine Company, whose 35,000 acres of vineyards make it the largest integrated vineyard-winery in California, produces Charles Shaw wine (sold only at Trader Joe's, a specialty food retailer) for $1.99 to $2.99 a bottle, as well as other labels such as Fox Hollow and Montpellier (Franson 2004).

In Old World Europe, most grape growers are small and most wine is made by cooperatives that crush locally grown grapes. Several varieties of grapes are usually combined to make wine, and the wine is labeled with the region in which the grapes were grown, such as Burgundy. A long list of rules governs how grapes are grown and wine is made, including irrigation restrictions that limit yields.
The complex rules that govern grape growing and winemaking must be followed to receive some of the ₠1.2 billion ($1.6 billion) a year in subsidies that the European Union provides to its wine sector. The European Union's overproduction of low-quality table wine, which is regularly distilled into industrial alcohol, has spawned plans to remove up to a million of the European Union's 8 million acres of wine grapes by providing up to ₠2.4 billion in payments to grape growers who remove their vineyards (Bounds 2007). The E.U. Commission has also proposed simplifying wine labels and allowing wineries to use New World winemaking techniques (EU 2007). Some growers in areas that historically produced lower-quality wines, such as Languedoc-Roussillon in southern France, are switching to single-varietal wines in an effort to attract consumers accustomed to New World labels, a strategy also spreading in Italy and Spain.
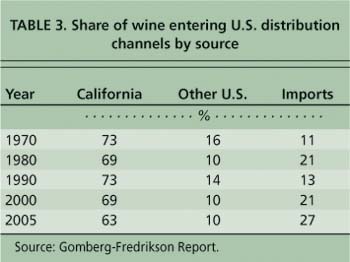
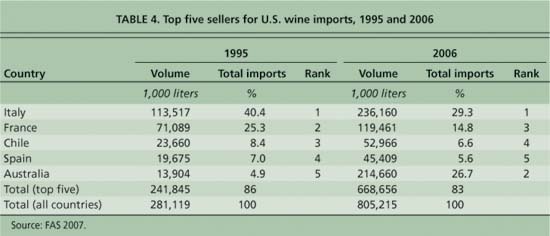
Rising U.S. consumption of wine has been accompanied by increased wine imports, which were up 186% between 1995 and 2006. Twenty-seven percent of the wine consumed in the United States is imported (table 3), including a rising share from Australia and Chile. These countries, with combined populations of less than 40 million, well under 1% of the world's population, produce over 6% of the world's wine, guaranteeing more New World wine exports.
In 1995, some 72.7% of U.S. wine imports were from France, Italy and Spain, the three largest Old World producers; by 2006, the world's three leading wine producers accounted for only 49.7% of U.S. wine imports (table 4). Imported wine accounts for 40% of the wine sold under $10 a bottle, in part because of the success of Australia's Yellow Tail, the leading import, which is on track to sell 12 million cases in 2007, almost 4% of the 300 million cases expected to be sold in the United States.
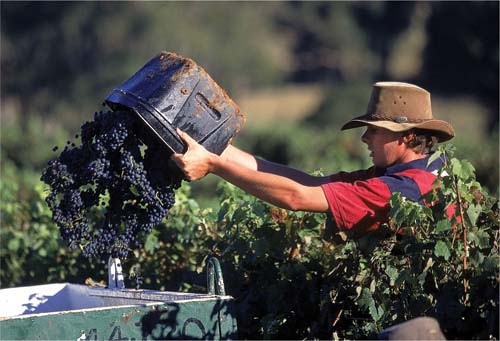
Australia is one of the world's top-10 wine-producing countries; its Yellow Tail brand is the leading U.S. wine import, with 12 million cases sold in 2007. Above, a harvest at Tyrell's Wines in Hunter Valley, north of Sydney in New South Wales.
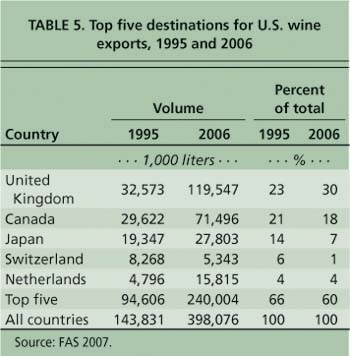
U.S. wine exports have also increased, up 177% between 1995 and 2006 (table 5). The United Kingdom and Canada have long been the leading importers of U.S. wine, but Italy was the third largest in 2006, up from negligible imports in 1995. Germany moved up slightly, from the sixth largest importer in 1995 to the fifth largest in 2006, and Switzerland and the Netherlands dropped out of the top five. While the relative rankings altered, it is important to note that all of these countries except for Switzerland increased their imports of U.S. wine in absolute terms.
Some wine is consumed in every country in the world, and at least 45 countries produce wine commercially. Does the prospect of more countries consuming more wine, and more wine being produced and traded, bode well for California producers? On the one hand, more locally produced wine may increase interest in wine, opening new markets for California wine. On the other hand, new countries could become major producers and competitors. China is an example of the opportunity and threat. More grapes are being planted and more wine is being made, but it is not yet clear whether China will emerge as a major market for imported wine or a major exporter of wine (Thach 2007).
Consolidation, diversification
In general, the farm and food industries are consolidating so that fewer and larger firms account for an increased share of total sales. The number of U.S. farms, including wine grape producers, has been stable at about 2 million, but the largest 5% of U.S. farms account for an ever-increasing share of production and 60% of total farm sales in 2003. Similarly, the number of processors of farm commodities has been decreasing, so that the largest four meatpackers account for over 80% of U.S. meat production.
The number of wineries (currently about 2,900) in California has doubled in the past decade, providing diverse new choices for consumers. But industry consolidation continues apace, with the top three wineries now accounting for 60% of California wine shipments. Midsize wineries appear to be at greatest risk.
In the past decade, the number of California wine-grape growers has increased slightly to almost 5,000, and the number of wineries in the state, 2,900, has doubled in the past decade (the United States had 5,900 wineries in 2006, including 430 in Washington, 290 in Oregon and 220 in New York [(Tinney 2007b]). However, growth in the number of grape growers and wineries can obscure more important changes within the California wine industry.
The largest California wineries have long accounted for most California wine shipments. The two largest wineries have accounted for about 45% of wine shipments over the past 15 years, the four largest for 60% to 65%, and the eight largest for about 75% of wine shipments. Total wine shipments have increased by almost 60% since 1990, meaning that the largest firms expanded significantly even though their market share was stable.
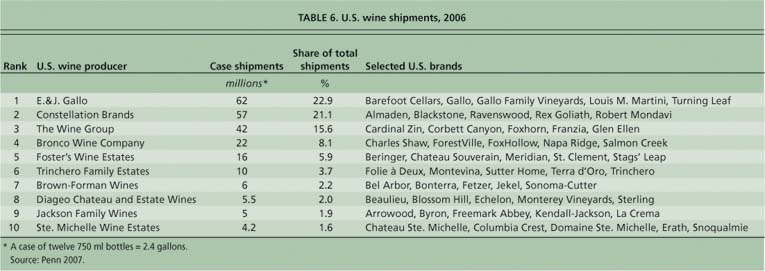
At the national level, concentration is slightly higher than at the state level, as the top three U.S. wineries accounted for about 60% of the 270 million U.S. cases shipped in 2006. E. & J. Gallo has been the largest U.S. (and California) winery for most of the past 75 years, producing an estimated 62 million (U.S.) cases in 2006. Constellation Brands is second, with about 57 million cases, and The Wine Group third, with 42 million cases (table 6). The top 15 wineries, each selling a million cases or more, accounted for about 85% of U.S. production.
The composition of some wine firms has changed as a result of acquisitions. Several of the wine producers that were among the 10 largest have been absorbed by larger firms, including Robert Mondavi and Vincor USA, top 10 wine producers bought by Constellation. Most recently, in November 2007, Constellation purchased the wine portfolio of Fortune Brands, which was the 11th largest producer. The smallest wine producers among the top 30, such as Wente and Sebastiani, each produce 300,000 to 350,000 cases a year. There are some economies of scale in production, because larger producers can get bottles and other materials more cheaply. But the major benefit of large size appears be in marketing, as large distributors and retailers can deal with one supplier for a wide range of wines.
The largest wineries offer a range of labels, from premium Gallo Family Vineyards estate and Louis Martini wines to fighting varietals (bottles that use one grape variety and sell for $3 to $7 a bottle) such as Turning Leaf, to jug wines such as Carlo Rossi and Peter Vella. Gallo also distributes imported wines, such as Black Swan from Australia. Constellation, which bought Napa's Robert Mondavi winery in 2004, is the largest U.S. winery by revenue, since its wines include premium labels such as Opus One, Ravenswood, Estancia and Simi as well as the jug wines Almaden, Inglenook and Paul Masson. The Wine Group is the leading U.S. supplier of boxed wine (Franzia) and popular premium wines such as Glen Ellen, and is a leading supplier of bulk wine to other wineries.
The number of wine labels is rising faster than winery sales, that is, the percentage increase in labels is greater than the percentage increase in sales (Tinney 2007a). Almost 3,500 wine labels were available in supermarkets at the end of 2006, including almost two-thirds that were introduced after 1999. The top brands in grocery stores for the year ending July 1, 2006, were Yellow Tail, Sutter Home, Franzia, Woodbridge and Beringer California Collection. The proliferation of wine labels has reduced the average number of cases sold per label by about 20,000 a year.
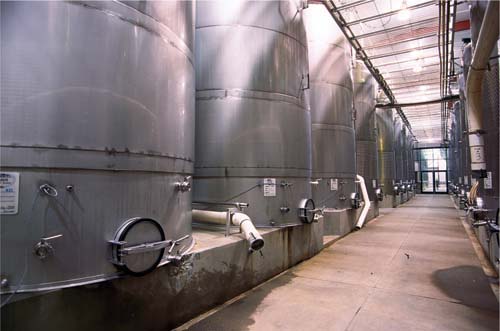
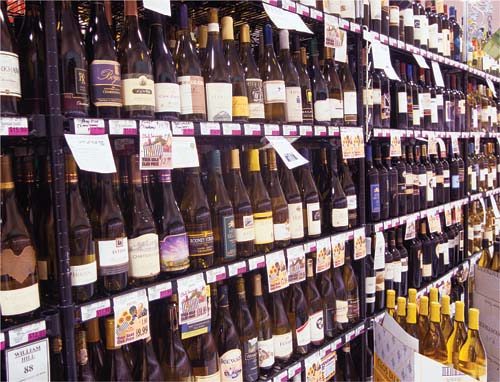
"New World” winemaking techniques — employed by countries such as the United States, Australia and Chile — emphasize consistency between vintages, economies of scale and modern technology (California winery shown). By contrast, “Old World” European winemaking is smaller scale and governed by complex rules.
Small wineries, those producing less than 5,000 to 10,000 cases a year, sell most of their wine directly to consumers. Many consumers visit small wineries, taste the wine and purchase it on the spot, which eliminates the need for distributor markups and shipping costs. By joining the winery's club, consumers can continue to purchase their favorite wines directly from the winery, and their loyalty can be cemented by inviting them to special events such as winemaker dinners. The U.S. Supreme Court in 2005 struck down laws that allowed in-state wineries to ship wine directly to consumers but barred out-of-state wineries from shipping to consumers within the state. As a result, states that allow shipments of wine to state residents from wineries within that state must now also allow shipments to consumers from out-of-state wineries. As states come into compliance with this ruling, direct sales to consumers are expected to expand.
Midsize wineries do not have the large brand portfolios at different price points that allow large multiwinery corporations to negotiate with distributors and wholesalers. Thus they do not benefit from economies of scale in certain aspects of production as do the large corporations. However, they have substantially more wine to market than small wineries do, increasing the difficulty of attempting to market their entire production directly to final buyers, such as consumers and restaurants.
The number of grape growers and wineries is increasing faster outside than inside California, although most non-California operations are small. The effects of the growing number of non-California wines on the state's wine business are as ambiguous as increased consumption and production around the world. The spread of wine trails and tasting rooms in other states, such as Iowa and Virginia, may raise consumer appreciation of wine, increasing the number of regular wine drinkers and stimulating demand for all types of wine, including California wine. Or, wine tasting may stimulate a demand among occasional wine drinkers only for local wines.
Whither California wine?
California wine has enhanced its quality and reputation with U.S. and global consumers. At the dawn of the 21st century, the interest of aging baby boomers in the lifestyle associated with wine and food, especially the interest of women and those convinced of wine's health benefits, augurs well for continued growth in an industry that is expanding premium wine production and direct sales to consumers. The University of California is contributing to the industry's competitiveness; most grape growers and wineries use root-stocks and technologies developed by University researchers.
Many midsized wineries face challenges in an increasingly crowded marketplace where the demise of midsized wholesalers makes it hard to keep their wine before consumers. These wineries, some with storied labels, may be in a race against time, hoping to be successful enough to be noticed and bought by a multiwinery corporation, or to achieve sufficient efficiencies in distribution to remain independent. Some may remain small and sell their wine directly to consumers or to local stores and restaurants. In this sense, the wine industry is likely to experience the kind of structural change that has occurred in farm production, where most farm commodities are produced by fewer than 5% of farms, and the smallest 90% of producers account for a small share of total production.

The quality and reputation of California wine have improved in recent years, as has consumer interest in fresh, local food and wine. The expansion of premium wine production is likely to continue in California. Above, chardonnay grapes.
California wine industry evolving to compete in 21st century

