


All Issues
Blue oak seedling age influences growth and mortality
Publication Information
California Agriculture 61(1):11-15. https://doi.org/10.3733/ca.v061n01p11
Published January 01, 2007
PDF | Citation | Permissions
NALT Keywords
Abstract
In some California locations, the natural regeneration of blue oak is limited by the ability of small seedlings to survive long enough to become larger saplings. This study evaluated the growth and survival of different age classes of seedlings. We found that over a 7-year period, older blue oak seedlings had a much higher survival rate than younger seedlings. Under this study's conditions, however, the height of younger seedlings increased while that of older seedlings decreased. These results suggest that once a seedling survives approximately a decade and becomes established, it is much more likely to remain alive compared to newly germinated seedlings. Nonetheless, its height growth rate may be extremely slow.
Full text
Blue oak trees are a valuable economic and aesthetic resource in the Sierra Nevada foothills of California. Ecologically, oak woodlands, including blue oak (Quercus douglasii) woodlands, provide some of the richest wildlife habitat in the state (Giusti et al. 2005). However, for nearly a century there have been concerns about the adequacy of natural blue oak regeneration (Jepson 1910). In some locations, natural regeneration may be insufficient to sustain populations (Bartolome et al. 1987; Sweicki et al. 1997a), while in others it may be more than adequate to replace mortality (Wieslander 1935). This conflicting information is cause for concern among landowners, governmental agencies, conservationists and others interested in the long-term sustainability of this species ( see page 7 ).
Standiford et al. (1991) conducted an oak-tree size survey in 1987 and found large numbers of blue oak seedlings less than 1.0 feet (0.3 meter tall), fewer seedlings in the 4.3-to-10.2 feet (1.3-to-3.1-meters) category, but an adequate stand of mature trees (at least 100 trees per acre). Swiecki et al. (1997b) also reported insufficient numbers of blue oak saplings at 13 of 15 locations sampled throughout the state to replace tree mortality.
California's oak woodlands are critical, providing rich wildlife habitat, soil stabilization and beautiful scenery, as shown at the UC Hastings Natural History Reservation in Carmel Valley. Oaks are long-lived but also slow-growing trees; regeneration rates for some species may not be adequate to replace natural mortality.
Information regarding the mortality of small oak seedlings is limited and not always consistent. Allen-Diaz and Bartolome (1992) reported 50% annual mortality over a 3-year study, while Swiecki et al. (1991) reported that 75.7% of blue oak seedlings survived over a 3-year study. Neither study identified the age of the seedlings.
Livestock grazing, drought and competition for soil moisture from nonnative annual plants have been suggested as factors that influence blue oak seedling survival, but there is limited biological information about which factors are most important (Phillips et al. 1996).
Age groups and causes of mortality
The first part of this study was initiated in oak woodlands in the southern Sierra Nevada foothills of Kern County, in 1989 (Phillips et al. 1997). At that time, 600 naturally regenerated blue oak seedlings were identified in 13 0.1-acre (0.04-hectare) plots at three locations. In 1993, a technique described by Phillips et al. (1997) was used to estimate the age of the surviving seedlings from this group. The technique involved using regression analysis to develop a model of the relationship between root-crown diameter and the number of growth rings. Root crowns of the seedlings identified in 1989 were measured in 1993 and the regression equation was used to estimate seedling age.
The second part of the study was initiated in 1997. There was a large blue oak acorn crop in fall 1996, and the subsequent winter moisture of late 1996 and early 1997 was adequate to support what appeared to be above-normal acorn germination. In spring 1997, a large number of newly germinated blue oak seedlings were present in the 13 plots established in 1989. During early summer 1997, after the annual vegetation had dried so that seedlings could be located more easily, each of the original 13 plots was evaluated for the presence of newly sprouted seedlings. In order for seedlings to be classified as newly sprouted, the acorn had to still be attached to the seedling. Each newly sprouted seedling was identified by a number, plot number and year. Seedlings in the old group in these plots had already been individually identified in a similar fashion.
Oak seedlings often must compete with dense annual grasses for moisture and nutrients, while rodents and livestock browse on them. A long-term study in Kern County assessed the growth rates and mortality of blue oak seedlings (flagged).
The 1989 seedlings were the first age group (old) and the 1997 seedlings were the second (new). Seedlings from the 1989 and 1997 groups were evaluated annually from 1997 to 2004. These assessments were conducted at the end of the growing season, when the forage had turned brown.
Height measurements were taken in 1997 and 2001 on both the 1997 (new) and 1989 (old) seedling groups, and mortality was assessed annually. The cause of death was categorized as either rodent-caused or non-rodent-caused. To be classified as rodent-caused, there had to be clear evidence that rodents had destroyed the seedling: either rodent burrows present near the seedling, or if dead seedlings could be pulled up, visible teeth marks on the roots. All other dead seedlings were categorized as nonrodent-caused.

TABLE 1 Generalized least squares regression model for relative effects of age and initial height of blue oak seedlings on the change in height, 1997–2001
Analysis of age groups and height
In 1997, there were 300 seedlings in the old seedling group and 764 seedlings in the new group. The effect of age group and initial height on absolute height change (height in 2001 divided by height in 1997) and the relative height change ([height in 2001 divided by height in 1997] divided by height in 1997) were analyzed using a generalized least squares regression analysis, with a stratified variance function for each age group due to unequal variance structures (Pinheiro and Bates 2000). The initial height, average age in 1997 and average age in 2001 were analyzed using analysis of variance. The percentage annual death rate was analyzed using a linear mixed-effects regression model (Pinheiro and Bates 2000) after the outcome variable had been transformed using an arcsine transformation (Neter et al. 1990). The percentage annual death loss was calculated as the number of seedlings that were alive the previous year divided into the number of seedlings that died during the following year. The survival and height data reported were from those seedlings not affected by rodents.

Fig. 1 Effect of age and initial height of blue oak seedlings on the difference in height, 1997 to 2001.

Oak seedlings are often repeatedly browsed by animals such as deer, keeping them small and stunted for decades.

In 1989, the estimated age of this seedling was 11 years.
Changes in height
The overall mean height in 1997 was 2.0 inches (5.0 centimeters) for the new group of seedlings and 12.0 inches (30.0 centimeters) for the old (established) group. The 2001 average height was 3.0 inches (7.4 centimeters) for the new group and 11.0 inches (27.4 centimeters) for the old group, with an overall mean change in height of 0.96 inch (2.4 centimeters) and -1.0 inch (-2.5 centimeters), respectively. The generalized least squares regression model showed a significant difference in the change in height between the new and old seedling groups (table 1).

TABLE 2 Generalized least squares regression model for relative effects of age and initial height of blue oak seedlings on relative percentage change in height, 1997–2001⋆
However, this difference was strongly influenced by the initial height of the seedling in 1997 (fig. 1). In other words, regardless of whether the seedling was new or old (established), the taller it was in 1997, the more likely it was to lose height during the 4-year study interval. This was most likely due to the dieback of shoots from lack of moisture. Consistent with this result, Phillips et al. (unpublished data, 2004) observed that shorter seedlings increased in height faster than taller seedlings over a 12-year observation period. In this larger study, 599 seedlings were initially followed from 1998 to 2001, in the same location as the present study.
Similar to the results shown in table 1, the generalized least squares regression model for the percentage change in height between 1997 and 2001 (table 2) showed a significant difference between the old and new seedlings. While the majority of new seedlings gained 50% to 200% in height relative to their 1997 levels, many older seedlings lost 10% to 30% of their height. This difference in the relative percentage change of height was strongly influenced by the initial height of the seedling in 1997.
Mortality and survival
The initial height of seedlings in the old group that died between 1997 and 2001 was significantly less than the initial height of seedlings that were alive in 2001 (6.5 and 11.6 inches [16.3 versus 29.1 centimeters], respectively) (table 3). Therefore, in the old group shorter seedlings died at a faster rate than taller seedlings.
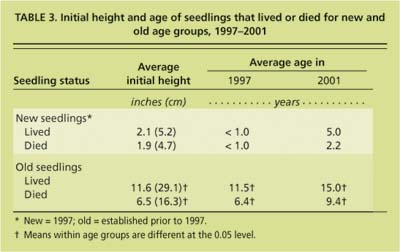
TABLE 3 Initial height and age of seedlings that lived or died for new and old age aroups, 1997-2001.

On the other hand, the initial height of living seedlings from the new group in 2001 was not significantly different (2.1 inches [5.2 centimeters]) from that of seedlings that died between 1997 and 2001 (1.9 inches [4.7 centimeters]). Phillips et al. (unpublished data, 2004) found that 2.0-inch (5.0-centimeter) seedlings had less than a 10% probability of surviving, while 16.0-inch (40.0-centimeter) seedlings had a 90% probability. However, this relationship did not hold true for the newer seedlings in this study. Also, in Phillips et al. (unpublished data, 2004), shorter seedlings increased in height at a greater annual rate than did taller seedlings.
The average age of surviving old seedlings in 2001 was 11.5 years, and the average age of seedlings that died between 1997 and 2002 was 6.4 years (table 3). The difference in the age of surviving seedlings versus seedlings that died suggests that once blue oak seedlings survive to a certain age, they are much more likely to remain alive than are newly germinated seedlings.
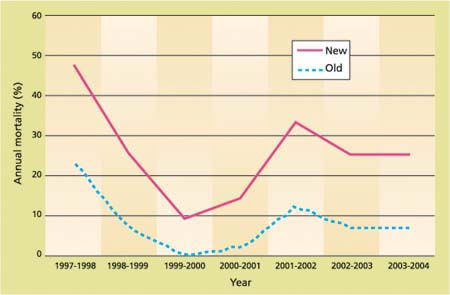
Fig. 3 Average percentage annual death loss for old versus new seedlings from the linear mixed-effects regression model.
After the first year, only 46.0% of the new seedlings survived, as compared to 79.0% for the old group (fig. 2). By the 7th year, only 8.7% of the new seedlings were still alive, compared to 48.2% of the old seedlings. The linear mixed-effects regression model for the percentage annual death loss shows a significant difference in death rate for the two age groups (table 4). New seedlings died at a significantly faster rate than older seedlings. The death rate caused by rodents was not different between the two groups (about 1.5% for both groups).
Influence of precipitation
Mortality tended to fluctuate from year to year, presumably because of differing environmental conditions (fig. 3). The precipitation for the moisture year 1997–1998 was 27.0 inches (67.4 centimeters), more than double the 40-year average of 12.7 inches (31.8 centimeters). The 1998–1999, 1999–2000 and 2000–2001 annual rainfalls, on the other hand, were closer to the long-term average at 10.6, 12.2 and 9.1 inches (26.5, 30.6 and 22.8 centimeters), respectively. However, there was not a significant correlation between annual death loss and precipitation.
Previous research regarding the relationship between precipitation — or soil moisture — and blue oak regeneration has not been consistent. For instance, a 15-year study by Phillips et al. (unpublished data, 2004) found a significant, positive correlation between annual death loss and precipitation in older seedlings, while Gordon et al. (1991) reported that both the growth and survival of planted blue oak seedlings were positively related to soil water availability. In this study, the effects of precipitation on seedling growth and survival were unclear due to the shorter duration of the evaluation period and the fact that the study was not replicated in different rainfall zones.
Protecting seedlings
The two age groups of blue oak seedlings had different survival percentages and rates of height growth during the 7 years of this study. The data indicates that blue oak seedlings are especially vulnerable to mortality factors when they are young and small. Younger seedlings died at a far faster rate than larger seedlings, but those that remained alive tended to grow faster than their older counterparts. Once seedlings had grown for approximately a decade and become established, however, the chances were good that they would remain alive, although many grew extremely slowly or even diminished in height. If enhancing natural oak regeneration is a goal and efforts are made to protect existing oak seedlings to help them grow to the sapling stage ( see page 16 ), we recommend that these efforts focus on established, older seedlings rather than on newly germinated ones.
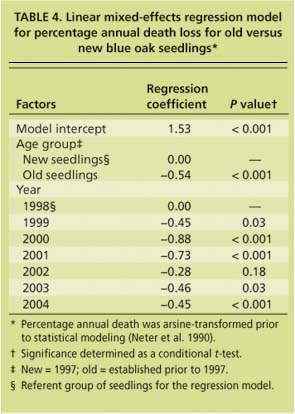
TABLE 4 Linear mixed-effects regression model for percentage annual death loss for old versus new blue oak seedlings⋆

Acorns are a critical food for numerous wildlife species; the acorn woodpecker stores acorns in a dead “granary” tree. In this study, blue oak seedlings became established after about a decade and were more likely to survive than younger seedlings.
Blue oak seedling age influences growth and mortality

