


All Issues
California handlers describe marketing issues for organic kiwifruit
Publication Information
California Agriculture 58(3):169-175. https://doi.org/10.3733/ca.v058n03p169
Published July 01, 2004
PDF | Citation | Permissions
Abstract
California kiwifruit is one of several commodities with a federal marketing order covering both conventional and organic products. Organic kiwifruit handlers were asked for their views on marketing issues for organic kiwifruit and how they differ from those for conventional kiwifruit. Organically produced kiwifruit accounted for 6.1% of total 2001-2002 California kiwifruit production. There are several differences between organic and conventional kiwifruit. The average size of organic kiwifruit is smaller than conventional kiwifruit; sales tend to occur later in the marketing year; there are more intermediaries (middlemen) in the marketing channel; and a larger proportion of organic product is packed in smaller shipping containers. The traditional price premium for organic product is decreasing as organic production increases, and it is not unusual for organically produced kiwifruit to be sold as conventional fruit in conventional marketing channels. Product appearance is becoming more important to consumers of organic fruit, who are now less willing to pay premium prices for cosmetically challenged product.
Full text
Organic fruit production and marketing is a fast-growing niche that is beginning to utilize traditional channels to reach an expanding market segment. As organic production grows and consumer preferences change, marketing practices will evolve. Many California commodities have established government-sponsored and producer-financed marketing programs that cover both organic and conventional production. California has federal and state marketing-order programs, commodity commissions and councils to assist in marketing agricultural products. A study of marketing issues associated with federal marketing orders for organic kiwifruit, almonds and winter pears surveyed all organic handlers for these crops (Carman et al. 2004). We report on the results for California organic kiwifruit.
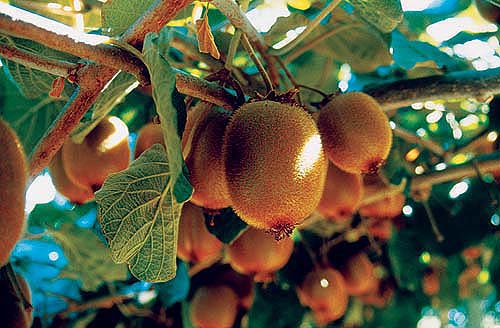
About 4,500 acres of kiwifruit is grown in California. The crop lends itself to organic production, as there are currently few major pest or disease problems.
California kiwifruit producers are well organized to market their crop. They secured the California legislature's approval of the California Kiwifruit Commission (CKC) in 1980 and voted to establish a federal marketing order for kiwifruit in October 1984. The CKC authorizes promotion and research activities, which are funded by an assessment on all shipments of California kiwifruit. The federal marketing order, administered by the Kiwifruit Administrative Committee (KAC), established mandatory minimum quality standards for grade, size and maturity that were first used for California kiwifruit during the 1987-1988 marketing year. These quality standards were extended to imports of fresh kiwifruit in 1990. Individual handlers pay mandatory inspection fees, and KAC activities are financed by an assessment on all shipments of California kiwifruit. Based on reported sales, California kiwifruit growers paid total assessments of approximately $524,500 in 2000-2001 and $433,200 in 2001-2002. The majority of these funds were used by the KAC for promotional activities.
California kiwifruit acreage
California kiwifruit plantings began during the 1960s, and commercial production was established in the early 1970s. Kiwifruit is a perennial vine crop that typically requires 4 years before the first crop and another 4 years to reach full production. The California Agricultural Statistics Service (CASS 2002) first reported kiwifruit acreage data in 1974, consisting of 56 bearing acres and 349 nonbearing acres. Initially, a combination of high yields for mature acreage and high prices encouraged plantings of the new crop. There was a sustained increase in kiwifruit acreage that extended through 1988. Total kiwifruit acreage peaked at 7,851 acres in 1988, and bearing acreage peaked at 7,330 acres in 1990. With low plantings and increased removals, bearing acreage decreased to 4,867 acres in 1997 and has since ranged from 4,500 to 4,875 acres (fig. 1). The 1997 Census shows that kiwifruit acreage was concentrated in the northern Sacramento Valley (Butte, Sutter and Yuba counties with 35.5% of total acreage) and in the southern San Joaquin Valley (Fresno, Tulare, Kern and Kings counties with 52.9% of total acreage). Tulare County (1,533 acres) and Butte County (1,475 acres) accounted for 51.4% of total California acreage.
As new kiwifruit acreage came into production in California and other areas around the world, average prices came down from their early highs. After acreage peaked in 1988, production reached a high of more than 52,000 tons in 1992 accompanied by record low average prices. The growers' response to low prices was to reduce new plantings, remove marginal acreage and investigate alternative methods for reducing unit costs of production and improving market returns. Severe price pressures in the early 1990s encouraged some growers to convert kiwifruit acreage to organic production. Kiwifruit culture in California lends itself organic production (Hasey et al. 1997). Typically, there are few insects or diseases that cause major problems, weeds are shaded from growing under mature full-canopied vineyards, and nutrient removal by the crop is minimal. Some of the most effective insecticides are also acceptable to regulators of organically grown produce. Since by law the organic transition and certification process requires 3 years, significant production of organic kiwifruit is a rather recent development.

Data on existing acreage and production of organic kiwifruit is scarce. To estimate organic kiwifruit acreage, we began with a directory of California Certified Organic Farmers (2001) to sort growers who listed kiwifruit as a crop grown. Some growers listed only kiwifruit while others listed multiple crops. We attempted to contact all growers of multiple organic crops to obtain a separate acreage estimate for kiwifruit. We also contacted each of the nine kiwifruit handlers known to be packing organic kiwifruit during the 2000-2001 crop year (October-September). Eight handlers provided us with estimates of their total pack and the acreage of organic kiwifruit operated by their growers. Using this procedure, we identified 20 organic kiwifruit producers with a total area of 290.5 acres. This appears to be almost all of the organic kiwifruit acreage—the California Department of Food and Agriculture (CDFA) reported 297 acres of registered organic kiwifruit in 2002, accounting for almost 6.5% of total California kiwifruit acreage.
Each handler was asked for their observations on acreage and production trends for California organic kiwifruit. Only one of the handlers who also produces kiwifruit reported that their own production would increase as their new plantings matured. None reported that they had nonbearing vines or acreage in transition to organic. One of the handlers reported being in contact with a grower who was converting 3 to 5 acres of kiwifruit to organic. Another handler reported that a neighboring ranch with 100 acres of kiwifruit was converting to organic production. Despite the stability reported for their own operations, all of the handlers expected production and sales of organic kiwifruit to increase in the future. This expected increase would come from higher yields as existing new organic plantings mature, from new plantings and conversions of conventional vineyards to organic, and from increased imports of organic kiwifruit. All of the handlers expressed the view that increased availability of organic kiwifruit will place downward pressure on prices.
Import/export, consumption, prices
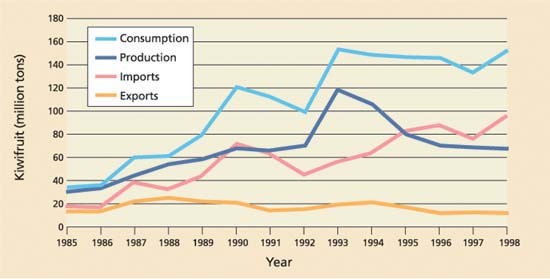
Kiwifruit imports and exports are a significant factor in seasonal marketing and pricing patterns. In addition to seasonality of supply and demand, several factors determine U.S. kiwifruit imports and exports. Three important trends are evident (fig. 2). First, total U.S. consumption of kiwifruit has increased significantly. Second, except for a pause from 1991 through 1994 when New Zealand exports were curtailed in an international trade dispute, the role of imports in total U.S. consumption has increased over time; kiwifruit imports have exceeded exports since 1985, and the United States continues to be a net importer of kiwifruit. Finally, U.S. exports of kiwifruit have decreased over time, due to lower production in California and increasing competition from New Zealand and Italy in international markets.
Total and per capita U.S. consumption of kiwifruit has grown substantially since 1985, when 33.4 million pounds (0.14 pounds per capita) were consumed. Total U.S. kiwifruit consumption grew almost fivefold by 2000, reaching 158.2 million pounds with per capita consumption at 0.57 pounds. Imports of 114.3 million pounds accounted for just over 72% of total 2000 consumption.
The CKC issues Kiwifruit Industry Shipment System (KISS) reports during the marketing year, including data on the total crop broken down by package and size of fruit (CKC 2001, 2002). Beginning with the 2000-2001 crop, the commission began issuing separate reports for the total crop and for the organic portion. These reports provide the first detailed estimates for California organic kiwifruit production and marketing practices. The KISS summary report for the 2000-2001 crop year reported a total estimated marketable crop of 7,493,293 tray-equivalents (7 pounds of kiwifruit), with 397,723 tray-equivalents of organic kiwifruit. Organic kiwifruit accounted for 5.3% of total 2000-2001 California kiwifruit production. Total 2001-2002 production decreased to 5,834,847 tray-equivalents, with 353,806 tray-equivalents of organic kiwifruit. With the smaller crop, the organic share of production increased slightly to almost 6.1% of production.
There is no data on the role of organic kiwifruit in exports and imports. Some organic handlers indicated that at one time, they exported organic kiwifruit to several markets, including Canada and Japan, but that they cannot compete with Italian production in European markets. Only two handlers reported organic exports during the 2000-2001 marketing year, and the volumes were less than 10% of each of their packs. Domestic organic kiwifruit has competition from organic imports, which is likely to increase given New Zealand's push to expand organic production and sales. California organic handlers complained of price pressure from increased New Zealand kiwifruit in the domestic market during November and December 2000.
Reports from the U.S. Department of Agriculture (USDA) Foreign Agricultural Service (FAS) indicate that both Chile and New Zealand will be expanding production and exports of organic kiwifruit. FAS did not have estimates of the amount of organic kiwifruit produced in Chile, but did indicate that fresh organic kiwifruit production is expected to grow and that the target markets are the United States and Japan (USDA 1998). Zespri International, the marketing agency for New Zealand kiwifruit, has been encouraging New Zealand growers to convert to organic production. New Zealand produced almost 4,900 metric tons of organic kiwifruit in 1999 (about 2.5% of total production) and the organic share is projected to grow to 10% by 2005. Recently, New Zealand has exported more than half of its organic kiwifruit to Japan, with the remainder shipped to Europe and the United States. Prices for New Zealand organic kiwifruit sold in Europe, Japan and the United States have recently ranged from 8% to 15% above prices received for conventional fruit.

The standard measure for kiwifruit is a tray that holds 7 pounds of fruit. During the 2000-2001 growing season, 5.3% of the California kiwifruit crop was certified as organic, representing nearly 400,000 tray-equivalents of marketable fruit.
Organic kiwifruit has commanded a premium market price, although the premium has decreased over time as production and imports have increased. Organic kiwifruit handlers reported that there has been an organic premium of 15% to 50%, depending on the style of pack, quality and time of the year. Single-layer flats of U.S. No. 1 grade fruit tend to have the highest prices per pound. An organic price premium of 20% to 30% was the value most often mentioned. Five of the eight handlers reported that organic kiwifruit prices tend to be more variable than prices for conventional kiwifruit. Two handlers reported that the differential between organic and conventional kiwifruit tends to increase as the season progresses and is greatest in February and March. Another handler reported that he tended to get the highest prices for organic kiwifruit early in the season. Despite the typical price premium, it is not unusual for organic kiwifruit to be sold as conventional kiwifruit for the conventional price. Five of the eight handlers reported that, on occasion, they had sold organic kiwifruit for the same price as conventional. This may be due to the seasonal price variability mentioned or, in some cases, to market channel requirements.
Kiwifruit marketing patterns
Kiwifruit is picked firm and unripe, and placed in refrigerated storage. It then ripens within a few days of being taken out of storage. While California kiwifruit can be harvested in September, most is picked from mid-October through the end of November. The fruit must mature on the vine and reach a minimum soluble solids requirement of 6.2% to 6.5% before being harvested to achieve ideal sweetness when ripe. Kiwifruit that remains on the vine longer and reaches a higher soluble solids level will taste sweeter when ripe and also tends to store better, making it easier to handle and more appealing to consumers. California kiwifruit is typically marketed during the 8-month period from October through May. There is usually competition with Southern Hemisphere imports during April, May, October and November when the marketing seasons overlap. There are important differences in marketing organic and conventional kiwifruit.
Marketing channels.
Organic handlers were asked to whom they sold their organic kiwifruit and if their mix of customers differed from that of conventional kiwifruit handlers. One organic handler also packs a large volume of conventional fruit, others formerly packed conventional fruit, and all are in close contact with conventional handlers. While organic kiwifruit is sold to many of the same customers as conventional kiwifruit (such as large chains, specialty stores and institutional buyers), there are some important differences. The largest volume of organic kiwifruit is sold to organic wholesalers and distributors who service the retailers who stock organic products. Some handlers have established relationships with small and midsized chains that tend to specialize in organic foods, such as Whole Foods or Wild Oats. One handler said, “Organic customers differ from conventional customers in that they order smaller quantities and often use a common distributor or buying office, which provides the mix of organic produce that their individual stores require.” Another commented, “The natural food and traditional food stores that buy organic kiwifruit expect better quality.” Three of the handlers said that they had, on occasion, sold organic kiwifruit to large chain buyers, but none listed large national chains as their primary outlet.
Shipping containers.
Common shipping containers for kiwifruit include single-layer trays, three-layer cartons, cartons with twenty 1-pound film bags, 22-pound volume-fill cartons, 125-pound bulk bins and other containers. The single-layer tray is the premium package, accounting for just 2.65% of the 2001-2002 crop. This is a significant change from several years ago. In 1987-1988, for example, over 80% of the crop was packed in single-layer trays and only about 8% was packed in volume-fill cartons. Volume-fill cartons, with 85% of the estimated 2001-2002 total crop, are currently the most popular container. This changeover in shipping containers is in part due to the difference in packing and container costs, with the cost for volume-fill being about 40% of that for single-layer trays. Also, the increase in consumption has increased demand for containers holding more fruit.

It takes about 8 years for kiwifruit vines to reach full production.
There is a significant difference in the containers used to pack conventional and organic kiwifruit. Overall, volume-fill cartons are the most popular container but their use varies. Conventional kiwifruit handlers have recently packed 82% of their pack in volume-fill cartons but the comparable proportion for organic handlers was just over 44%. Organic kiwifruit handlers tend to have more variety in their packaging, with just over 16% in single-layer trays, another 17% in 1-pound film bags, and 16% in 125-pound bins. The distribution of package types for organic kiwifruit is based on the more specialized nature of their market and the existence of premium prices for the organic product.
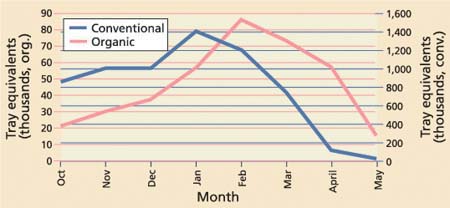
Fig. 3. Average monthly sales for California organic and conventional kiwifruit, 2000-2001 and 2001-2002 crop years. Source: CKC 2001, 2002.
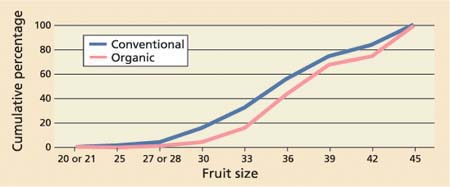
Fig. 4. Cumulative distribution of organic and conventional kiwifruit by size, California average of 2000-2001 and 2001-2002 crop years. Size refers to the number of kiwifruit required to fill a standard single-layer tray weighing 7 pounds. Source: CKC 2001, 2002.
Seasonal shipment patterns.
The California kiwifruit harvest begins in September, with significant shipments to retail markets beginning in early October. Sales typically begin slowly during October and November because of the presence of competing fruit from Chile and New Zealand. Sales build through December, typically peak in January, remain high during February and March and then decrease significantly in April and May. While imports are typically present throughout the year, significant shipments from the new crop in the Southern Hemisphere begin to arrive in April and May. There may be small shipments of domestic kiwifruit in June, July and August, but an abundance of new crop imports significantly weakens the price for old crop fruit. The actual pattern of shipments varies from year to year as a result of crop size, the pattern and volume of imports, and price trends.
Average monthly shipments of organic and conventional kiwifruit for California's 2000-2001 and 2001-2002 crop years show that the organic crop tends to be shipped later in the marketing year than shipments of conventional kiwifruit (fig. 3). The majority of conventional kiwifruit was shipped during the first 4 months of the season, while the majority of organic kiwifruit was shipped during the last 4 months. This is consistent with industry participants' descriptions of previous marketing patterns. An observed tendency to market organic kiwifruit later in the year was attributed to (1) less competition for organic fruit at the end of the marketing season because there has not been much imported organic fruit, and (2) the ability to store organic kiwifruit. For the 2000-2001 crop year, a portion of this difference in marketing conventional and organic fruit may have been due to market conditions during the first 3 months of the marketing season. In our discussions with organic kiwifruit handlers during November and December, each expressed concern about the large amounts of New Zealand kiwifruit still in the market and the effects of late imports on prices. Based on the shipment data, it appears that organic handlers delayed sales more than conventional handlers did, while waiting for market conditions to improve.
Fruit-size distribution.
The fairness of the federal marketing order's minimum-grade and size requirements is sometimes questioned, particularly when cultural methods and production conditions may impact the shape and size distribution of fruit. An important question for this study is, “Do minimum grade and size standards have an equal impact on organic and conventional kiwifruit?” To provide a partial answer we can compare the size distribution of organic and conventional kiwifruit for the most recent crop. We have no data on the amount of kiwifruit that is culled for not meeting grade and size standards.
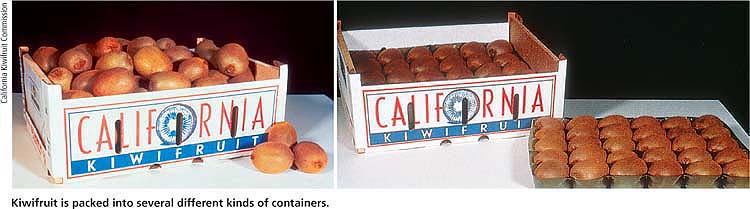
Kiwifruit is packed into several different kinds of containers.
For comparative purposes, fruit size refers to the number of kiwifruit required to fill a standard single-layer tray weighing 7 pounds (fig. 4). For example, size 25 refers to 25 fruit to a tray and size 45 to 45 fruit to a tray. Size 20 or 21 is the largest fruit and 45 the smallest. The minimum weight of a tray has been 7 pounds, which is the conversion factor used by the industry to calculate the volume of kiwifruit in tray-equivalents (TE). Careful comparisons of the percentage size distributions show that for the most recent crop year, conventional kiwifruit tended to be larger on average than organic kiwifruit. Looking at cumulative percentages for 2000-2001, only 2.8% of organic kiwifruit was size 30 or larger, while 12.86% of conventional kiwifruit was size 30 or larger. At the other end of the scale, the proportion of kiwifruit size 39 and smaller was 52.26% and 40.96%, respectively, for organic and conventional kiwifruit. In 2001-2002, 5.8% of organic kiwifruit was size 30 or larger, while 19.0% of conventional kiwifruit was size 30 or larger. At the other end of the scale, the proportion of kiwifruit size 39 and smaller was 60.4% and 48.0% respectively, for organic and conventional kiwifruit. The smaller average size for organic kiwifruit that is evident for both years is consistent with “conventional wisdom” in the industry.
In a survey, California organic kiwifruit growers noted that their customers increasingly want high-quality fruit.
Views on marketing issues
The main activity of the federal marketing order is to regulate and enforce mandatory minimum quality standards for grade, size and maturity. Organic and conventional kiwifruit must satisfy the same standards to be marketed. Organic kiwifruit has a smaller size distribution than conventional kiwifruit, which could pose grading problems for organic handlers and producers.
Handlers, as might be expected, expressed a variety of opinions on the value of minimum quality standards for organic kiwifruit. Two of the smallest producer-handlers, who market only their own fruit, said that the minimum size requirement tended to result in more culls for organic than conventional fruit. One, however, added that the economic impact was minimal because organic consumers would not buy the small cull fruit. Four of the eight handlers were very positive and supportive of the existing quality standards for kiwifruit. They stated that the quality standards help them sell their organic kiwifruit by maintaining consistent quality and by giving buyers confidence in the product. Each of the four also believed that the current standards are fair. One handler criticized the maturity standard for having sugar levels that are too low (the average minimum maturity of 6.5% soluble solids was reduced to 6.2% for the 2000-2001 season).
The organic kiwifruit handlers who we interviewed are concerned about the quality of their pack. One handler described the market evolution for organic kiwifruit as beginning with customers who were most concerned about farming practices. As consumers became acquainted with organic kiwifruit, they came to appreciate the taste but were not too concerned with appearance. Now, customers want fruit that not only tastes good but also is free of blemishes. Another handler commented that, “given a choice, customers prefer and are willing to pay for less cosmeti-cally challenged fruit.” Several handlers indicated that organic consumers are a quality-conscious and premium market segment that demands higher quality than conventional buyers. Statements such as “my consumers set the standards, which are above the minimum standards,” are common. One handler markets only his U.S. No. 1 organic kiwifruit as organic; the kiwifruit that does not meet the No.1 grade standard are sold as conventional kiwifruit.
Handlers were asked if the CKC advertising and promotion programs help them market organic kiwifruit and if they do any advertising on their own. All but one of the handlers said that the present CKC advertising and promotion program does not help market organic kiwifruit. One handler commented that past CKC advertising and promotion had helped market both organic and conventional kiwifruit, but with smaller budgets and reduced efforts the present impact is small. He also commented that the commission does a good job with a limited budget. Another commented that the commission advertising and promotion programs are oriented to conventional kiwifruit, do not help market organic kiwifruit and are a waste of time and money. Four of the eight handlers spend a moderate amount of advertising dollars for their organic kiwifruit. All of the expenditures are in industry publications (such as the organic directory, “The Packer”) directed toward the trade to inform wholesalers and other buyers about the availability of organic kiwifruit. None of the handlers do any consumer advertising.
Organic kiwifruit handlers offered a number of suggestions regarding marketing order and CKC programs that they believe would help market organic kiwifruit. Regarding grades and standards, handlers proposed higher minimum sugar levels and a separate set of standards for organic fruit. One handler was concerned that California kiwifruit is at a disadvantage to imports because the USDA does not enforce mandatory minimum quality standards for foreign suppliers. Most suggestions involved advertising and promotion. Handlers would like to have CKC programs specific to organic kiwifruit, such as point-of-purchase materials, a page on the CKC Web site, a specially designed PLU (price lookup) sticker, and separate advertising and promotion on the attributes of organic kiwifruit.
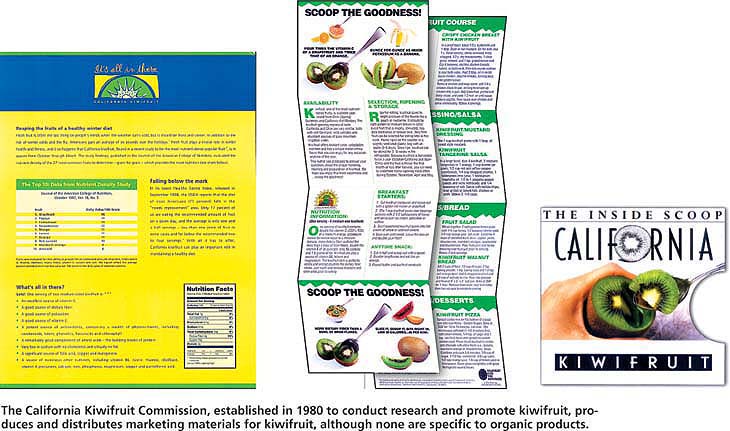
The California Kiwifruit Commission, established in 1980 to conduct research and promote kiwifruit, produces and distributes marketing materials for kiwifruit, although none are specific to organic products.
Marketing organic fruits and nuts
Based on discussions with handlers, it is possible to draw some tentative conclusions about marketing organic fruit and nuts. First, there is a finite set of consumers who are willing to pay a premium price for organic products, and as available supply approaches the quantity demanded by these consumers, there will be increased downward pressure on the organic premium. Most of the organic handlers contacted in this study expect organic production to continue to increase and the difference between the price of organic and conventional product to decrease. Some organic product is already being sold as conventional product and the amount will increase as organic production and the availability of organic imports increases.
Second, the quality expectations of organic consumers are changing and there is less willingness to accept cosmetic defects on organic fruit. This trend will place even more pressure on overall returns for organically produced crops. Third, organic crops will continue to be niche products with more middlemen and more specialized channels of distribution than is typical for conventional fruits and nuts. Finally, while successful industry advertising and promotion programs may improve prices for conventional products and provide a higher floor price for organic products, conventional advertising and promotion typically provide little information on the unique features that organic producers attribute to their products. Organic producers face a significant challenge in building the demand for their products to maintain price differentials as production increases.
California handlers describe marketing issues for organic kiwifruit

