


All Issues
Historical reference crop ET reliable for irrigation scheduling during summer
Publication Information
California Agriculture 53(4):32-36. https://doi.org/10.3733/ca.v053n04p32
Published July 01, 1999
PDF | Citation | Permissions
Abstract
Average daily historical reference crop evapotranspiration was calculated using 13 to 15 years of daily evapotranspiration from 10 sites in California. Maximum average values, generally occurring in June, ranged between 0.25 and 0.32 inches per day at most of the sites. Absolute percent relative errors were minimum during July and August, ranging between 5% and 13% for all but one site. About 25% to 35% of the variation in the historical data reflected year-to-year variation; the remaining variation was due to seasonal trend and variability about the seasonal trend. To prevent overirrigation or underirrigation during deviation from the historical evapotranspiration value, growers should monitor soil moisture or check real-time evapotranspiration.
Full text
Historical ET can be used to develop in advance a tentative irrigation schedule for the growing season
Average or historical values of reference crop evapotranspiration are sometimes used for scheduling irrigations. The advantages of using historical evapotranspiration are convenience, ease of use, and the ability to project irrigation dates. The error in using historical evapotranspiration instead of real-time evapotranspiration is often stated as being less than 10% for areas such as the Central Valley, although no published data appear to exist supporting this claim.
The California Irrigation Management Information System (CIMIS) is a statewide network of weather stations used to calculate a reference crop evapotranspiration, which is the evapotranspiration of grass. The FAO Penman equation with the wind function of the Penman-Monteith equation is used to calculate the evapotranspiration with hourly averages of the climatic data. These evapotranspiration calculations are available to growers for real-time irrigation scheduling.
The purpose of this study is to calculate the historical reference crop evapotranspiration using CIMIS data and to determine the potential errors in using historical reference crop evapotranspiration for irrigation scheduling instead of using real-time reference crop evapotranspiration.
Analysis of sites
For this analysis, we selected 10 CIMIS sites covering a wide range of climatic conditions in California, each with 13 to 15 years of data. Sites in the San Joaquin Valley were Five Points (about 70 miles southwest of Fresno), Parlier (southeast of Fresno) and Shafter (near Bakersfield). Sites in the Sacramento Valley were Davis, Nicolaus (near Yuba City) and Durham (near Chico). One site was in the Imperial Valley (Brawley), two sites were along the Central Coast (Castroville and Santa Maria) and one site was in the intermountain area of Northern California (McArthur).
We calculated the average evapotranspiration, standard deviation and coefficient of variation for the first and last part of each month using the 13 to 15 years of data. Percent relative error (RE) was calculated by:
RE = 100 (ETa - ETm) / ETa (1)where ETa is real-time reference crop evapotranspiration and ETm is historical average of each first or last part of the month. Absolute values only were used to simplify results.
The REs were calculated using a 7-day moving cumulative total within each time period, that is, first and last part of each month. The process consisted of calculating the cumulative real-time evapotranspiration for each moving total (ETa) and the average value for the first or last half of the month multiplied by 7 (ETm). A 7-day moving total was selected because irrigation intervals of at least 7 days are commonly used. A longer moving total had little effect on the RE.
The maximum RE was determined by developing a cumulative frequency distribution of the REs for each time period, which showed the percent of time that the actual RE is equal to or less than some predetermined RE. The maximum RE was defined as the RE for which actual RE values were equal to or less than 70% of the time.
In addition, average values of solar radiation, maximum and minimum temperatures, wind speed, maximum and minimum relative humidity and annual rainfall were determined for each time period to describe some of the climate characteristics of these sites.
Climatic characteristics
Figure 1 shows the climatic characteristics of the sites using average values for the first 15 days of May, June, July and August. Average solar radiation was relatively constant for the Central Valley (San Joaquin and Sacramento valleys), with the exception of the Nicolaus site and the Davis and Durham sites in May. Smaller average values occurred for the coastal sites, while larger values occurred for Brawley in May and June compared with the Central Valley sites.
Average wind speed showed a trend of decreasing as the summer progressed for most of the sites except for Brawley. Average wind speeds in the Central Valley were less along the east side of the valley than along the west side (Five Points, Davis). The largest wind speeds occurred for the Castroville site.
Average maximum temperatures increased with time in May and June, while similar values occurred in July and August. Maximum temperatures were the smallest at McArthur and the largest at Brawley. Average maximum temperature decreased slightly with distance along the Central Valley, with the largest maximum temperature at Shafter and the smallest at Durham. Average minimum temperatures (not shown) behaved similarly with time to the maximum temperatures. Both average minimum and maximum relative humidity increased with distance along the Central Valley. Average values tended to be smaller for the latter two months. The largest values occurred for the Castroville site and the smallest for the Brawley site.
Average annual rainfall increased with distance from Shafter along the Central Valley, although rainfall at Nicolaus was slightly higher than that at Durham. The largest amount occurred at McArthur, and the smallest value at Brawley.
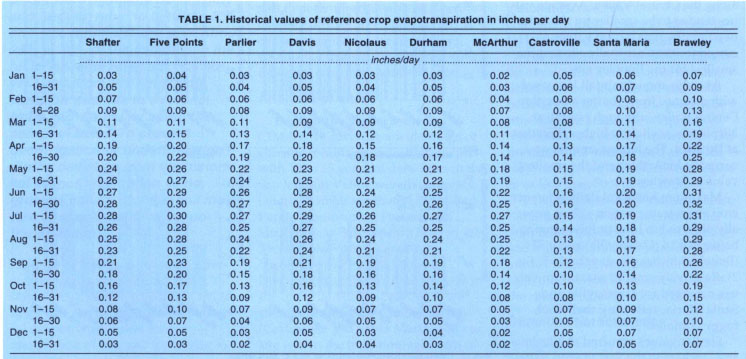
Maximum historical daily reference crop evapotranspiration values generally occurred in June or July, ranging between 0.16 (Castroville) and 0.32 (Brawley) inches per day (table 1, fig. 2). Relatively smaller maximum values occurred for Castroville and Santa Maria, reflecting their cool, foggy climates.
Similar values occurred at Nicolaus and Durham in the Sacramento Valley, with larger values at Davis, Similar values also occurred at Shafter and Parlier in the San Joaquin Valley, with larger values at Five Points. The larger West Side values reflect the wind speeds along the west side of the Central Valley, as seen from the climate data.
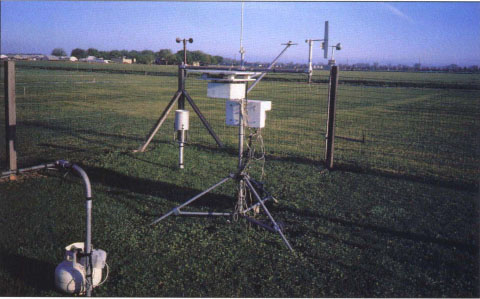
The California Irrigation Management Information System (CIMIS) is a statewide network of weather stations used to calculate a reference crop evapotranspiration.

We analyzed the evapotranspiration data for statistically significant differences using the Duncan's multiple range test with a level of significance of 5%. Results for June, July and August generally showed Brawley, Santa Maria and Castroville to be statistically different both from each other and from the other sites. For the Central Valley sites, the east-side sites generally were statistically different from the west-side sites, but east-side sites were statistically similar to each other as were the west-side sites. The McArthur site was generally statistically similar to the east-side sites of the Central Valley.
The standard deviation, a measure of the absolute variability, generally increased with time to a maximum between April and June and then decreased for all sites (fig. 3). At Castroville, the maximum value occurred in June and July, and in September at Brawley. Similar behavior occurred among the Sacramento Valley sites, with maximum values generally occurring in April, followed by a decrease with time to a minimum in August. Values at Davis were greater compared with the other sites. This behavior did not occur for the San Joaquin Valley sites, where similar behavior among sites occurred with maximum values in April, followed by a decrease throughout the remainder of the year. Slightly higher values occurred at Five Points.
Coefficients of variation, defined as the ratio of the standard deviation to the average value, show the relative variability with respect to the average value. These values were generally large in the winter and late fall and minimum in the summer months, usually about 10% (fig. 4). Thus, although standard deviations were larger in the summer months compared with the other months, the absolute variability was less than 10% of the average value for most of the sites. The large values for the winter months reflect their very small average values. An exception was Castroville, for which the coefficients of variation ranged between 25% and 45%.
Maximum errors showed a behavior similar to that of the coefficients of variation (table 2). Minimum REs occurred in July or August for most of the sites, except for Castroville and Brawley (June minimum). Maximum errors in July and August ranged between 5% and 12%, except for the Castroville site. Maximum errors in June were between 7% and 13%, except for the Castroville and McArthur sites. For the Castroville site, little trend with time of year occurred.

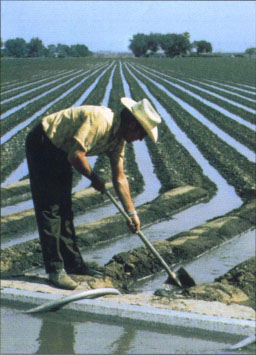
Solar radiation strikes leaf and soil surfaces, causing water to evaporate or transpire. As leaf water transpires, water flows from the soil into the roots and up the plant stem through channels called xylems. This flow of water depletes the soil moisture, which is replenished by irrigation.
Sources of variation in the reference crop evapotranspiration data are between-year variation and within-year variation. Seasonal trend and random fluctuations about the trend cause within-year variation. Both sources of variation can be affected by replacing sensors or relocating a station, the effect of which is unknown.
We evaluated contributions of between-year and within-year sources to the total variation in the data using one-way analysis of variance, which partitioned the total variation into variation within a year and variation between years. The analysis was conducted for time periods between March and October for Davis, Parlier, Castroville, Brawley and McArthur to represent a range of the climates. Within-year variation contributed most to the total variation, ranging between 65% and 75%. Between-year contributions ranged between 25% at Davis and 35% at McArthur of the total variability.
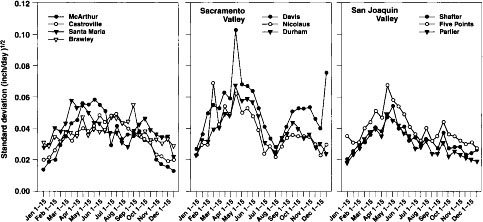
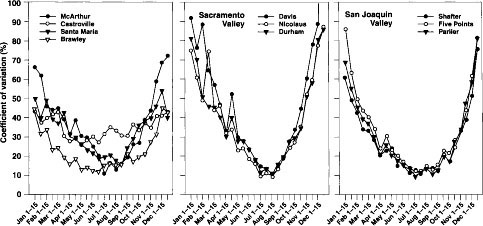
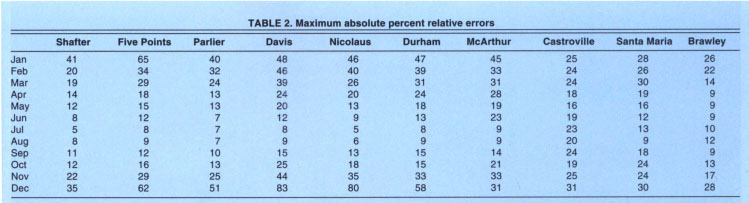

TABLE 3. Historical reference crop values to be used for system design where higher cash-value crops sensitive to water stress are grown
Even though REs were less than about 13% most of the time during June through August for most of the sites, real-time reference crop evapo-transpiration should not be ignored. Time-series analysis showed that realtime evapotranspiration frequently does not vary randomly about an average value, but instead may deviate from the historical values for periods of time of at least 3 days. Thus excessive overirrigation or underirrigation during these periods could occur by using historical values depending on the amount of deviation from the historical value and the length of time of the deviation. We recommend soil moisture monitoring or checks with real-time evapotranspiration if historical data is used.
Design flow rate
The average values in table 1 can be used to calculate the design flow rate of an irrigation system using the following equation:
Q = (449 x A x D) / Twhere Q is the design flow rate in gallons per minute, A is the acres irrigated, T is the hours required to irrigate the field, and D is the design depth to be applied in inches. The design depth depends on the average daily reference crop evapotranspiration, the desired interval in days between irrigations, the crop coefficient and the irrigation efficiency. Note that the time period at which the maximum crop evapotranspiration occurs may differ from that of maximum reference crop evapotranspiration, depending on the time period for which the maximum crop coefficient occurs.
For high cash-value crops that are sensitive to water stress, irrigation systems designed with excess capacity may be desirable to prevent water stress during periods when the realtime reference crop ET greatly exceeds the historical value. Values of reference crop evapotranspiration in table 3 can be used for these crops. These values, based on cumulative frequency distributions of the real-time daily reference evapotranspiration, are those for which the real-time reference evapotranspiration is equal to or less than 70% of the time.
Conclusions
The maximum error using historical reference crop evapotranspiration instead of real-time reference crop evapotranspiration during July and August was found to be equal to or less than 13% most of the time for all sites except one. The error was equal to or less than 13% for June except for two sites. Higher values occurred for earlier and later months. Within-year variability accounted for most of the variability in the historical data.
These results suggest that the error in using historical evapotranspiration for irrigation scheduling is small during the summer months, particularly in the Central Valley. Use of the historical reference crop evapotranspiration allows a seasonal irrigation schedule to be developed if one is willing to accept the error. However, real-time evapotranspiration still needs to be considered.
Historical reference crop ET reliable for irrigation scheduling during summer

