


All Issues
Network-smart extension could catalyze social learning
Publication Information
California Agriculture 69(2):113-122. https://doi.org/10.3733/ca.E.v069n02p113
Published online April 01, 2015
NALT Keywords
Abstract
Social learning, learning from others, has value in extending knowledge about farm management through networks of growers. Exactly how much value depends on the structure of the networks. We employed social network analysis to study knowledge networks and social learning in three American Viticulture Areas in California: Central Coast, Lodi and Napa Valley. In a survey, growers confirmed that experiential and social learning are more useful for accessing information about farm management than formal learning. UC Agriculture and Natural Resources Cooperative Extension (UCCE) was found to be well positioned to access and spread knowledge through the grower networks but a bottleneck exists — many knowledge-sharing relationships and relatively few staff. We also found that grower participation in traditional outreach activities, e.g., meetings and demonstrations, is a strong predictor of their number of knowledge-sharing relationships, so UCCE and other agricultural support organizations have an important role to play in strengthening networks. Several network-smart extension strategies might help alleviate the bottleneck and rewire networks to more efficiently connect those with questions to those with solutions.
Full text
Agriculture is a knowledge-intensive industry. Therefore, developing new and innovative extension strategies is among the most pressing challenges facing contemporary agriculture (Pretty et al. 2010). Studies have highlighted the value of social learning (people learning from one another), and social learning is considered a critical pathway for extending knowledge about farm management (Pretty and Chambers 2003; Roling and Wagemakers 1998; Warner 2007a). Compared to when they were established in the late 19th century, today's extension systems are more complex, dynamic and networked, and the work of extension may benefit by capitalizing on the network structure of the modern knowledge system (Lubell et al. 2014).
Elsewhere, we have shown a positive relationship between growers’ number of knowledge-sharing relationships and their adoption of beneficial management practices (Hoffman 2013). However, before Cooperative Extension and other agricultural support organizations (e.g., commissions, marketing orders, voluntary grower associations) can develop extension strategies that harness the natural process of social learning, we must first understand the structure of these knowledge networks and identify leverage points that can rewire the network to connect those with solutions to those with questions.
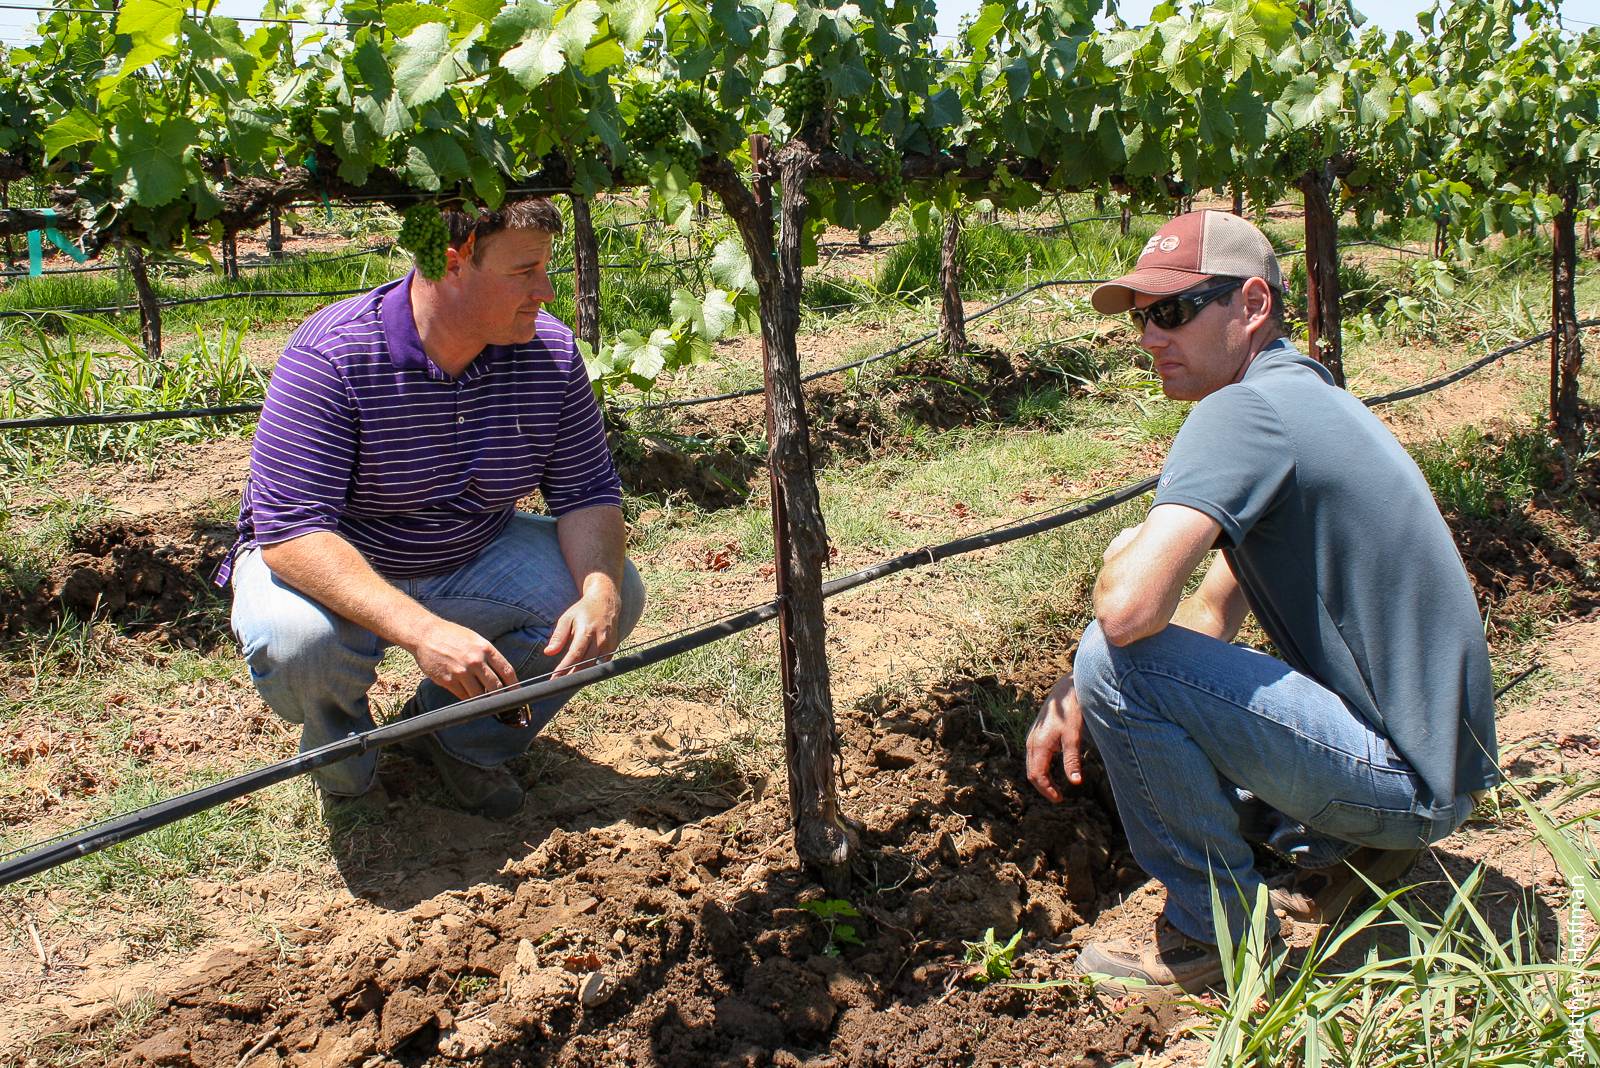
Lodi wine grape growers Craig Ledbetter (left) and Aaron Lange (right) share thoughts after observing a trial pass of a prototype multirow in-row cultivator, engaging in both experiential and social learning simultaneously. In a survey of growers, field research and trials (experiential) and interpersonal relationships with other growers (social) were ranked as highly useful sources for learning about vineyard management.
The objective of our research was to find a scientific basis on which networksmart extension strategies can be based. We employed social network analysis (Wasserman and Faust 1994) to study knowledge networks in three American Viticulture Areas (AVAs) in California: Central Coast, Lodi and Napa Valley. We compared the usefulness of social learning to that of two other learning pathways: experiential learning and formal learning. The three knowledge networks in the AVAs were modeled to identify growers and outreach professionals who are optimally positioned in the network to access and share information. Next, we looked at the association between grower participation in extension activities and their number of knowledge-sharing relationships — where a positive association would suggest participation may increase their capacity for social learning. At the conclusion of our work, we were able to suggest strategies for network-smart extension.
Viticulture partnership networks
The three AVAs in our study contain many active partnerships — intentional multiyear relationships among agricultural support organizations, scientists, other stakeholders and growers with the goal of extending practical knowledge about agriculture through applied research and outreach (Warner 2007a). The numerous partnerships in California viticulture have supported grower adoption of sustainable winegrowing practices across geographical regions (Broome and Warner 2008; Ohmart 2008; Shaw et al. 2011). According to Warner, “California's winegrape growers have undertaken more partnerships to greater effect than those of any other U.S. crop” (Warner 2007b). Partnerships that have had a positive influence on grower adoption of sustainability practices in the Central Coast, Lodi and Napa Valley AVAs include the Vineyard Team (formerly the Central Coast Vineyard Team), the Lodi Winegrape Commission and the Napa Valley Grapegrowers, respectively. The California Sustainable Winegrowing Alliance is a state-level partnership.
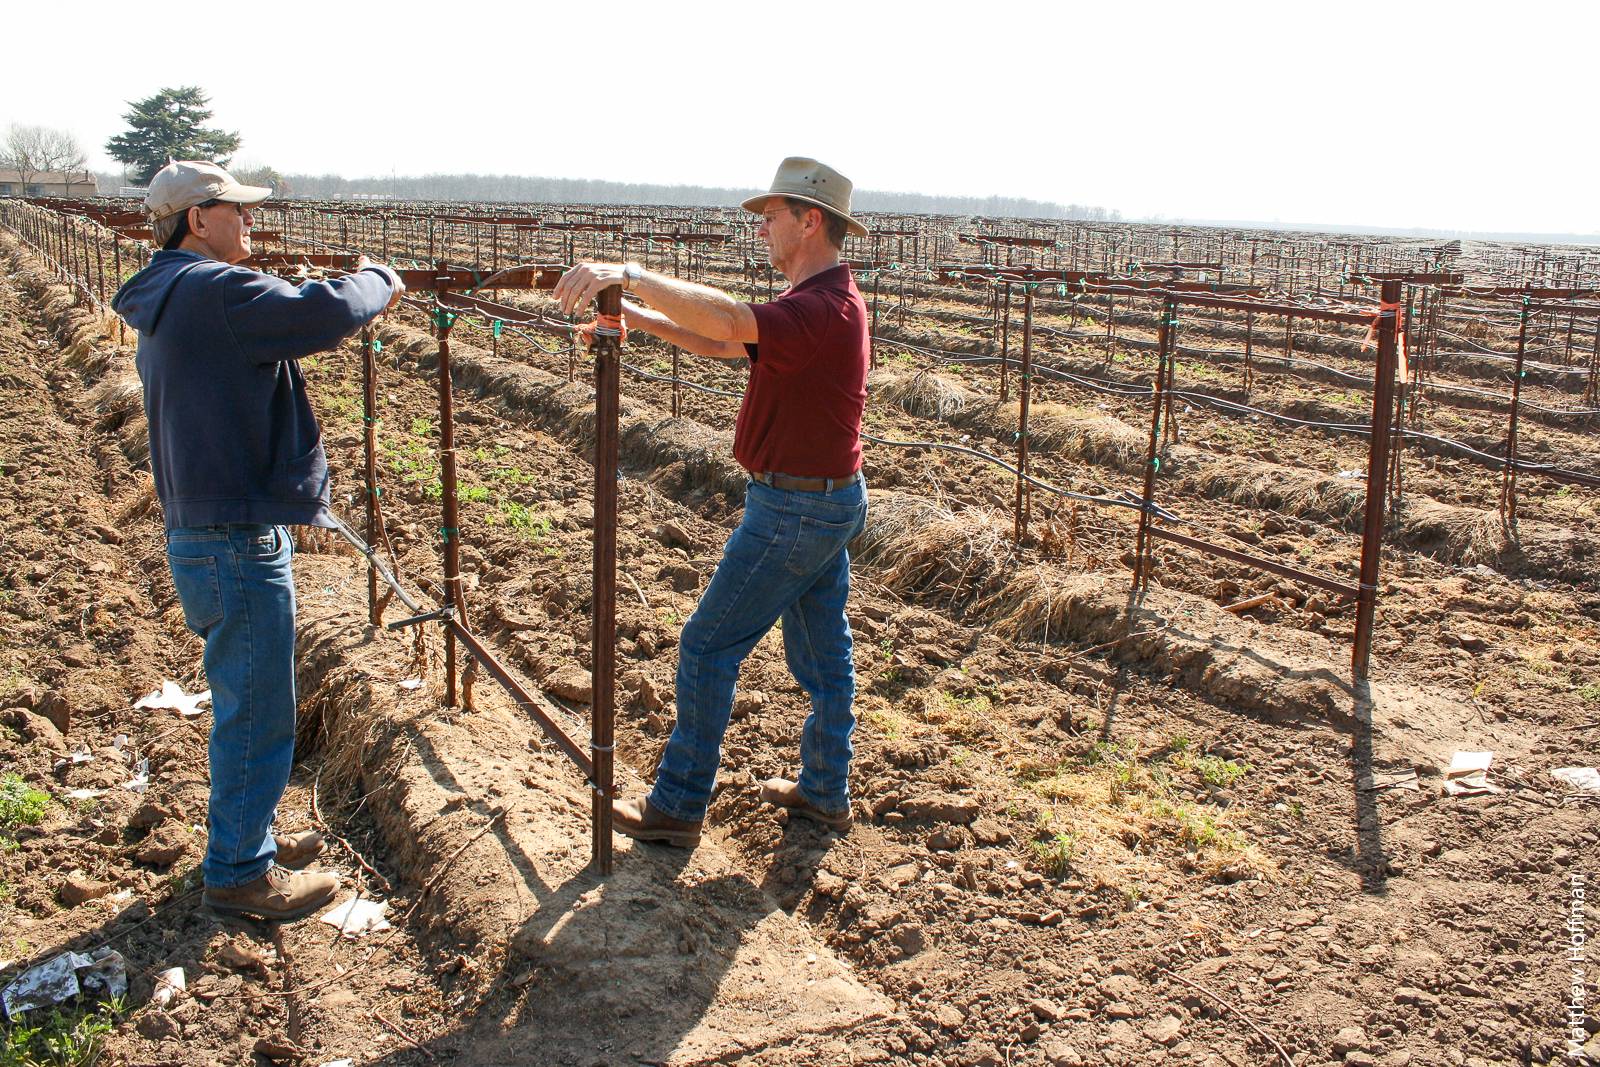
UCCE San Joaquin County farm advisor Paul Verdegaal (right) discussing trellising systems with Lodi wine grape grower Joseph Spano (left). This boots on-the-ground approach is a hallmark of traditional extension, but is becoming increasingly difficult to implement with low ratios of farm advisors to growers. Network-smart extension strategies may be useful for extensionists who are overloaded with inquiries.
One of the defining characteristics of partnerships is their networked structure (Lubell et al. 2014; Warner 2007a). As opposed to the traditional Cooperative Extension model, which relies on vertical transfer of knowledge from universities to practitioners, partnerships are ordered horizontally and knowledge is created and shared among diverse groups of people (including those working within Cooperative Extension). Prence and Grieshop (2001) summarized the operational principles of the partnership model as local leadership, personal relationships, equal partnership, collaborative learning, responsive farmer outreach and voluntary practice adoption. The partnership model demonstrates that agricultural knowledge is extended most effectively through strategies that support learning from practical experience and from participating in a network of other growers and experts (Hassanein 1999; Roling and Wagemakers 1998; Warner 2007a).
Learning pathways
Agricultural knowledge is extended through three learning pathways: formal, experiential and social.
The defining feature of formal learning resources is that they transfer knowledge through text from expert to learner, where the learner is strictly the receiver of knowledge (Cofer 2000). The expert determines the content to be learned and the objective of the learning process. Formal learning resources we considered in our study include agricultural journals, industry magazines, text or reference books, Internet resources and self-assessment workbooks.
Experiential learning is learning by doing. Knowledge is acquired through experiences, observations and engagement with the surrounding environment (Kolb 1984). It is continually sharpened through a repeated cycle of engagement in practice, reflection on process and outcomes, and refinement of decision making. Kolb (1984) defines experiential learning “as the process whereby knowledge is created through the transformation of experience.” Experiential learning is meaningful to growers because it has direct and tangible implications in the practice of farming. Examples of experiential learning include growers’ observations of their vineyard conditions, trial and error, on-farm research and written recordkeeping.
Social learning is learning from others, a social process of knowledge distribution among a network of individuals who share a common set of practices, knowledge and decision-making contexts (Wenger 1998). Knowledge networks are the social infrastructure that support social learning (Phelps et al. 2012). An individual's ability to engage in social learning activities such as the generation, access and spreading of ideas is either constrained or enabled depending on the structure of the network and the individual's position in that network. Examples of social learning considered in this paper include knowledge sharing between growers and pest control advisers (PCAs), UC Agriculture and Natural Resources Cooperative Extension (UCCE) staff, and vineyard sales representatives.
Knowledge network theory
We couch social learning in three theoretical viewpoints: diffusion of innovation, cultural evolution and social capital (Lubell and Fulton 2008; Shaw et al. 2011; Tomich et al. 2011). These theories help explain human behavior as a function of one's position in the knowledge network. They provide a framework for understanding how and why information is or is not legitimized, vetted and ultimately adopted by individuals within a social network. These theories serve as a basis for designing network-smart extension strategies.
Diffusion of innovation theory argues that knowledge about the relative benefits and costs of innovations spreads through social networks over time (Rogers 2003; Rogers and Kincaid 1981). Early adopters of agricultural innovations bear the costs of experimentation and risk the chance of failure. Late adopters avoid these risks, but they may be slow to reap the rewards of successful innovations. The diffusion of innovation perspective sheds light not only on how new technologies and ideas are spread through a community but also on how their economic and practical worth is vetted among community members and on who benefits most from adoption of successful innovations. In the long run, the community adopts only successful innovations.
Cultural evolution theory posits that beliefs and behaviors spread in a network through social mechanisms, mechanisms such as an imitation of prestigious and successful individuals or a conforming to the most widespread behaviors in the network (Henrich 2001; Richardson and Boyed 2005). It suggests that social learning reduces the individual costs of knowledge development because lessons learned by one individual do not have to be learned personally by others in the network, leading to faster diffusion of innovations and understanding of their costs and benefits. These social processes of imitation and conforming have positive implications for extension when sound information and beneficial practices are spread through the network. However, they pose an extension challenge when prestigious or successful individuals, or a large group of people, in the network accept unfounded information or adopt ineffective practices. Hence, Cooperative Extension and other academic institutions have an important role in bringing science to bear on the ideas being spread through knowledge networks.
Social capital theory addresses the role and value of social connections in a community (Coleman 1990; Putnam 2000). Social capital among community members, and their shared trust, is key for solving collective action problems that require cooperation (e.g., reducing agricultural nonpoint source pollution requires adoption of proper irrigation and nutrition management practices from most growers in a watershed) (Ostrom 1990). Two types of social capital interest us.
Bonding social capital, the tight social ties among locals, is important when community cooperation and information sharing are necessary for solving local problems. Bridging social capital, the loose social ties to individuals outside of a community, is key for accessing information to solve new or otherwise challenging local problems (Flora and Flora 1993; Flora and Flora 2008). Social capital theory helps explain why some agricultural communities are able to solve local problems by sharing information locally and accessing information globally while other communities fail (Flora and Flora 1993).
Data collection
We collected our data with a mail survey that we customized for each of the three regions of study: Central Coast, Lodi and Napa Valley. The Lodi survey was delivered during 2010 and 2011. The Central Coast and Napa Valley surveys were delivered during 2011 and 2012. An advisory committee of 25 growers and outreach professionals was consulted during all stages of the research process. We compiled lists of growers by using the 2010–2011 wine grape pesticide use reports from the 10 counties in the Central Coast region (Alameda, Contra Costa, Monterey, San Benito, San Luis Obispo, San Mateo, Santa Barbara, Santa Clara, Santa Cruz, Ventura), the two counties in the Lodi region (Sacramento, San Joaquin) and the one county in the Napa Valley (Napa). As mandated by the California legislature, growers are required to report their use of pesticides, including those approved for organic certification, to their county agricultural commissioner office. Growers not applying any pesticides to their vineyards would not be captured by these reports; however, due to the pervasiveness of powdery mildew (Erysiphe necator) in wine grapes, few growers refrain from applying fungicides. These lists are therefore representative of our grower population. We supplemented these lists and corrected inaccuracies using Internet searches of publicly available information.
Following the Dillman method (Dillman 2007), we sent an invitation letter followed by a first survey, a reminder, a second survey, a second reminder and a final reminder. We collected a total of 822 completed surveys out of 2,085 eligible respondents, a response rate of 39.42%. By region, we achieved response rates of 32.52% in the Central Coast (358 collected of 1,101 eligible), 53.41% in the Lodi region (227 of 425) and 42.40% in Napa Valley (237 of 559). We calculated response rates using AAPOR guidelines (AAPOR 2009).
Most useful information resources
We asked survey respondents to rate on a scale of 1 to 3 the usefulness of 21 information resources for learning about vineyard management, with “not useful” equaling a value of 1, “somewhat useful” equaling 2 and “very useful” equaling 3. We subsequently grouped the information resources by learning pathway (experiential, social or formal) and examined the ratings of the individual resources and each pathway.
Table 1 reports the percentage of respondents who selected each rating within each pathway. A majority of respondents rated information resources in the experiential (68%) and social (68%) learning pathways as very useful. Noticeably fewer respondents rated information resources in the formal (45%) path way as very useful. Only a small number of respondents rated the experiential (3%) and social (4%) pathways as not useful, but a larger number reported those in the formal pathway (10%) as not useful.
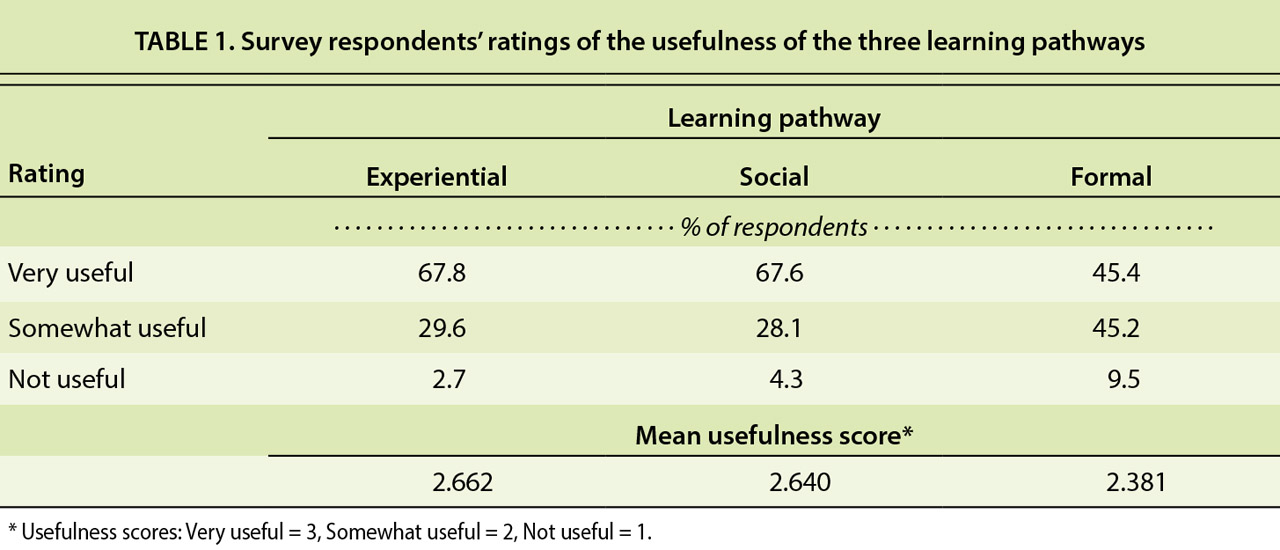
Table 1 also reports the mean usefulness scores for each learning pathway. The mean usefulness scores for information resources in the experiential and social learning pathways (2.66 and 2.64, respectively) were slightly higher than the average score of those in the formal pathway. The modal usefulness score (not shown) for each learning pathway was 3 (very useful).
Table 2 breaks down the learning pathway data to show the percentage of respondents who ranked each of the 21 information resources as being very useful. The resources are sorted in decreasing order of usefulness (as rated by all respondents in the three regions) and are color coded by learning pathway. The top 10 resources per region are listed.
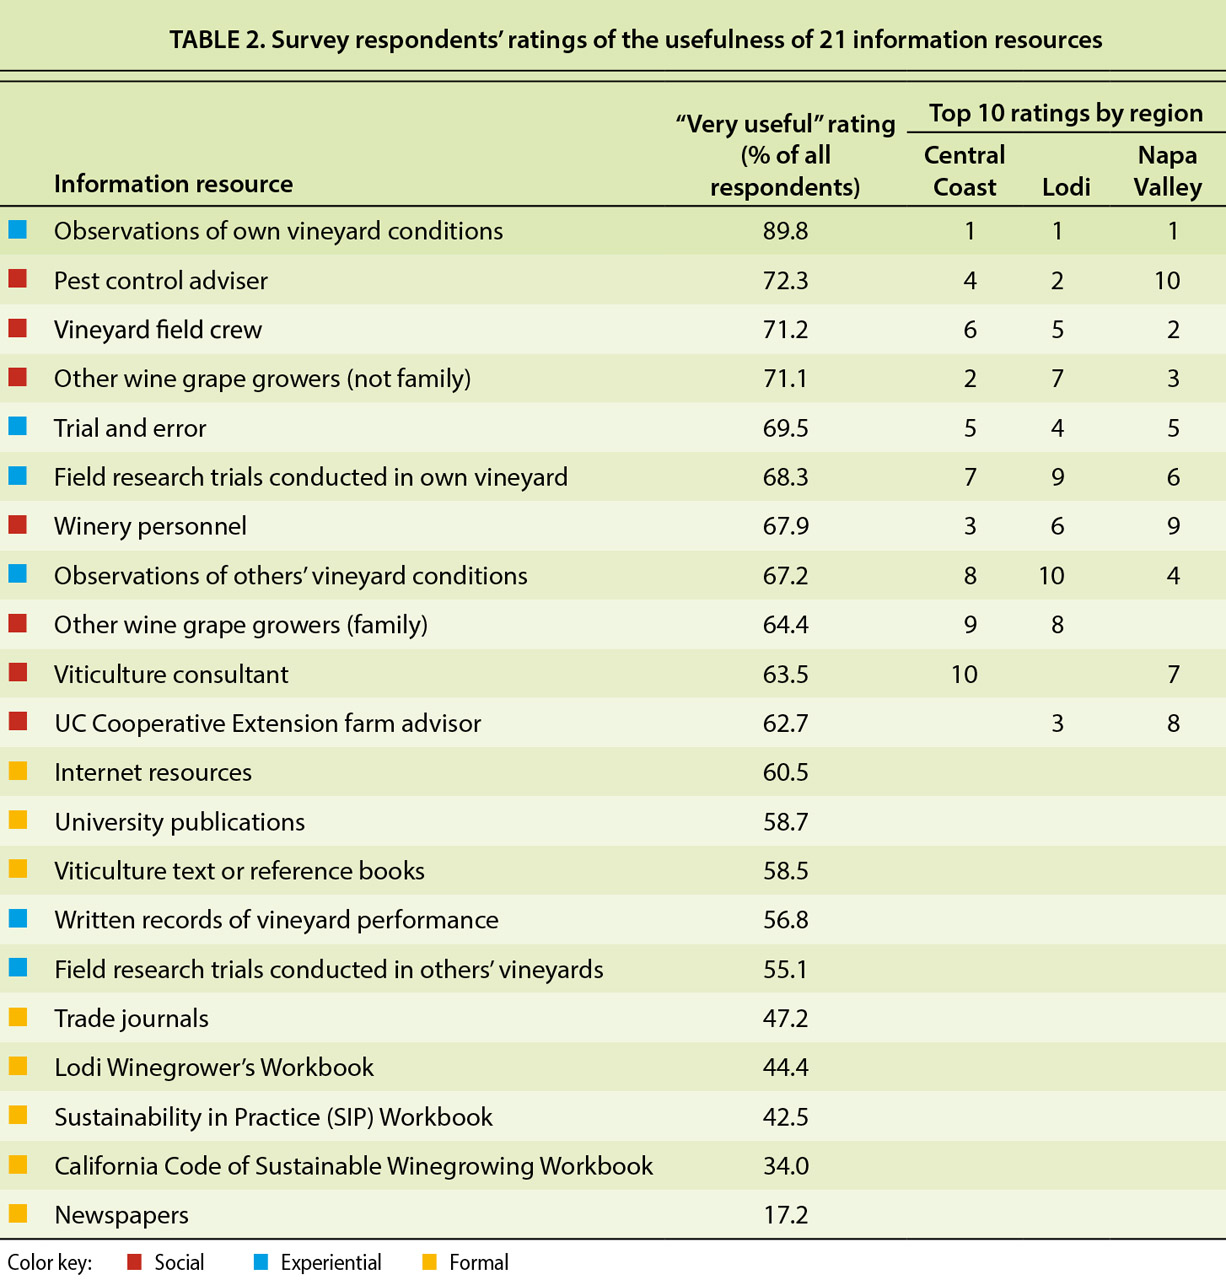
Some standout regional differences were found among growers’ preferred learning resources. First, pest control advisers (PCAs) were ranked much lower in Napa Valley (10th) than in the Central Coast (fourth) and in Lodi (second). The Napa Valley vineyards are frequently farmed by for-hire management companies, who may do their own pest monitoring and pesticide recommendations. In contrast, it is more common for Lodi growers to manage their own vineyards and hire a PCA. Another noticeable difference was that in Lodi, other growers were ranked as less useful (seventh) than they were in the Central Coast (second) and Napa Valley (third). One possible explanation is that Lodi growers rely less on other growers and more on PCAs and UCCE for advice, both of which were ranked as more useful in Lodi than in other regions. Overall, many of the same learning resources appeared in each region's top 10 list; though other growers (family) was absent in the Napa Valley list, viticulture consultants was absent in the Lodi list, and UCCE county farm advisors was absent in the Central Coast list.
The regional similarities in the data tell an interesting and useful story in terms of identifying network-smart extension strategies with universal application. Across the regions, respondents reported that observations of their own vineyard was the most useful learning resource, with 90% of respondents rating the resource as very useful (table 2), which points to the geographically universal power of experiential learning. PCAs, vineyard field crew and other wine grape growers (not family) — all social learning resources — were the second, third and fourth most useful learning resources, respectively, across the regions (table 2). The process of trial and error, and research trials conducted in a grower's own fields — experiential learning resources — were the next most highly ranked. All the top 10 resources across the regions were experiential or social. No formal learning resource appeared on any region's top 10 list.
These results validate the argument that grower learning is grounded primarily in personal experience and knowledge-sharing relationships, and the data is consistent with the findings of similar studies (Hood and Shearer 2001; Knapp and Fernandez-Gimenez 2009; Korsching and Malia 1991).
Position in network, knowledge agents
Since an individual's ability to access and spread knowledge is dependent on his or her position in the knowledge network, we modeled the networks in the three AVAs to identify how growers and outreach professionals are positioned in them. The three knowledge networks include growers and 12 types of outreach professionals: for-hire vineyard managers, PCAs, viticulture consultants, vintners, vineyard sales representatives, UCCE staff (farm advisors and specialists), winery representatives, labor contractors, research scientists, partnership staff, Natural Resources Conservation Service (NRCS) staff and county agricultural commissioners.
Using conventional network data collection methods that rely on survey respondents’ recollection of their recent social interactions (Knoke and Yang 2008), we asked growers to provide the names of other growers and outreach professionals with whom they communicated for advice about vineyard management. Matrices of relational data were constructed from this survey question. The matrices were non-directional. Even though survey respondents were asked only to nominate others with whom they communicated about vineyard management, we assumed that knowledge-sharing relationships were reciprocal.
Centrality.
We calculated individuals’ centrality in the networks. Centrality is a measurement of how connected an individual is to the rest of the network. Individuals with high centrality have great potential to be aware of others’ opinions, insights or expertise and to rapidly spread information throughout the entire network because they are connected to many others who themselves are connected to many others.
In our analysis, we used total degree centrality, which represents the total number of knowledge-sharing relationships as reported by respondents (Wasserman and Faust 1994). Note that we are not claiming this is an exact measure of an individual's actual (i.e., real-world) number of knowledge-sharing relationships. We believe total degree centrality is an underestimate of knowledge sharing relationships. For example, our data shows UCCE staff have on average 6.44 knowledge-sharing relationships with growers and PCAs have an average of 3.45. The actual number of relationships these outreach professionals have is likely larger. What is important in this analysis is not an individual's actual number of knowledge-sharing relationships but his or her relative degree of connectedness to other individuals in a knowledge network.
Figure 1 visualizes Lodi's knowledge network. Nodes represent individuals and ties represent knowledge-sharing relationships. Nodes are color coded: Green nodes represent individuals who are exclusively growers, aqua nodes represent individuals who are exclusively outreach professionals and blue nodes represent individuals who are both growers and outreach professionals (boundary-spanning professionals). Nodes are scaled by total degree centrality, with higher centrality represented by larger diameter nodes.
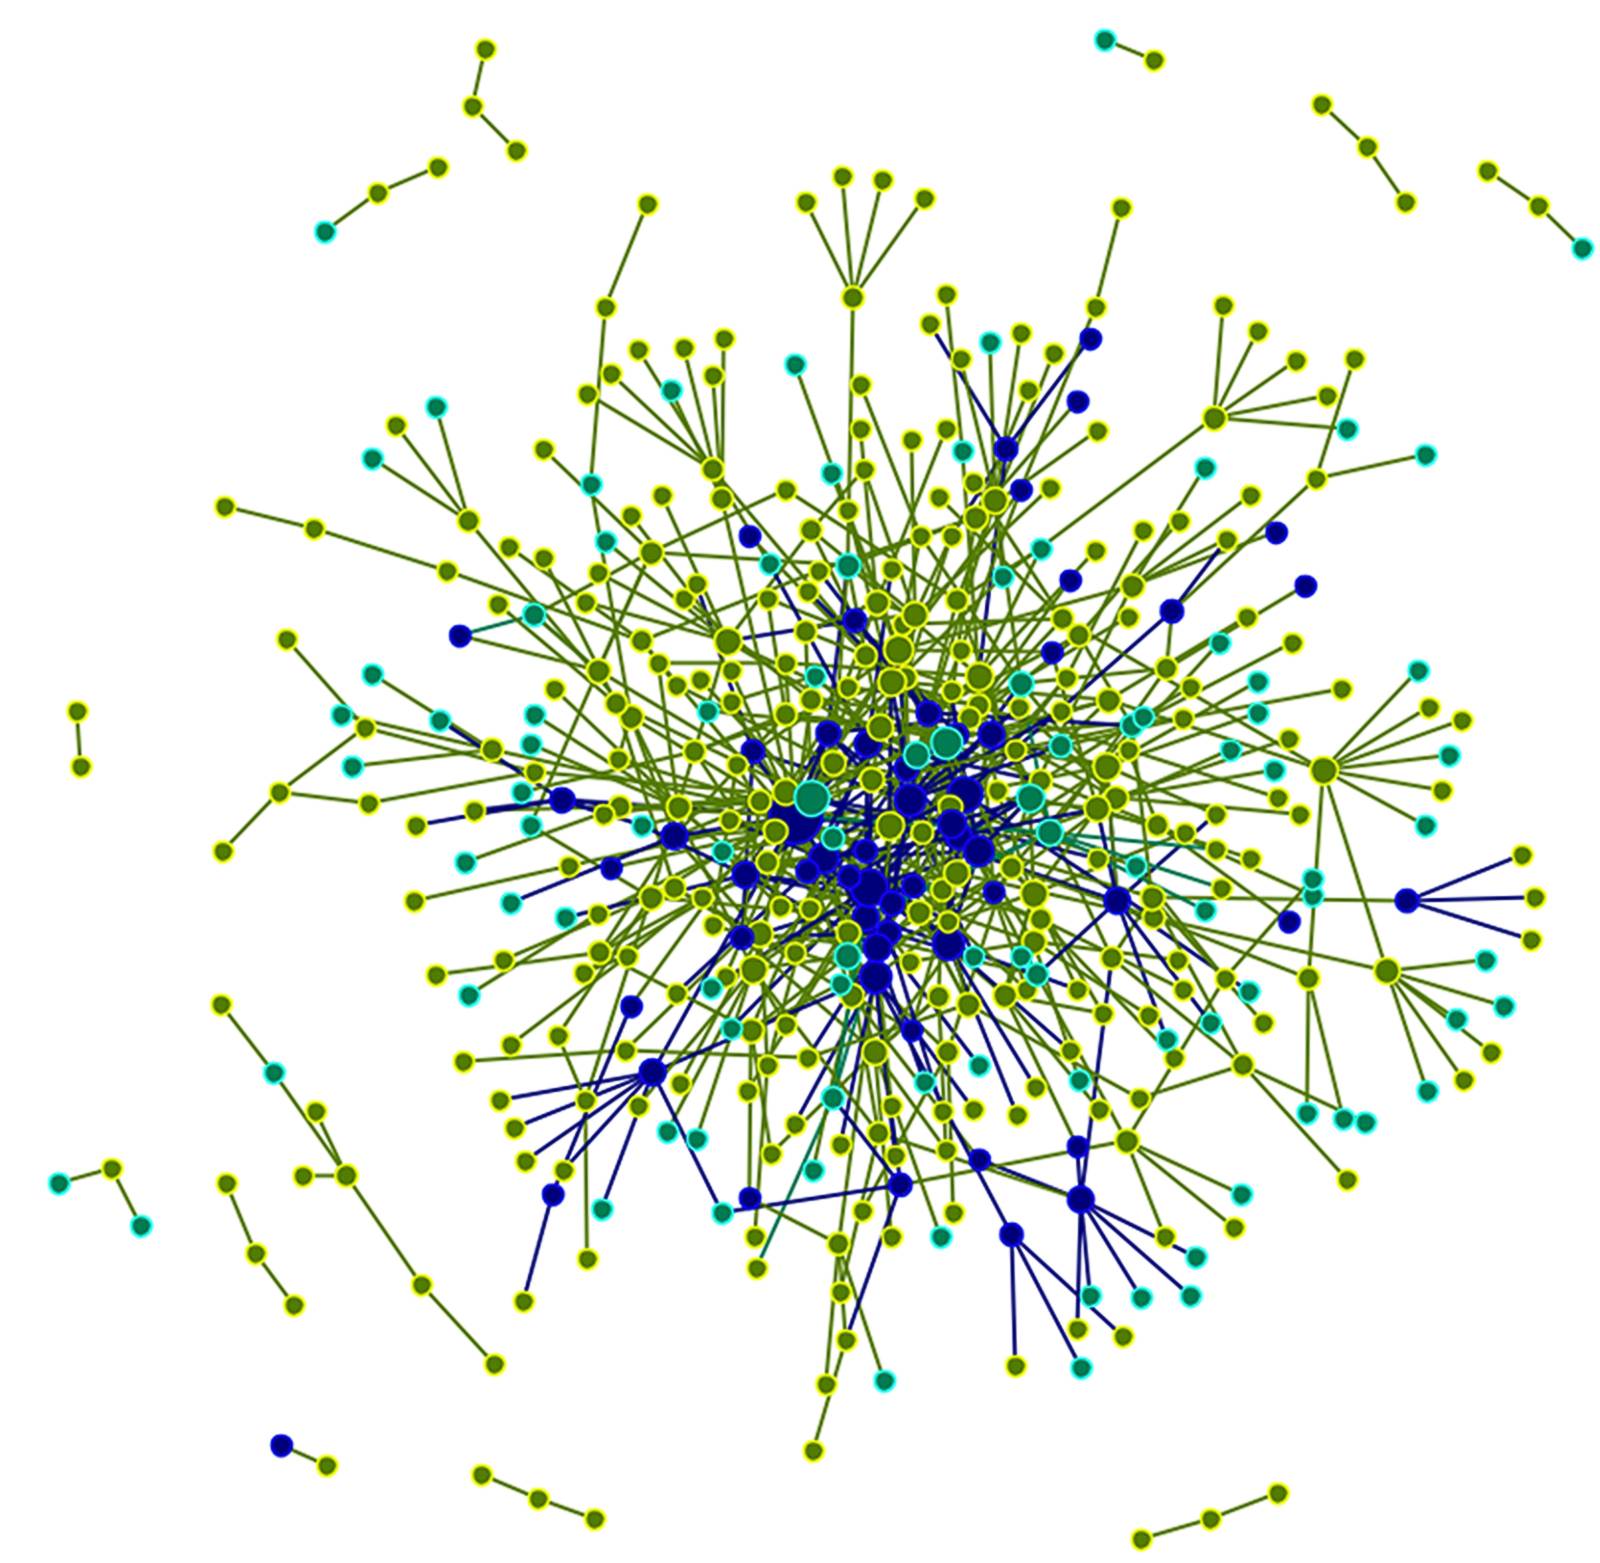
Fig. 1. Lodi's knowledge network. Nodes represent individuals and ties represent knowledge-sharing relationships. Green nodes represent individuals who are exclusively growers, aqua nodes represent individuals who are exclusively outreach professionals and blue nodes represent individuals who are both growers and outreach professionals (boundary-spanning professionals). Nodes are scaled by total degree centrality, with higher centrality represented by larger diameter nodes.
The figure yields cursory insight into which types of individuals are best positioned to access and spread knowledge. Nodes that have high centrality measures tend to be located close to the center of the network. Boundary-spanning professionals clearly tend toward the center. The patterning of those who are exclusively outreach professionals and exclusively practitioners is more difficult to discern. The Central Coast and Napa Valley knowledge networks were qualitatively similar to the Lodi knowledge network and expressed the same general patterns.
Table 3 reports the mean total degree centrality for the three types of individuals (growers, outreach professionals, boundary-spanning professionals) by region. On average across the regions, boundary-spanning professionals reported 5.51 knowledge-sharing relationships, which was 2.19 times more than growers and 3.65 times more than outreach professionals. By virtue of their relatively high number of knowledge-sharing relationships, coupled with their practical and expert training, these individuals with dual professions are likely some of the richest resources of viticulture knowledge. They are likely aware of other growers’ needs and challenges, are able to broker knowledge across the boundaries of science, industry and practice, and are well positioned to rapidly spread knowledge throughout the network.
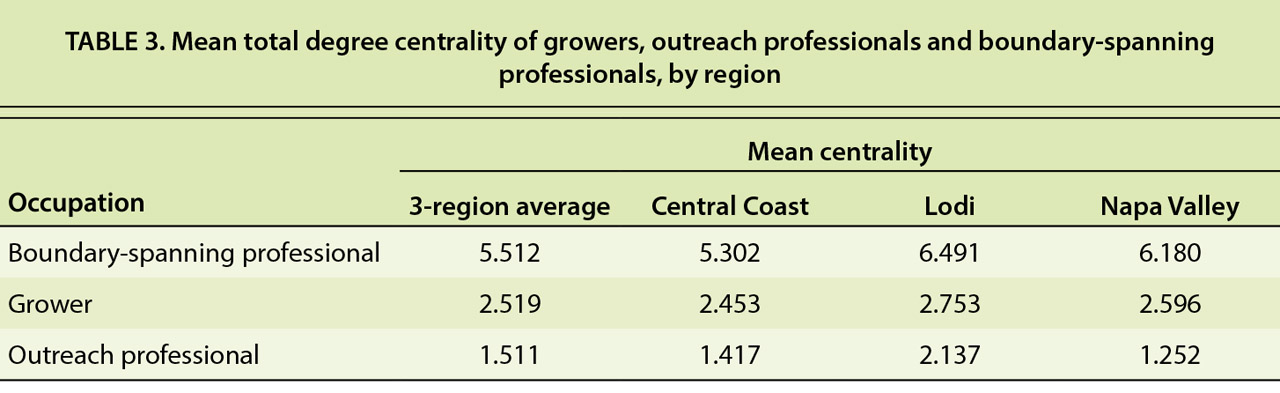
TABLE 3. Mean total degree centrality of growers, outreach professionals and boundary-spanning professionals, by region
Coverage.
Outreach professional types, as groups (e.g., PCAs, farm advisors), have varying degrees of knowledge-sharing relationships relative to the number of individuals making up that group. Therefore, different outreach professional types have more or less potential coverage. Coverage is the average number of knowledge-sharing relationships of an outreach type (mean total degree centrality) multiplied by the total number of individuals within that type (n). Coverage represents the number of growers that a given outreach type, as a population, can potentially connect with.
Based on the measurement of coverage, we found a distinct set of outreach professional types who have high potential to efficiently access and spread knowledge throughout the networks. Across the three regions, the top outreach professionals in terms of coverage were for-hire vineyard managers (table 4). Vineyard managers are great in number and their relatively high centrality ranks them highest in terms of coverage. They engage in a broad scope of vineyard activities during the entire growing season and commonly do so for multiple vineyard operations. Consequently, vineyard managers are influential knowledge agents (individuals well positioned in the network to access and spread knowledge)
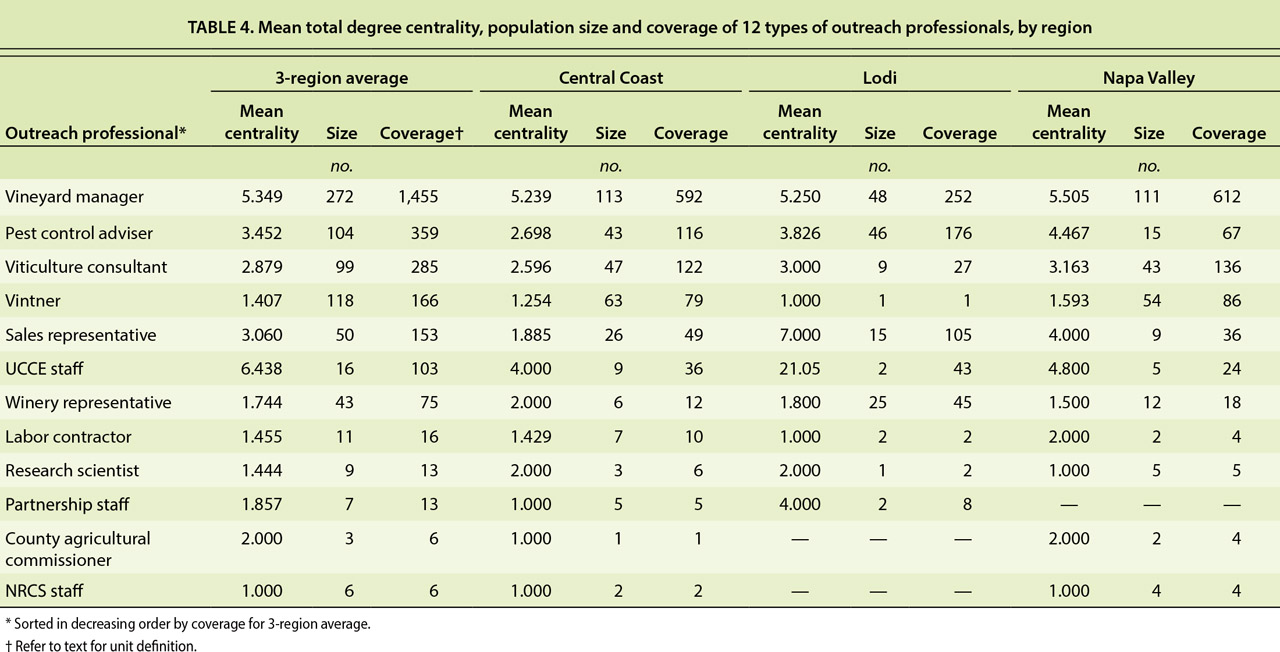
TABLE 4. Mean total degree centrality, population size and coverage of 12 types of outreach professionals, by region
PCAs, viticulture consultants, vintners and sales representatives round out the top five (table 4). These outreach professionals are involved in vineyard management through advising growers on fundamental vineyard activities such as pest control, nutrient management, equipment selection, and wine grape quality and yield enhancement practices. They too work with multiple growers. Vintners are a special case because individually they communicate with a relatively small number of growers, but their large population size means they have significant coverage over the network.
These five types of outreach professionals constitute a core group of knowledge agents. Note that there is considerable overlap between those outreach professionals with high coverage and those whom a large number of growers reported as being very useful for learning about vineyard management (table 2). This suggests that growers are already doing a good job of identifying individuals capable of providing useful advice and are cultivating knowledge-sharing relationships with them. For the most part, the pattern in coverage was also expressed in each individual region (table 4).
UCCE bottleneck.
UCCE faces a challenge in terms of its network coverage, which ranked sixth in our study (table 4). In California as a whole, UCCE staff had the highest mean centrality (table 4). Regionally, they had the highest mean centrality in Lodi, and in the Central Coast and Napa Valley they had the second highest. The highly central position of UCCE staff attests to the legacy of UCCE's traditional boots-on-the-ground approach. However, the population of UCCE county farm advisors and specialists is small, resulting in a coverage bottleneck — the large workload of sharing knowledge with many growers falls on a few UCCE staff. In Lodi, the bottleneck was unmistakable. The two UCCE staff in Lodi had, on average, 3.34 times more knowledge-sharing relationships than the 3-region average and 5.38 and 4.78 times more than their Central Coast and Napa Valley counterparts, respectively (table 4).
Velasquez et al. (2006) demonstrated that the ability to access and spread knowledge can be constrained by network bottlenecks. When outreach professionals are overburdened by too many requests for advice, as is increasingly the case with UCCE farm advisors (Cline 2003; Fruit Grower News 2007), the quality and quantity of their work may be compromised.
Our results suggest that UCCE, and therefore the interface between growers and UC Agriculture and Natural Resources, is presented with a unique extension challenge. UCCE is limited in its ability to access and spread knowledge through one-on-one social interactions such as farm calls. Our findings are consistent with UCCE's recent budget constraints (Cline 2003) and the historic trend of the decreasing number of farm advisors per number of growers (Fruit Grower News 2007). Distributing knowledge-sharing relationships over a larger population of outreach professionals could alleviate the bottleneck, and thus make the network function more efficiently.
Strengthening a knowledge network
Participation in outreach opportunities helps growers build knowledge-sharing relationships — for example, by attending workshops or by reading a newsletter (a referral for future interaction). Using a simple linear regression model, we tested the hypothesis that growers’ position in the knowledge network is a function of their participation in outreach activities. We conducted three separate regression analyses with data from each AVA.
The outcome variable used for this analysis was total degree centrality. The primary predictor variable was the total count of outreach events that survey respondents reported participating in. Due to differences in how the survey question was structured in the three surveys, we were not able to use a normalized participation measurement (i.e., percentage of events participated in) across regions. Regional comparisons can nevertheless be made.
The survey asked growers whether they had participated in outreach events within the past 5 years: attended informational field meetings, attended informational classroom-style meetings, read organization newsletters, spoke with organization staff, accessed organization internet resources, completed a sustainable viticulture certification program, completed a sustainable viticulture self-assessment program, attended regional and statewide viticulture industry fairs. The model included several secondary predictor variables as controls, including the number of acres managed (integer), age (six categories), education level (six categories), generations the respondent's family had been involved in agriculture (six categories), gross annual income (eight categories) and years of viticulture experience (integer).
The data included a total of 246 Central Coast, 146 Lodi and 181 Napa Valley cases (predictor variable by outcome variable combinations). The results are summarized in table 5. The unstandardized coefficients (beta) from the regression models are presented, which represent the expected change in the outcome variable for a one-unit change in the predictor variables. Across all three regions, the variable of participation in outreach events was a significant predictor of network centrality variable (while controlling for the six secondary predictors). Table 5 shows the coefficients for participation are positive and statistically different than zero (p < 0.01). In other words, the more outreach events survey respondents reported having participated in, the more knowledge-sharing relationships they had.

Table 5. Summary of regression analyses for variables predicting grower network centrality, by region
Interpretation of the coefficients in table 5 must consider the scales of the individual variables. To explain the predictor variable's influence on the outcome variable in meaningful terms, one can calculate the number of outreach events associated with a one-unit increase in a grower's knowledge-sharing relationships (data not shown in table 5). For example, in the Central Coast, participation in 4.78 outreach events over 5 years was associated with an increase of one knowledge-sharing relationship. In Lodi, the number of outreach events was 2.02, and in Napa Valley the number was 4.22. The noticeable difference in Lodi is explained by differences between the variables and not by differences in the outreach program effectiveness. The number of possible outreach events included in the Central Coast and Napa Valley surveys was greater than the number included in the Lodi survey. The range of outreach events participated in was 0 to 24 for the Central Coast, 0 to 27 for Napa Valley and 0 to 10 for Lodi. These differences in the data were reflected in the unstandardized coefficients.
Two regional differences were present. Napa Valley was the only region where gross annual income was a significant predictor of centrality. On average, Napa Valley wine grapes are valued at a much higher price per ton than those farmed in the Central Coast and Lodi (CDFA 2013). Our data shows a positive relationship between centrality and income in the Napa Valley, suggesting that the more successful growers are also among the most connected. In the Central Coast and Lodi, centrality was more evenly distributed across income levels.
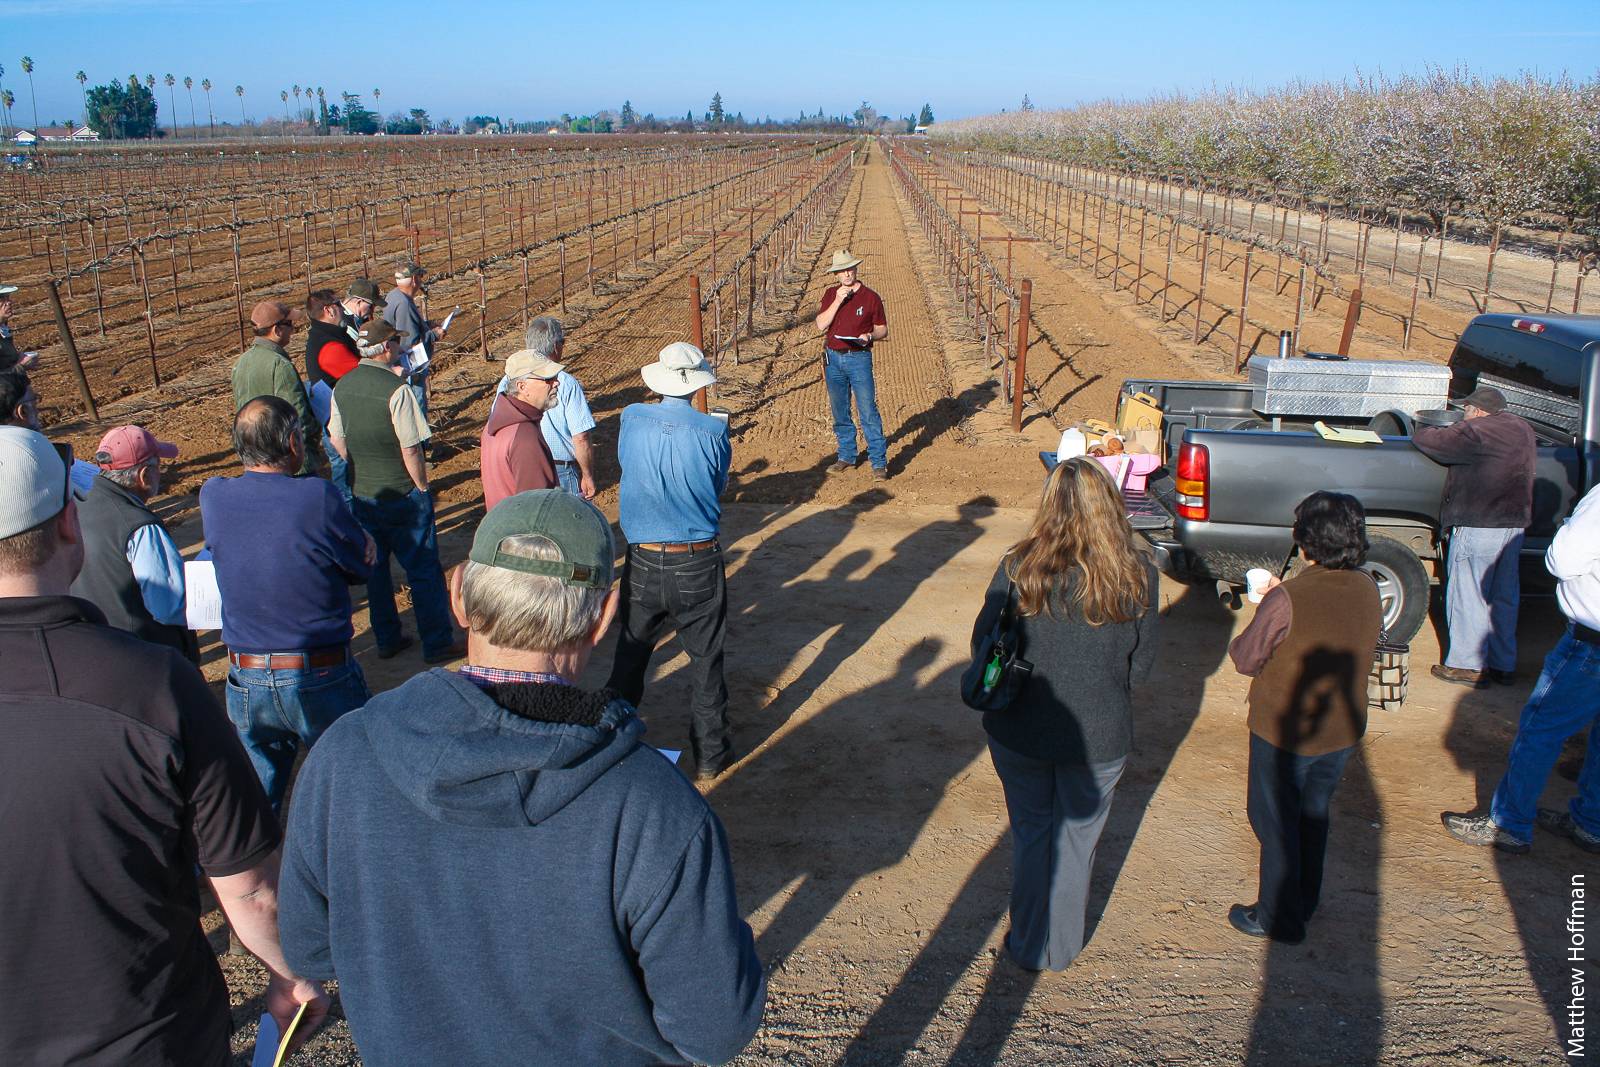
Lodi wine grape growers gather to learn about mechanical pruning equipment and trellising systems from UCCE San Joaquin County farm advisor Paul Verdegaal and fellow growers with experience on the topic. Field meetings cultivate social learning passively. Network-smart extension would integrate facilitation techniques to actively engage growers in knowledge-sharing activities with their peers.
Central Coast was the only region where growers’ number of generations in agriculture was a significant predictor of centrality. This result is in line with the history of the region. Viticulture at the scale that exists today is relatively new to the Central Coast and the expanding industry has likely attracted many new growers to the region. It is logical that Central Coast growers who are multigen-erational are more connected since their families have had more time to establish relationships. Lodi and the Napa Valley have longer histories as established winegrowing regions.
Our results suggest that growers’ participation in outreach events may play a role in helping them strengthen their position in the knowledge network. Extensionists frequently acknowledge that the informal discussion among growers before and after outreach meetings is as important as the content delivered during the events. However, we must be cautious about the direction of causality between these two variables because they are likely to have a reciprocal relationship. Growers may attend outreach meetings as a result of learning about them from social connections. Even if all growers are aware of outreach events through official announcements like print mailings or emails, those growers whose peers plan to attend may be more likely to attend themselves. The positive association between network centrality and participation in outreach events is probably synergistic, where both variables catalyze each other. Network-smart extension strategies can be designed to capitalize on those mutually reinforcing processes.
Network-smart extension strategies
Cooperative Extension and the many others working in an extension capacity have for a long time understood, albeit an-ecdotally, that social learning is an important pathway for extending agricultural knowledge. Our results provide scientific verification for that common knowledge. The results also inspire confidence in the networked, partnership model of agricultural extension, and its emphasis on experiential and social learning. The question for extension is how to capitalize on the natural process of social learning and develop network-smart extension strategies.
Network-smart extension means taking advantage of existing network structure or restructuring the network by adding nodes and links, or rewriting existing links, with the goal of more efficiently connecting those with solutions to those with questions (Valente 2012). The goals of network-smart extension are to (1) increase grower awareness of what others know, (2) encourage growers to value what others know, (3) increase access to what others know and (4) decrease costs associated with accessing what others know (Cross and Borgatti 2003). These goals can be achieved through any number of creative extension strategies. Here, we propose four that have relevance to Cooperative Extension and other agricultural support organizations.
Institutionalize knowledge brokerage.
In network science, brokerage refers to an individual's ability to bridge disconnected groups within the network. Those who span group boundaries have access to a diversity of knowledge, which is critical for problem solving and innovation (Burt 2004; McPherson et al. 2001). Outreach professionals traditionally work as advisors within a specific domain. The knowledge network may function more effectively if outreach professionals, especially farm advisors and others working for organizations with no profit motive, focus on knowledge brokerage in addition to advising.
Brokers are skilled at playing the role of matchmaker between those with questions and those with solutions (Velasquez et al. 2006). Brokerage requires awareness of others’ knowledge deficits and knowledge assets. There is of course overlap between advising and brokerage, but the difference has significant implications for how outreach professionals approach their work and the methods they use to meet growers’ needs. Institutionalizing knowledge brokerage has the potential to alleviate the UCCE bottleneck.
Form alliances with knowledge agents.
While direct engagement with growers is an essential part of any agricultural extension program, extension goals may be achieved more effectively by allying with outreach professionals such as for-hire vineyard managers, PCAs and consultants, who are optimally positioned in the network to access and spread knowledge throughout the network. Those outreach professionals are highly accessible to growers and are positioned to rapidly respond to grower inquiries. A starting point for developing new strategies with these allies might be train-the-trainer education, which has been implemented with success in various agriculture contexts (Fliert et al. 1995; Moore et al. 2007).
Help build relationships.
Agricultural outreach commonly consists of lecture-style meetings, where scientists or outreach professionals communicate knowledge to growers through presentations or demonstrations. This style of outreach misses out on the opportunity to cultivate interpersonal relationships and build reciprocal trust and respect. Drawing on pedagogies that encourage growers to engage with others and share their experiences may help others to value what they know.
Icebreakers, for example, help build such relationships (Prezioso 1989). They are “tools that enable the group leader to foster interaction, stimulate creative thinking, challenge basic assumptions, illustrate new concepts, and introduce specific materials” (Prezioso 1989). Approaches that foster engagement cultivate a culture where individuals take responsibility for and are involved in strengthening their own knowledge network.
Experiment with innovative models.
The Community of Practice (CoP) model might be useful for building social learning into agricultural extension. CoPs are formalized groups of practitioners who share a common practice, are confronted with similar challenges and have similar goals, and who strengthen their practical knowledge through continuous knowledge sharing with others in their community (Wenger 1998). In contrast to conventional agricultural extension strategies, which focus on the ultimate outcome of practice adoption, CoPs focus on building knowledge-sharing relationships, learning and innovation. CoPs might be hosted by agricultural support organizations like commissions or voluntary member associations, which would facilitate the process of growers accessing what others know.
CoPs have been used in corporations to increase employee creativity and innovation (Brown and Duguid 2002), and the model served as the framework for UCCE's eExtension program (eXtension 2013) and for the Leopold Center for Sustainable Agriculture's practitioner working groups (Leopold Center 2013). CoPs have been shown to improve networks by establishing new knowledge-sharing relationships and connecting practitioners with others outside of their normal network (Cross et al. 2002; Velasquez et al. 2006). However, there are no studies that have used social network analysis to evaluate the CoP model (Borgatti and Foster 2003). CoP pilot programs, particularly those evaluated using social network analysis, may help assess the model's potential application in California agriculture.
Cooperative Extension's role
Cooperative Extension and other agricultural support organizations play an important role in shaping the structure, and therefore function, of knowledge networks. There may be no single or best way to accelerate the natural process of social learning, but extension programs must be adaptive, creative, experimental and flexible in design and execution. Extensionists should be willing to step outside of conventional thinking about how programs can be designed. One challenge of the social learning approach is ensuring that the information being spread through networks is scientifically valid and accurate. Further research is necessary to understand if and how the scientific fidelity of information changes as it spreads through a knowledge network. The results presented in this paper serve as an empirical basis for developing a new generation of extension strategies designed to leverage the knowledge network and accelerate the process of social learning.
Citations
Network-smart extension could catalyze social learning

