


All Issues
Fine-tuning fertilizer applications in organic cool-season leafy green crops can increase soil quality and yields
Publication Information
California Agriculture 76(2):77-84. https://doi.org/10.3733/ca.2022a0010
Published online October 01, 2022
PDF | Citation | Permissions
NALT Keywords
Abstract
Organic cool-season vegetable growers on the Central Coast face challenges in applying nitrogen (N) to balance yields with new environmental regulations. It is hard to time fertilizer applications while calculating N mineralization of soil organic matter and organic fertilizers to plant-available N. Organic fertilizers with high phosphorus (P) to N ratios may elevate P levels and harm surface water quality. In this study, we evaluated (1) mineralization of soil organic matter and fertilizers, (2) effectiveness of residual soil nitrate-N tests and (3) long-term impacts of organic fertilizers on P levels and soil microbial activity. We found that mineralization of N from soil organic matter provided limited N to leafy green vegetables. Soil tests were more reliable in heavier than sandier soils. Application rates of 4-4-2 were calculated to meet N demands, resulting in an oversupply of P. However, only 9% to 17% of fertilizer P solubilized without elevating available soil P levels. While it's difficult for organic vegetable growers to use cover crops, organic fertilizers increased carbon levels, resulting in higher levels of soil microbial activity.
Full text
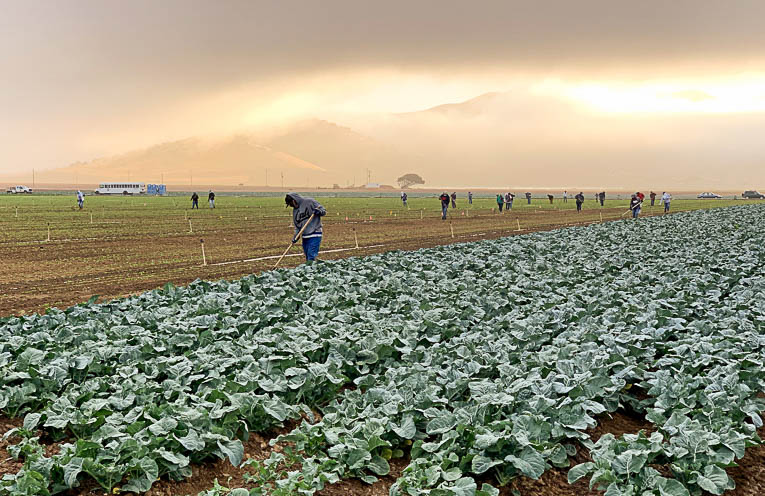
Central Coast California growers produced $766 million of cool-season organic produce in 2019. These crops included lettuces, cole crops, spinach, strawberries and spring mixes (baby lettuces and kale, mizuna and arugula). Large-scale organic vegetable production on the Central Coast has been steadily increasing over the past 20 years due to rising consumer demand and optimal growing conditions. While there is basic information on organic soil fertility for vegetables (Gaskell et al. 2000; Gaskell and Smith 2007), specific soil fertility information for cool season vegetables is scarce. Organic growers have the added challenge of complying with recent nitrogen (N) use limits put out by the Central Coast Regional Quality Control Board.
Results from a UC Cooperative Extension study suggest that large-scale organic vegetable operations on the Central Coast that seldom use cover crops or compost can benefit from the extensive use of organic fertilizers to stimulate soil microbial activity.
A key practice used by conventional growers to improve the uptake efficiency of applied N fertilizer is measuring levels of residual soil nitrate-N and adjusting fertilizer application rates accordingly (Hartz et al. 2000). In organic vegetable production, however, soil nitrate tests are rarely used to guide fertilizer applications due to the uncertainty of how much (and when) N is mineralized from soil organic matter and organic fertilizers. Soil tests for residual soil nitrate-N are most accurate when done immediately prior to a fertilizer application. However, the time lag in the release of nitrate-N from organic fertilizer adds a level of uncertainty to the use of nitrate-N tests, especially if residual soil N is lost to leaching before the crop can utilize it. It is critical to understand the release characteristics of organic fertilizers to determine how organic N fertilizer applications can be adjusted and made more efficient. It is also important to understand background levels of mineralization of N from soil organic matter, as well as the quantity of nitrate-N that is supplied by irrigation water, both of which can provide significant amounts of N for crop growth.
This project was conducted over 4 years with large-scale organic cool-season vegetable operations in Monterey County, which typically farm 300 to 1,000 acres and supply nationwide markets. Nitrogen mineralization from soil organic matter and organic N fertilizers were measured, and the utility of nitrate-N testing for residual soil N to adjust fertilizer applications was evaluated. The role of organic phosphorus (P) fertilizers in elevating soil P levels was examined and compared with neighboring conventional vegetable fields. In addition, the impact of the long-term use of organic fertilizers on soil microbial activity and organic matter was evaluated.
Conventional and organic fields
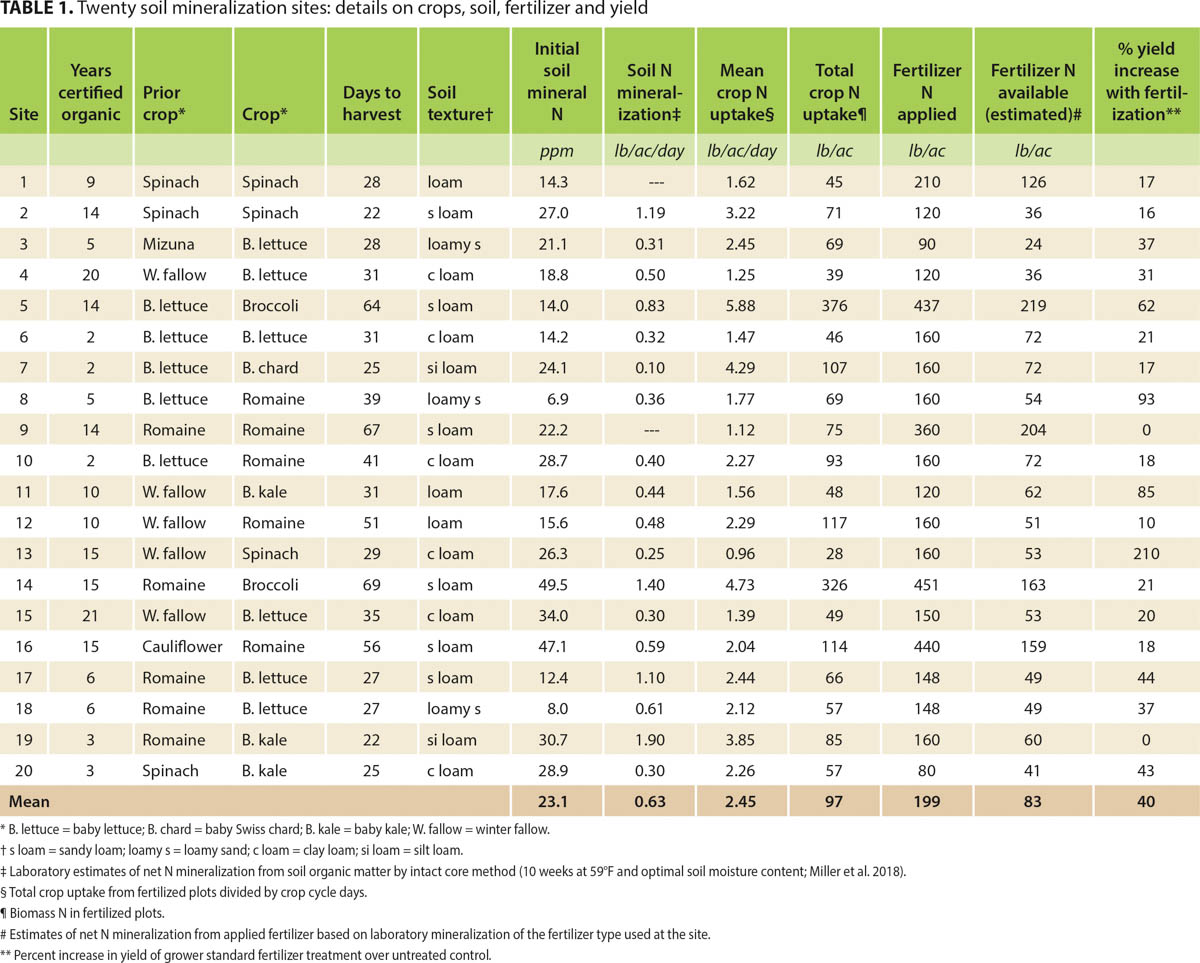
Trials were conducted with cooperating growers in conventional and organic romaine lettuce, spinach, spring mix and broccoli fields. Twenty experiments were conducted in 2016 and 2017 in Monterey County with the goal of evaluating N mineralization from soil organic matter in laboratory and in-field evaluations (table 1). Four composite preplant soil samples up to 12 inches deep were collected at each organic site and at a neighboring conventional farm with the same soil type and similar crop mix. The soils were analyzed for organic matter (loss on ignition), total N and C (combustion), bicarbonate extractable P (Olsen P), total P (acid digestion and ICP-AES analysis), permanganate extractable carbon (POXC) (Culman et al. 2012), water extractable N (WEON) and C (WEOC) (Haney et al. 2012), and fluorescein diacetate (FDA) hydrolysis (Green et al. 2006).
In each field, three replicates of unfertilized plots versus plots fertilized with the grower standard N application were established to measure the level of response to N fertilization. Plots were 6.7 feet wide by 10 feet long. In sprinkler-irrigated fields, three 1-liter water containers with 7-inch diameter funnels were installed; in drip-irrigated fields, in-line flow meters were installed in each plot to measure total applied water. Nitrate-N content of the water was measured, and total N applied in the irrigation water was calculated. Soil samples to 12 inches deep were collected weekly from each plot and were extracted with 2N KCl, to measure mineral N. Crop biomass and biomass N were measured at crop maturity.
In-field mineralization measurements were made on the unfertilized plots. Crop plants were removed, and the soil was covered with plastic mulch, in order to measure N mineralization from soil organic matter without the confounding factors of crop N removal and nitrate-N leaching by irrigation water. The plastic mulch was applied after the germination water wetted the soil. The soil remained at or near field capacity over the crop cycle — in other words, in a moist (but not saturated) condition, able to mineralize nitrogen with no leaching. White on black plastic mulch was used, with the white side facing up to reflect light and minimize soil heating, and the black side facing down to inhibit weed growth. Soil nitrate-N was measured each week during the cropping cycle by collecting six soil cores, 12 inches deep from each plot. Soil temperatures were measured using soil moisture and temperature probes (Decagon 5TM) and a recorder (Decagon Em50). Infield estimates of soil mineralization were made from the mulched plots by subtracting nitrate-N levels at the beginning of the crop cycle from nitrate-N at the end.
Nitrogen mineralization in soil from each site was also determined in laboratory assays by incubating undisturbed soil cores collected at the beginning of the crop cycle (Miller et al. 2018). A 6-inch-long by 2-inch-diameter undisturbed core was taken in a plastic sleeve from each replicated plot. At the same time, several samples were taken with a soil probe to the same depth from the area surrounding the core sampling location. These samples were then homogenized and stored in a cooler on ice with the undisturbed cores until returned to the laboratory. The cores were incubated at 59°F for 10 weeks. During the incubation, the soil moisture content was maintained at 60% water holding capacity. Net N mineralization was calculated as the difference between the initial mineral N measured in the samples from the surrounding soil and the final mineral N in the cores.
Each of the 20 organic field sites was paired with a neighboring conventional field of the same soil type and growing a similar mix of crops. Composite soil samples were collected from four locations in each field, and each replicate was analyzed for factors shown in table 2. The mean values for each soil parameter in the organic and conventional fields were statistically compared using a pairwise Student's t-test.
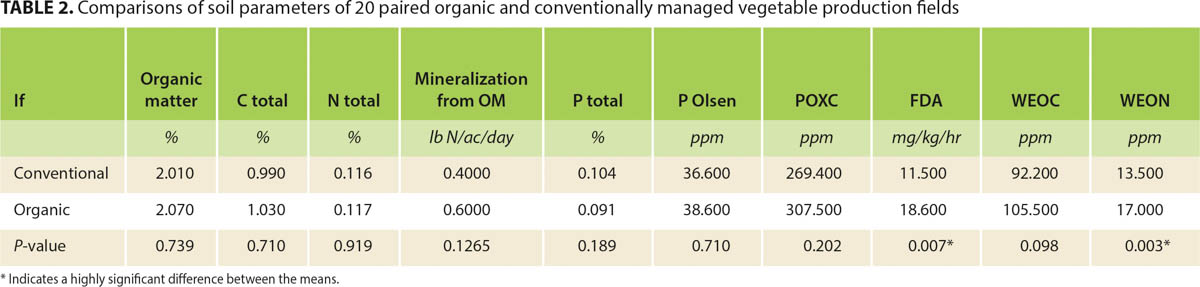
TABLE 2. Comparisons of soil parameters of 20 paired organic and conventionally managed vegetable production fields
Evaluation of N and P release
Replicated in-field evaluations of N and P release from organic dry fertilizers were conducted in romaine lettuce fields in 2016 and 2017. Two commonly used organic fertilizers were evaluated: 4-4-2 (a mixture of poultry manure and feather meal) and 12-0-0 (feather meal). Twenty grams of oven-dried organic fertilizer, in a 0.5-inch-thick layer, were placed in 4-inch-by-5-inch polypropylene mesh bags, which were placed on the soil surface (to simulate a topdressed application) or buried three inches deep (to simulate a soil-incorporated application). The bags were subject to wetting and drying cycles from the sprinkler irrigation used in the field. To determine N and P release from the fertilizer, four bags were removed each week, and their contents were oven-dried, weighed and analyzed for total N and P. The quantity of N and P released from the fertilizer was calculated by the difference in the weight loss during the field incubation.
Aerobic laboratory incubations of organic fertilizers commonly used by organic growers were conducted at UC Davis. The incubations simulated soil incorporation of the fertilizers. The soil was collected from two organically managed fields and was air-dried and thoroughly mixed. Organic fertilizers were blended with these soils at approximately 100 mg N kg–1 soil, brought to field capacity water content, and incubated at 68°F. At 2, 4 and 8 weeks of incubation, subsamples were extracted with 2N KCl, and mineral N was determined. The rate of net N mineralization from the organic fertilizers was determined as the increase in mineral N over time minus that measured in the control (unfertilized) soil.
To evaluate the use of soil nitrate tests in guiding fertilizer N applications, four replicated on-farm fertilizer trials were conducted in 2018 and 2019 in conventional and organic spinach fields. Soil textures at the sites were clay loams, silt loams and loamy sands (table 3). Soil organic matter ranged from 1.18% to 3.47%. Each plot was one 80-inch bed wide by 30 feet long and was replicated four times in a randomized complete block design. The following treatments were included in each trial: untreated control, 50% of grower standard, and grower standard fertilizer application. At each site, fertilizer either was applied at listing or top-dressed at planting. Soil samples were collected from the top 12 inches of soil at planting and each week until harvest, and were analyzed for mineral N. Yield and crop N uptake were measured at crop maturity.

N available for crop growth
During the crop cycle, a portion of the N in soil organic matter mineralizes to plant-available forms. This study measured mineralization of nitrate-N from the soils at the 20 study sites. Laboratory incubations averaged 0.6 pounds (lb) N/acre (ac)/day (range 0.3 to 1.9), and in-field evaluations averaged 1.6 lb N/ac/day (range 0.3 to 3.3). In spite of efforts to prevent soil heating under the plastic mulch, soil temperatures were higher in the mulched plots (data not shown), which may have given higher estimates of mineralization than have been reported in the literature for similar soil types (Miller et al. 2018). The correlation between the in-field and laboratory incubations was low (R2 = 0.08). As a result, we had greater confidence in the laboratory estimates of N mineralization (table 1) and used that data to estimate N mineralization in this study. Fast-growing leafy vegetables such as lettuce and spinach take up 3 to 4 and 5 to 6 lb N/ac/day, respectively, during the last half of the growth cycle (Bottoms et al. 2012; Heinrich et al. 2013). Average daily soil mineralization over all sites was 0.6 lb N/ac/day and average crop uptake was 2.5 lb N/ac/day (table 1), indicating that daily crop N demand was higher for these crops than the amount mineralized from soil organic matter.
Nitrate-N in irrigation water can be an important source of N for crop growth (Cahn et al. 2017). However, the average levels of nitrate-N in the irrigation water at these study sites was 11.1 parts per million (ppm), with only two sites > 48.0 ppm and the rest below 16.0 ppm. On average, the irrigation water supplied 15.6 lb N/ac over the crop cycle (data not shown), an important but small portion of the N needs of the crops in this study.
Residual soil nitrate-N left over from prior rotations also can be a significant source of N for crop growth. This is particularly true for the second or third crop of the season, where significant mineral N remains from prior crop residues and unused fertilizer N. A soil nitrate-N concentration of 20 ppm in the top foot of soil is equivalent to 70 to 75 lb of N/ac (at soil bulk densities of 1.3 to 1.4 grams/cm3) and provides sufficient N to supply crop needs for 1 to 2 weeks (Breschini and Hartz 2002). The mean concentration of residual soil nitrate-N at all sites at the beginning of the crop cycle was 23.1 ppm (83 lb N/ac, table 1). However, nitrate-N is susceptible to losses due to excess irrigation, particularly during crop stand establishment. An average of 3.0 inches/ac of water was applied to establish the crops at the study sites, while crop water demand during this time was 1.9 inches/ac (based on estimates of evapotranspiration in Johnson et al. 2016). As a result, an average of 1.1 inches of water leached (ranged from 0.1 to 2.9 inches) during the first 7 to 10 days of the crop cycle. This leaching loss may explain why residual soil nitrate at the beginning of the crop cycle did not play a bigger role in providing crop N needs (fig. 1).
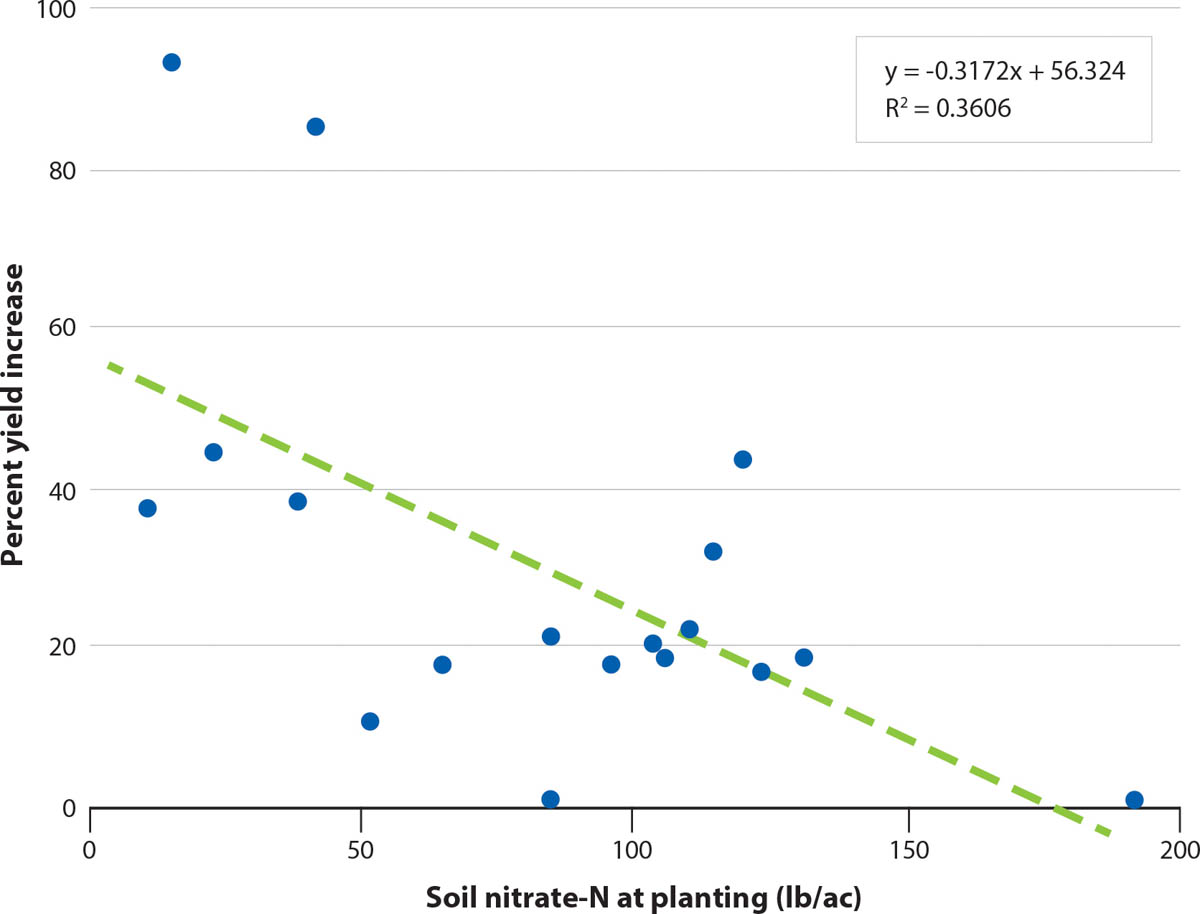
FIG. 1. Correlation (or relationship) between increase in crop yield and residual soil nitrate-N at planting. Increase in the yield of vegetables with fertilization in comparison to residual soil nitrate-N in the soil at the beginning of the crop cycle.
Nitrogen uptake by the crop at harvest ranges from 120 to 160 lb/ac for lettuce, 90 to 130 lb/ac for spinach, 60 to 70 lb/ac for baby lettuce, and 250 to 350 lb/ac for broccoli (Hartz 2020). Fertilizer N application rates are often at or above these N uptake values. However, as will be discussed below, the net amount of N released from organic fertilizers during the crop cycle is less than the total N content of the crop. Over all sites, the amount of N released from applied fertilizer was less than crop uptake: average crop uptake was 97 lb N/ac and the average net release of N from applied fertilizer was 83 lb N/ac (table 1). It appears that the other sources of N, such as residual mineral N, mineralization of N from soil organic matter, and nitrate-N in irrigation water, while modest, were sufficient to supplement fertilizer N to achieve economically viable yields.
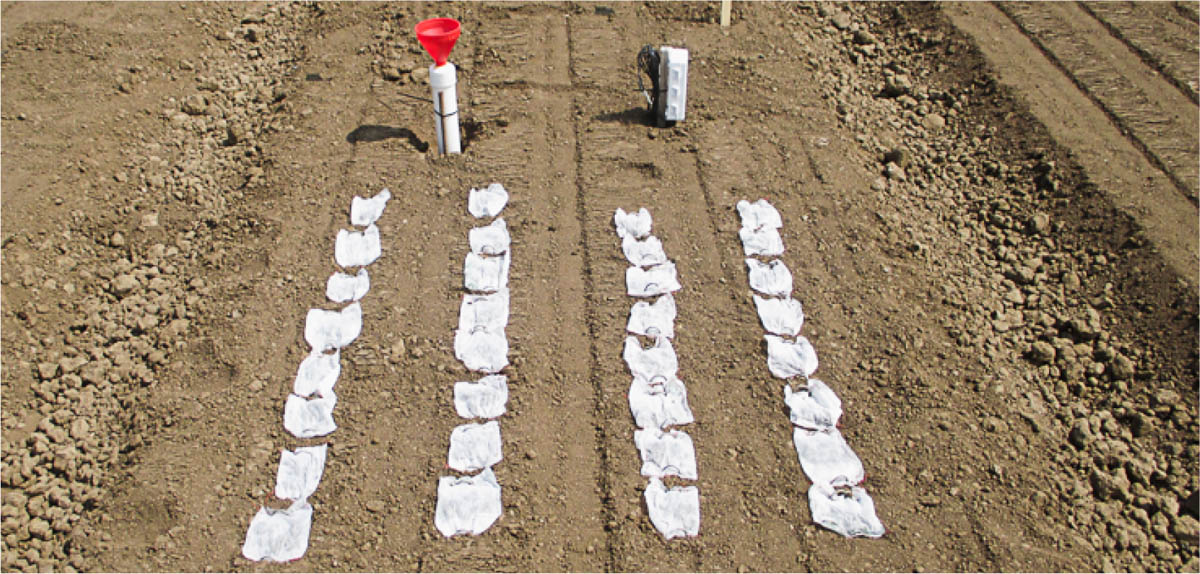
Polypropylene mesh bags containing organic fertilizer were placed on the soil surface to simulate a topdressed application. Photo: Richard Smith.

Bulk delivery of organic fertilizers. Photo: Richard Smith.
A guide to fertilization
In conventional production systems, supplemental fertilizer applications can be made more precise by measuring residual soil nitrate-N levels immediately before fertilization and reducing fertilizer applications if there is adequate residual nitrate-N. If levels are ≥ 20 ppm nitrate-N, the need for fertilizer N can be reduced or eliminated (Breschini and Hartz 2002). Nitrogen in conventional fertilizers is soluble and immediately available to the crop. However, due to the time lag in the release of mineral N from organic fertilizers, soil nitrate-N tests in organic production cannot effectively be made immediately prior to fertilization. Rather, they need to be conducted early in the production cycle to make sure that the release of the mineral N from the fertilizer effectively meshes with crop N demand.
To better understand the utility of measuring soil nitrate-N to guide fertilizer applications in organic vegetable production, four fertilizer trials were conducted on spinach, a fast-growing and shallow-rooted crop. Given the short life cycle of the crop and the lag time in the release of mineral N from organic fertilizers, the only opportunity to test residual nitrate-N is at or before planting. All trial sites were the second or third crops of the season and had levels at or above 20 ppm nitrate-N at the beginning of the crop cycle (table 3). Treatments included 0%, 50% and 100% of the grower standard N application rate. There was no yield response to applied fertilizer on sites with heavy soils (sites 1, 3 and 4). Yields equivalent to the 100% grower standard were obtained with 0% or 50% of the standard fertilizer application rate. These results indicate that the quantity of residual N was adequate to supply crop needs. Site 2 had a loamy sand soil; even though residual soil nitrate-N levels were 28.1 ppm, fertilizer application rates of less than 100% of the grower standard resulted in lower yields. Leaching of the residual nitrate-N during the application of germination water was probably responsible for the lower yield in the reduced fertilizer plots at this site. The active roots of spinach are in the top 4 to 12 inches of soil (Heinrich et al. 2013), and maintaining nitrate in this narrow band of soil with sprinkler irrigation is challenging, especially on light soils. The results from these trials suggest that testing soil for residual soil nitrate-N can be useful in organic vegetable production. However, to estimate future availability of residual soil nitrate-N in soil, nitrate tests appear to be most useful for heavier soils. The tests are less useful for lighter soils, where nitrate-N can be leached by irrigation water before it is utilized by the crop. More studies are needed to better understand how to use nitrate tests to fine-tune fertilizer N applications in cool-season vegetables in organic systems.
Dry and liquid fertilizers
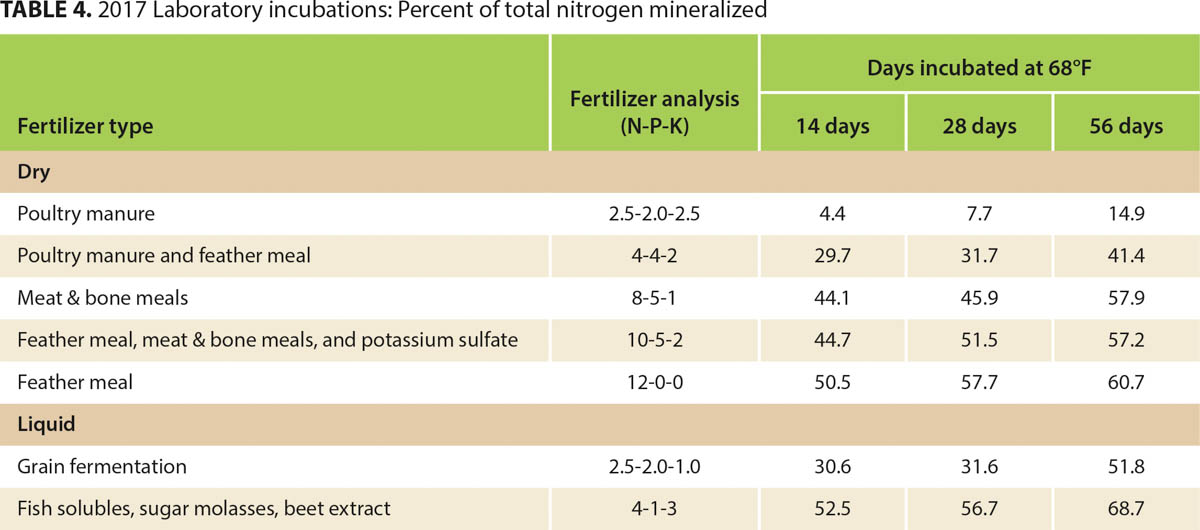
Laboratory incubations were conducted with a variety of dry and liquid organic fertilizers to understand how much and when N is mineralized. The fertilizers were mixed with moist soil and incubated at 68°F for 56 days. This technique simulates mineralization of N from fertilizer that is incorporated into moist soil. The quantity of N that mineralized from dry fertilizers ranged from 14.9% to 60.7%, and liquid fertilizers ranged from 51.8% to 68.7% of the initial N content of the fertilizer (table 4). Fertilizers with greater N concentrations released a greater proportion of N than fertilizers with lower N concentration. For example, 4-4-2 and 12-0-0 mineralized 41.4% and 60.7%, respectively, of their initial total N content over the 8-week incubation. Liquid fertilizers with N concentration equivalent to dry materials mineralized a greater proportion of their N and did so more quickly. Liquid fertilizers are typically made from high-N-content material, which is diluted with water during application.
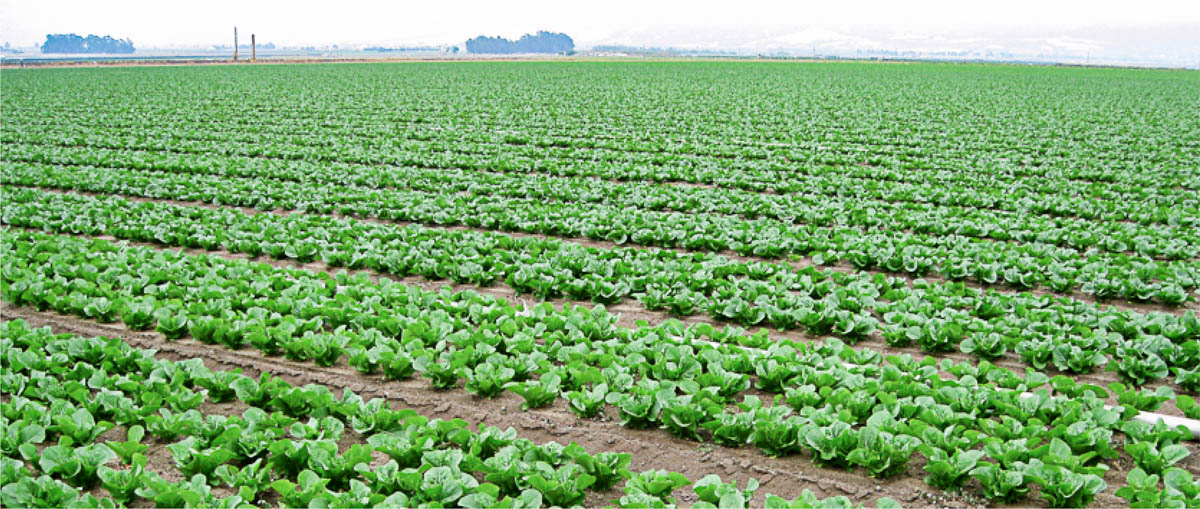
Lettuce mid growth cycle. Photo: Richard Smith.
In-field N release studies of dry organic fertilizers compared surface-applied and soil-incorporated applications of 4-4-2 and 12-0-0 over 55 days in a sprinker-irrigated lettuce field. Both fertilizers released a high proportion of their mineral N during the first 2 to 3 weeks. Over 55 days, soil-incorporated applications of 12-0-0 released more N than 4-4-2, 86.0% versus 54.0% (fig. 2). Less N was released from surface applications of both materials than from soil-incorporated applications. This may be due to drying cycles between rounds of irrigation, which slow the mineralization process and reduce N release. Soil-incorporated fertilizer stays more consistently wet, allowing mineralization to continue uninterrupted.
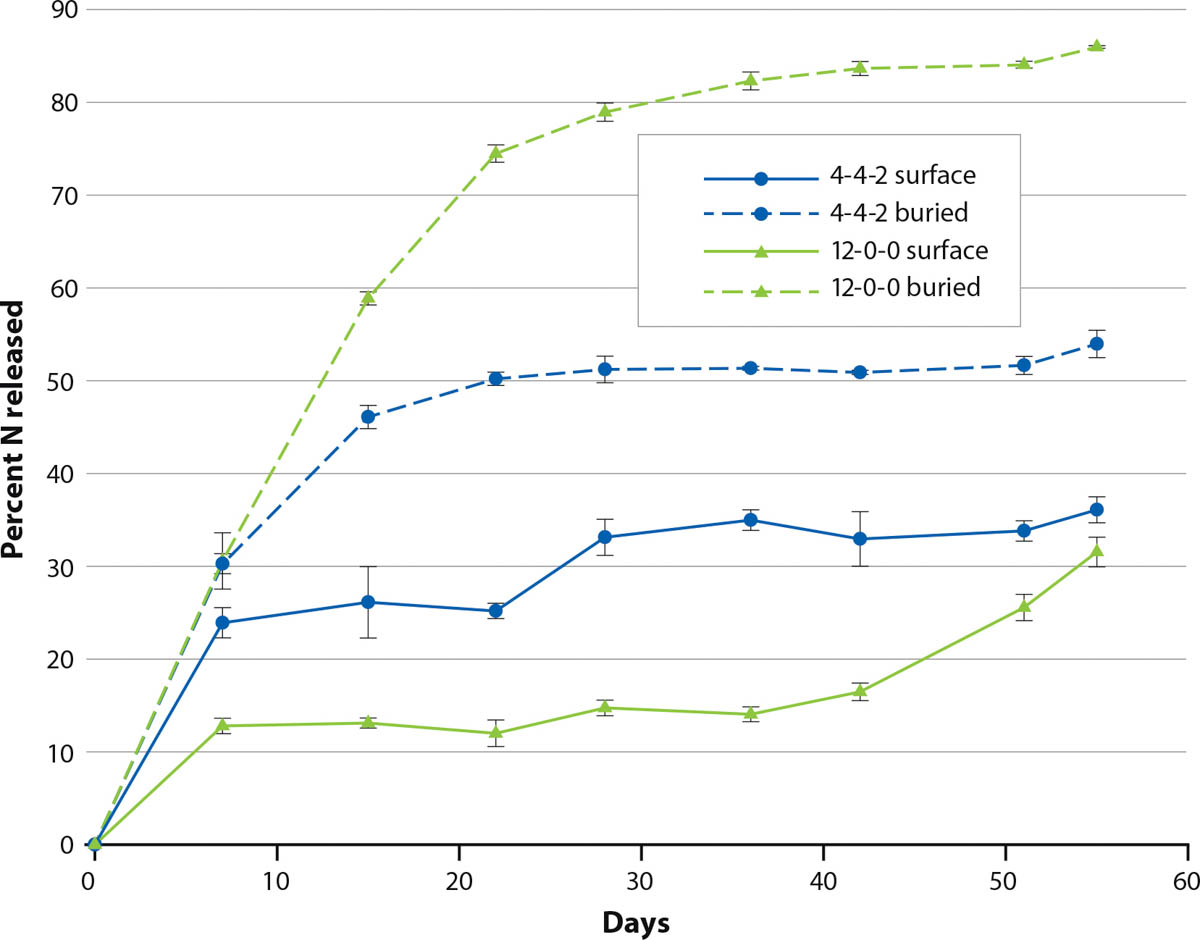
FIG. 2. Nitrogen released from pouches with 4-4-2 and 12-0-0 placed on the soil surface and buried three inches deep. Bars are standard error of the mean.
Organic fertilizers have two distinct phases of release of mineral N: an initial rapid phase that occurs in the first 2 to 4 weeks after wetting of the material, during which time the labile forms of N mineralize, and a prolonged phase in which the recalcitrant components in the fertilizer slowly mineralize (Hartz and Johnstone 2006). In these trials, organic fertilizers did not mineralize all of the N that they contained. The unmineralized portion of organic fertilizers is recalcitrant and becomes part of the soil organic N pool, which slowly becomes available over subsequent years. As a result, the leaching potential of recalcitrant N in organic fertilizer is low. Ag Order 4.0, developed by the Central Coast Regional Water Quality Control Board, uses the quantity of applied N (“A” value) and the quantity of N removed by the crop (“R” value) as the basis for N fertilizer use regulations. The results from this study and Lazicki et al. (2020) underscore the need to consider mineralized net N rather than the total amount applied from organic fertilizers when calculating the “A” value for organic fertilizer.
Organic fertilizers release P
The risk of elevating P levels is a common concern in organic agriculture due to the use of P-rich composts and fertilizers (Maltais-Landry et al. 2016). Excess soil P can be transported in runoff from storms or irrigation to surface waters and can cause water quality impairment by eutrophication. The high P:N ratio of organic fertilizers such as 4-4-2 result in high application rates of P, because the material is applied at rates that satisfy the N needs of the crop, but are excessive for the crop's P needs.
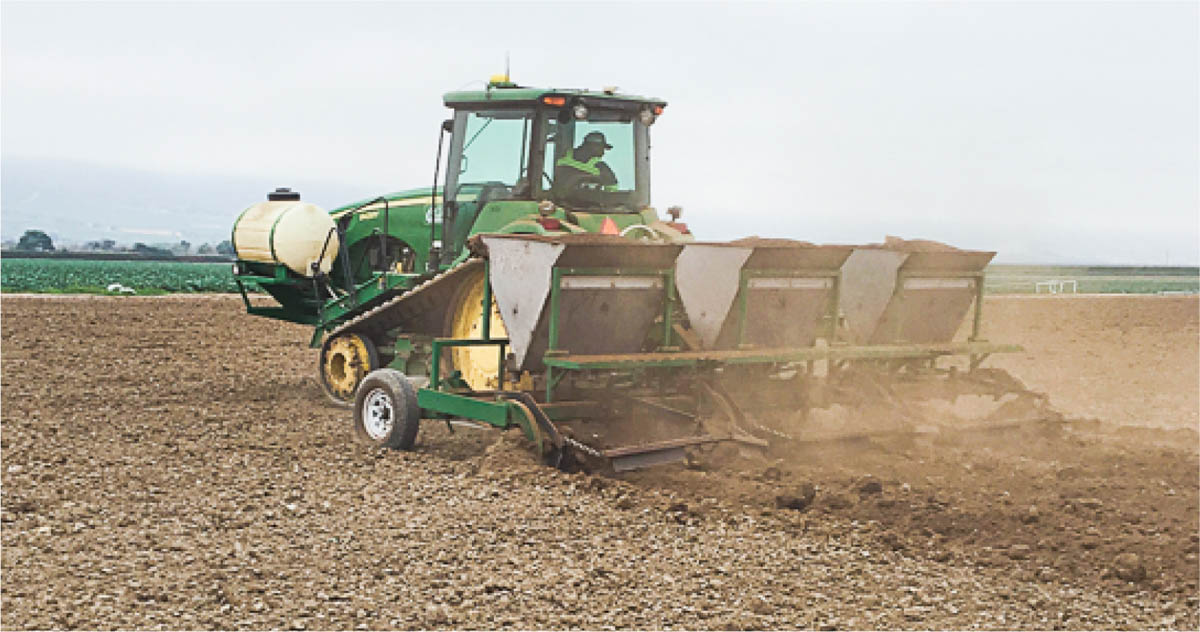
Tractor applying fertilizer. Photo: Richard Smith.
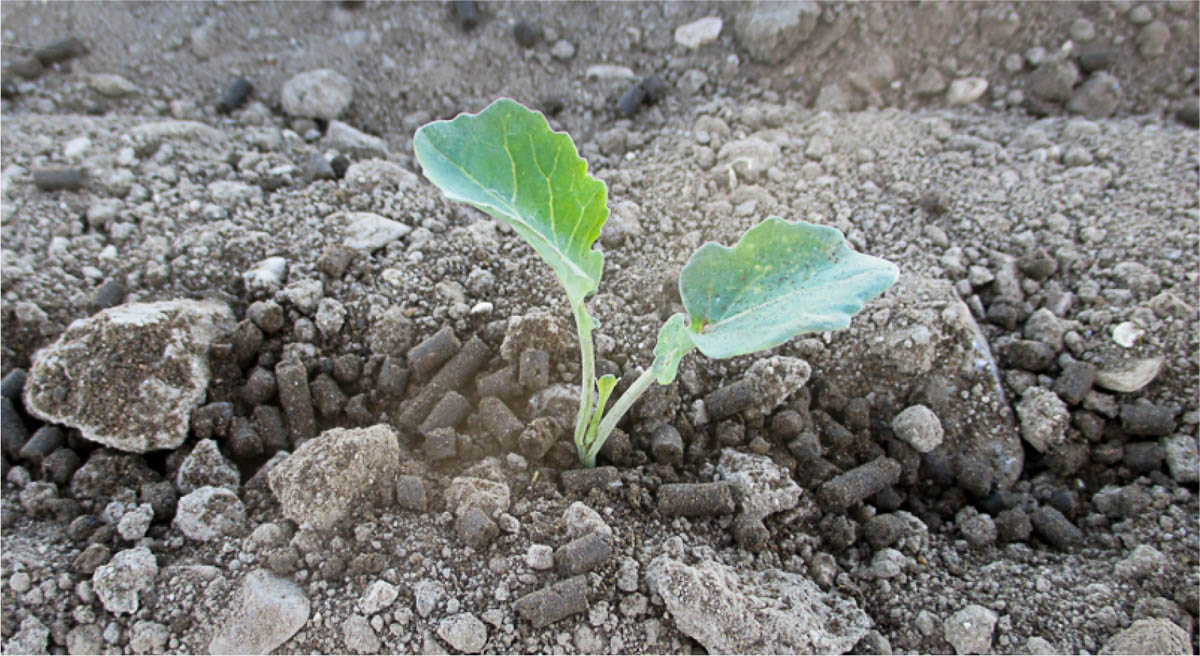
Pelleted organic fertilizer in a broccoli field. Photo: Richard Smith.
This study provided preliminary evaluations of the impact of the use of 4-4-2 on P buildup in Salinas Valley soils. A material like 4-4-2 applies N and elemental P in a ratio of 2.3:1. This ratio, when applied at rates to supply the N needs of spinach, provides over three times more P than is taken up by the crop. This relationship indicates that continued use of 4-4-2 could result in a buildup of P in the soil. However, our measurements showed that only 9% to 17% of the P content of 4-4-2 was released during the crop cycle. Whether the fertilizer was placed on the surface or buried in the soil did not affect this rate of release. It is not entirely clear why the release of soluble P from this material was low, but the two factors that may affect P release are the characteristics of the manure (Leytem and Mikkelsen 2005) and soil lime content (Hartz 2020).
Stimulating microbial activity
Organic vegetable growers on the Central Coast face the same production pressures as conventional growers: high land rents, scheduling pressures and food safety concerns. These issues create barriers to using cover crops and compost, which generally were not used in the organic farms we evaluated. The biggest difference in the amount of carbon (C) added to the soil in organic versus conventional operations was the use of dry organic fertilizers. Materials like 4-4-2 and 12-0-0 contain 28% and 46% C, respectively. Additionally, 9,000 lb of 4-4-2 per year for three vegetable crops adds 2,520 lb/ac of C. For comparison, the 7,000 lb of above-ground dry matter from a cover crop contains 3,080 lb of C (Brennan and Smith 2017). Yearly applications of substantial amounts of 4-4-2 and other organic fertilizers provide significant inputs of C to the soil. We expected to observe greater levels of organic matter and total C in the organic farms than in the paired conventional farms. There was a great deal of variability in the levels of soil organic matter and total soil C in the two systems, and no statistical difference between them was detected (table 2). However, organic fields had significantly higher levels of WEON and FDA hydrolysis (P < 0.05) than did neighboring conventional fields. Higher levels of FDA hydrolysis in the organic systems indicates higher soil microbial activity (Green et al. 2006). These data indicate that large-scale organic vegetable operations that seldom use cover crops or compost can benefit from the extensive use of organic fertilizers to stimulate soil microbial activity.
In the 20 fields we evaluated, we observed that the net amount of N supplied by organic fertilizers applied to cool-season vegetables was generally less than crop uptake. This was because organic fertilizers release only a portion of the N they contain during the crop cycle. It is likely that the modest amounts of residual soil N and N in irrigation water made up the difference necessary for acceptable yields. We found that the time lag in release of N from these fertilizers and nitrate leaching on sandy soils adds uncertainty to making decisions for fast-maturing crops like spinach. We also found that the use of high P:N fertilizer, such as 4-4-2, did not significantly build up bicarbonate extractable P levels in Salinas Valley soils. Moving forward, testing for residual soil nitrate can help guide growers in their organic fertilizer decisions, especially for heavier soils.
Fine-tuning fertilizer applications in organic cool-season leafy green crops can increase soil quality and yields

