


All Issues
Healthy Schools Act spurs integrated pest management in California public schools
Publication Information
California Agriculture 59(4):235-241. https://doi.org/10.3733/ca.v059n04p235
Published October 01, 2005
PDF | Citation | Permissions
Abstract
The Healthy Schools Act of 2000 established right-to-know procedures for pesticide use in California public schools, and mandated using least-toxic pest management methods as state policy. In a survey conducted 2 years after the law's passage, school districts that had integrated pest management (IPM) programs generally used more ecologically sound pest management tactics than districts that did not, and most of those said that IPM had improved their pest management effectiveness. The Healthy Schools Act requires that schools post warning signs, keep pest management records, provide notifications to parents and staff, and maintain a list of parents desiring further notifications. A majority of California's school districts have implemented at least three of these four requirements, with about half reporting full compliance.
Full text
Before 2001, the kinds and amounts of pesticides used in public schools were mysteries to many Californians. For some parents, these mysteries were worrisome.
California lawmakers aimed to address these concerns by passing the Healthy Schools Act of 2000 (HSA), which established right-to-know requirements for pesticide use () in public schools and required all school districts to designate an integrated pest management (IPM) coordinator (HSA 2000). The law also directed the California Department of Pesticide Regulation (DPR) to collect certain pesticide-use information from schools, such as the amount of pesticides used in eating areas or in classrooms, and to support schools in their IPM efforts, emphasizing pest prevention instead of more hazardous pesticide spraying.

A California law passed in 2000 requires that public schools inform parents about pesticide use and designate integrated pest management coordinators. Cole McCann-Phillips climbs on a play structure in Berkeley.
To track the progress of Healthy Schools Act implementation, DPR distributed surveys to all California public school districts in 2002. The results presented here reveal patterns of pest management practices used for two of the most common school pests, ants and weeds. The survey also examined the levels of adoption for various IPM-related policies (including those required by the Healthy Schools Act), and compared the practices of districts that have IPM programs with those that do not. (Private schools are not covered by Healthy Schools Act mandates.)
DPR based the 2002 survey on a previous survey distributed in 2001 (DPR 2001). The 2001 survey placed more emphasis on assessing school districts' resource needs; the 2002 survey was intended to profile schools' pest management activities and measure their progress in adoption of IPM. The 2002 survey also began measuring the long-term progress of DPR's School IPM Program, which is charged with organizing IPM trainings, creating an IPM guidebook, developing a Web site ( www.schoolipm.info ), and generally assisting school districts with implementing IPM ( see page 201 ). The 2002 survey consisted of 21 questions; copies were mailed to IPM coordinators at all 988 California public school districts. The response rate was 42% (Geiger and Tootelian 2002).
To better understand the effects of geographic and demographic factors on survey responses, a subset of the survey results was linked to data from the California Department of Education public schools database (CDE 2002). This data was also used to check for systematic demographic and geographic differences between respondents and nonrespondents (nonrespondent error). Sampling error was calculated to be ± 5%, based on the question with the highest standard deviation of responses (question 5: “Which [pest control method] do you use most frequently to manage ants inside school buildings?”).
The Healthy Schools Act requirements
The Healthy Schools Act (HSA 2000) requires that all public school districts must:
-
Provide annual written notification to all school staff, parents and guardians listing all pesticide products (some products are exempt) expected to be applied by district staff or outside contractors in the upcoming year, and the Internet address to DPR's School IPM Program Web site ( www.schoolipm.info ).
-
Provide the opportunity for interested staff and parents to register with the school district if they want to be notified of individual pesticide applications at the school before they occur.
-
Post warning signs at each area of the school where pesticides will be applied, posted 24 hours in advance and until 72 hours after applications.
-
Maintain public records of all pesticide use at the school for 4 years.
-
Designate an IPM coordinator to carry out these requirements.
For more information about these HSA requirements, contact Dave Hawke, California Department of Education, at (916) 322–1459, or dhawke@cde.ca.gov.
The Act requires the California Department of Pesticide Regulation (DPR) to:
-
Prepare a school pesticide-use reporting form to be used by licensed pest-control businesses when they apply any pesticides at a school.
-
Establish and maintain a school Web site to provide specified information to the public on school IPM (see www.schoolipm.info ).
-
Promote and facilitate the voluntary adoption of school IPM programs through specified activities, and assist districts in complying with the law. In addition, the Act requires that:
-
Licensed pest-control businesses must report pesticide applications by school annually to the DPR director.
For information on these requirements, contact Nita Davidson, DPR, at (916) 324–4100 or school-ipm@cdpr.ca.gov.
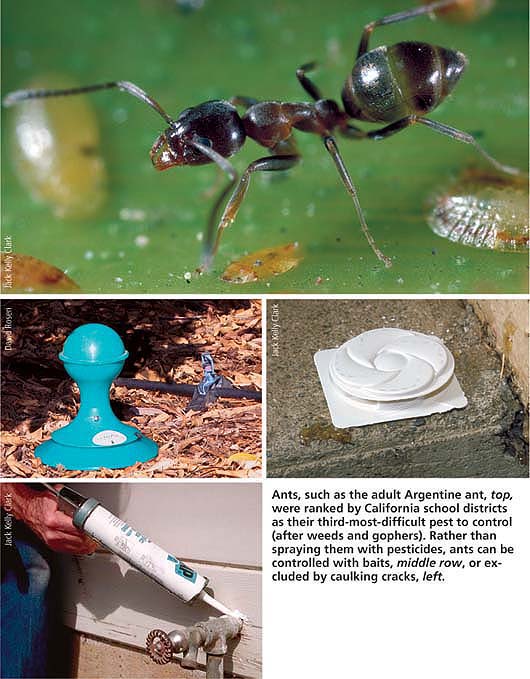
Ants, such as the adult Argentine ant, top, were ranked by California school districts as their third-most difficult pest to control (after weeds and gophers). Rather than spraying them with pesticides, ants can be controlled with baits, middle row, or excluded by caulking cracks, left.
Measuring progress toward IPM
The Healthy Schools Act includes its own IPM definition () and other general definitions of IPM abound (Bajwa and Kogan 1998). However, there is no widely accepted operational definition; that is, a definition specific enough to serve as the basis for measuring IPM adoption. While attempts have been made to set up such standards, their success has been hampered by the diverse nature of pest management systems.
Therefore, we developed our own approach to defining and measuring IPM in schools. After discussions with school personnel and a review of the IPM literature (Benbrook 1996; Huffaker and Messenger 1976; Stern et al. 1959), we categorized four activities as central to a successful school IPM program: (1) monitoring pest populations, (2) emphasizing pest prevention, (3) keeping records and (4) using chemical pesticides only as a last resort. Referring to these categories, DPR staff classified certain pest-management practices as “compatible with” or “contrary to” IPM (). We asked about these practices in the survey and summarized each participant's responses as an IPM index, which was calculated by awarding one point for each compatible practice and subtracting one point for each contrary practice. This index provides a measure of school IPM adoption over time, and also helps to reveal whether self-categorization as an IPM district actually translates into better practices.
To keep the survey as short as possible and maximize response rates, we focused the questions on two representative categories of pests: weeds and ants. We chose weeds and ants because they represent both landscape and structural pest-management issues, and because they were ranked the first and third most serious school pests, respectively, in the 2001 survey (gophers were number two).

Weed management
Managing weeds requires a lot of labor, especially at rural schools with extensive turf and landscape areas. School districts varied widely in their decision-making approaches for weed treatment. Nearly one-third (30%) of school districts reported using the approach that would be preferred in an IPM program, which is treating weeds “when the abundance exceeds a pre-established threshold” (see Geiger and Tootelian [2002] for survey details). About one-fifth (23%) of districts treat “when weeds are first noticed.” The single largest group (35%) reported treating weeds at regular, predetermined intervals. However, this result is difficult to interpret. While regular weeding is part of a sound IPM strategy, calendar-based herbicide spraying generally is not (UC IPM 2001). One possibility is that some respondents might have misinterpreted treating at regular intervals to mean weeding at regular intervals, thus inflating the 35% figure. Another possibility is that Healthy Schools Act notification requirements may have inadvertently increased calendar-based herbicide spraying. In phone calls to DPR staff, some schools reported that they now designate certain days of the year for pesticide treatments, thereby enabling them to send out fewer special notifications to parents.

Fig. 1. Responding California school districts that reported having an IPM program in place in 2002.
For the treatment of weed problems, respondents cited physical controls such as hand-pulling, cultivating and mowing most frequently (68%), followed by regular spot treatment of turf/landscaping with herbicides (61%), use of mulches (26%), regular broadcast treatment of turf and/or landscaping with herbicides (23%), irrigation management (17%) and flaming — the use of special propane weed torches (7%). The use of broadcast herbicide treatments, which is considered contrary to IPM in this analysis, may be due to the pressure to maintain aesthetically pleasing turf in athletic fields as well as the perception that other controls are too labor-intensive for such large areas.
Ant management
It only takes a few drops of soda or a few cookie crumbs in a child's desk to attract the familiar train of ants. For this reason, ants are the most universal indoor pest in California schools (DPR 2001) and prevention is a critical part of ant IPM. We would expect a district's ant management approach to reveal much about its overall pest-management philosophy, since ants are primarily an aesthetic pest that rarely justify emergency pesticide spraying (the red imported fire ant [Solenopsis invicta] is the exception).
HSA definition of IPM
Under the Healthy Schools Act, integrated pest management (IPM) is defined as: “a pest management strategy that focuses on long-term prevention or suppression of pest problems through a combination of techniques such as monitoring for pest presence and establishing treatment threshold levels, using nonchemical practices to make the habitat less conducive to pest development, improving sanitation, and employing mechanical and physical controls. Pesticides that pose the least possible hazard and are effective in a manner that minimizes risks to people, property and the environment, are used only after careful monitoring indicates they are needed according to pre-established guidelines and treatment thresholds.”
For purposes of this survey, IPM was defined as including (or excluding) the following practices:
Compatible with IPM
-
Keeping records of:
-
Treatment decisions based on pre-established thresholds for ants and weeds
-
Ant baits
-
Improving sanitation for ant control
-
Caulking cracks for ant control
-
Physical controls for weeds
-
Irrigation management for weed control
-
Mulches for weed control
-
Flaming for weed control
Contrary to IPM
-
Treatment at regular time intervals
-
Insecticidal sprays from aerosol cans for ants
-
Regular broadcast of herbicides for turf or landscape weeds
Keeping records of:
Treatment decisions based on pre-established thresholds for ants and weeds
Ant baits
Improving sanitation for ant control
Caulking cracks for ant control
Physical controls for weeds
Irrigation management for weed control
Mulches for weed control
Flaming for weed control
Treatment at regular time intervals
Insecticidal sprays from aerosol cans for ants
Regular broadcast of herbicides for turf or landscape weeds
The survey asked how school pest managers decide whether treatments for ants are necessary. Only 13% of districts treated for ants “when the number of ants exceed pre-established thresholds,” a strategy that is part of a sound ant IPM program. Another 16% of the districts treated for ants “at regular time intervals,” an approach that is not considered part of a sound IPM program, 31% do so “after a certain number of complaints are received” and 33% treat for ants when “first noticed.”
Improved sanitation and the use of ant baits were the most popular practices for controlling ants in school buildings. When asked to identify the “single method used most frequently” for ants in buildings, 32% of respondents identified ant baits, followed by improved sanitation at 22%. When asked to inventory all methods used to manage ants inside buildings, respondents most frequently reported the following IPM-compatible methods: improved sanitation (64%) ant baits (59%), soapy water (38%) and caulking (36%). Ant bait is considered an IPM-compatible ant management method because bait formulations kill the entire ant colony and children are not likely to be exposed to pesticides in baits (as opposed to sprays). However, many pest managers reported using baits as their sole technique, suggesting a lack of integration with preventive practices.
Nearly one-tenth (9%) of responding districts most frequently used the ant control method that is least compatible with an IPM program, “insecticidal spray from an aerosol can.” In addition, 17% of districts reported using spray cans either alone or in conjunction with other methods.
How IPM stacks up
We asked whether school districts had adopted IPM programs, realizing that districts' definitions of IPM were likely to vary widely, especially between agricultural areas (where the term is commonplace) and urban areas (where it is not). More than two-thirds (70%) of responding California school districts reported adopting an IPM program, and 87% reported that they are aware of DPR's School IPM Program. Regions with the largest percentage of districts reporting IPM programs were the San Francisco Bay Area, Los Angeles Basin, southern coast, San Joaquin Valley and southeastern desert regions (fig. 1, page 237).
Pressure from the local community is likely to be a strong factor contributing to a district's adoption of IPM. Local concern is a driving force because the Healthy Schools Act contains no enforcement provisions. As an indirect measure of community concern about pesticides, we asked districts how frequently they received community inquiries on pest management issues. We would expect school districts with high levels of community concern to be more likely to adopt IPM programs.
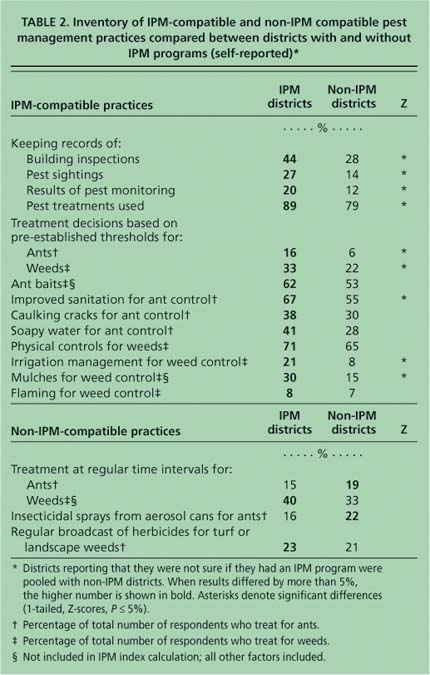
TABLE 2. Inventory of IPM-compatible and non-IPM compatible pest management practices compared between districts with and without IPM programs (self-reported)*

Managing weeds can be difficult and labor intensive for schools, especially those in suburban and rural areas with large turf and landscape areas. Physical controls such as mowing and hand-weeding, above, were reported by 68% of the survey respondents, while 61% regularly sprayed with herbicides, top.
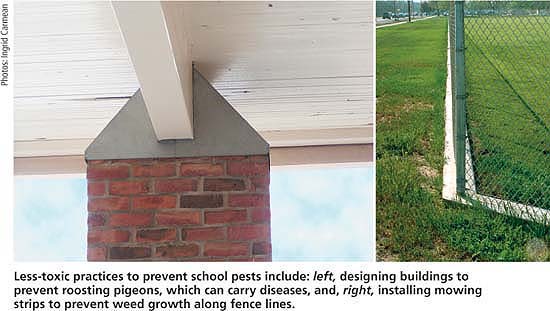
Less-toxic practices to prevent school pests include: left, designing buildings to prevent roosting pigeons, which can carry diseases, and, right, installing mowing strips to prevent weed growth along fence lines.
In general, the results support this expectation. In table 1 (page 237), 8% more IPM districts than non-IPM districts received pest management inquiries either weekly or monthly, implying a correlation between community concern and the adoption of IPM. When the weekly and monthly columns are pooled (due to the skewed distribution of data), the IPM districts showed significantly more frequent community inquiries (chi-squared, P < 0.01). Very few districts (about 2%) receive one or more inquiries per week, while those that reported inquiries at least once per month were most prevalent in the southeastern region (19%), Bay Area (16%) and Los Angeles Basin (12%). Region was not, however, a significant predictor of IPM adoption.
Two other interrelated factors that could contribute to school IPM adoption are school size (enrollment) and type (such as rural, suburban or urban). We might expect that larger districts or those in urban areas, with more staff, centralization and specialization, would be better able to adopt new pest-management approaches and systems. For these analyses, we defined “urban” districts as those in medium or large cities or their urban fringes in the CDE database; all other categories were considered “rural.”
The data showed that enrollment was a significant predictor of IPM adoption (t-test, P < 0.05). The average size of IPM districts was 8,455 students, compared to 4,686 for non-IPM districts (Los Angeles Unified School District, by far the largest in the state, was dropped from this analysis). There was also a weak but nonsignificant relationship between school type and IPM adoption. However, this relationship could not be separated from the enrollment effect because urban districts are also significantly larger than rural ones. Surprisingly, there was no relationship between district size and reported frequency of inquiries.
To find out what the reported use of IPM meant in terms of pest management tactics actually used, we summarized pest management practices deemed compatible with and contrary to IPM principles (table 2). Then we compared both the reported and actual use of these practices in districts that did and did not have IPM programs. We would expect a higher percentage of IPM districts to use IPM-compatible practices and a higher percentage of non-IPM districts to use IPM-contrary practices.
These expectations were generally confirmed, with two exceptions: a slightly higher percentage of IPM districts reported “treating at regular time intervals for weeds” and “use of regular broadcast herbicides for turf or landscape weeds,” both of which might be considered contrary to good IPM practices. Another interesting result was that even IPM districts used insecticides from aerosol cans for ants, a method clearly contrary to sound IPM. In light of this finding, further educational efforts should be directed at keeping these cans out of the classroom.
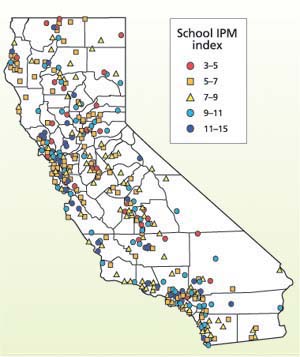
Fig. 2. IPM index scores of California school districts; higher scores indicate greater use of IPM-compatible practices for weeds and ants. IPM index calculation source: Geiger and Tootelian (2002).
We also examined differences between rural and urban districts' pest management practices. Rural residents are generally more familiar with agricultural pesticide use, and we might expect them to evaluate the risks of pesticide use differently than their urban counterparts, which could result in fewer inquiries to school districts and different pest-management philosophies. Indeed, rural districts did receive significantly fewer inquiries than urban districts. Only about 3% of rural districts reported receiving at least one inquiry per month, compared to 21% of districts in large cities and 13% of those in urban fringes of large cities.
To illustrate the geographical distribution of IPM-compatible practices, we constructed an unweighted IPM index using the practices listed in table 2 (fig. 2). Although it is difficult to discern a pattern, the highest-scoring districts appeared to be concentrated in coastal and metropolitan areas.
IPM costs and effectiveness
Pinning down a dollar figure for IPM costs and benefits can be a difficult task, especially with unknown benefits such as the long-term avoidance of new pest infestations and the reduction of human health risks. However, more than half (53%) of the responding districts reported that their IPM programs either reduced long-term costs (28%) or had no impact on those costs (25%). In contrast, more than a quarter (28%) reported that their IPM programs increased the long-term costs of pest management.
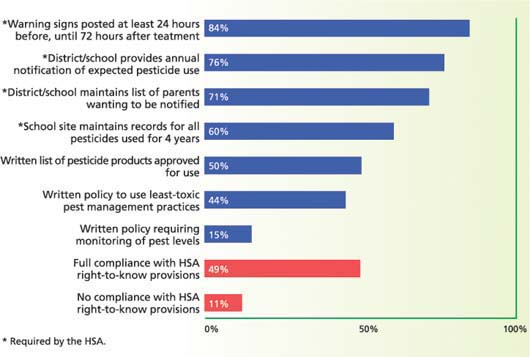
Fig. 3. IPM practices and policies reported as “officially adopted” by California school districts. Percentages shown may understate actual use of these practices.
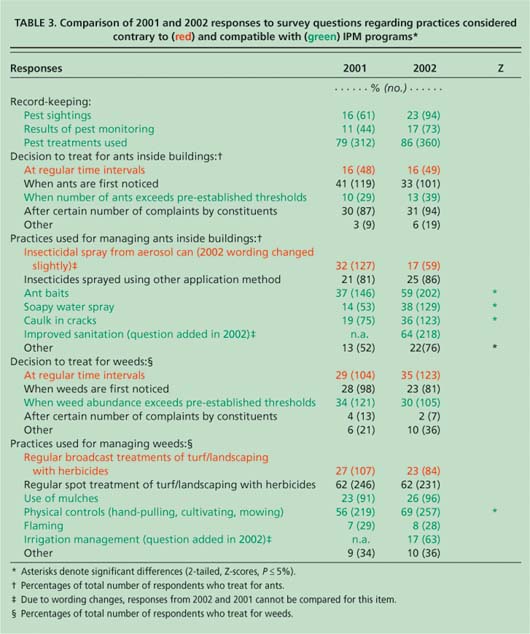
TABLE 3. Comparison of 2001 and 2002 responses to survey questions regarding practices considered contrary to (red) and compatible with (green) IPM programs*
We also asked IPM districts to evaluate the overall effectiveness of their programs. Two-fifths (41%) reported that their program had resulted in more-effective pest management, one-fifth (19%) were uncertain of its effects, and one-fifth (20%) reported that their program resulted in less-effective pest management; the remaining districts did not respond.
IPM policies and HSA compliance
The survey listed a series of IPM-related practices and policies, and asked respondents which ones their district had officially adopted (fig. 3). The most common practices/policies reported were the four right-to-know provisions specifically required by the Healthy Schools Act: (1) posting warning signs, (2) providing annual notification of expected pesticide use, (3) maintaining a list of parents wanting to be notified and (4) maintaining a list of pesticides used during the previous 4 years. Nearly three-quarters (71%) of California school districts had officially adopted at least three of these four provisions. However, less than half (49%) of responding districts adopted all four provisions, which means that by this measure about half (51%) are still not in full compliance.
We also asked all respondents to rate their satisfaction in the previous year with six factors that we considered important to the success of school IPM programs (fig. 4). Significantly more IPM districts rated their performance as “good” for all factors except “contracting procedure,” suggesting that they are more satisfied than non-IPM districts with their pest control efforts.
Schools' progress toward IPM
Although some questions in the 2001 and 2002 DPR surveys were not designed for direct comparison, a comparison of the two surveys shows that California schools are making progress toward adopting more-accountable, less-hazardous pest-management practices, in accordance with the goals of the Health Schools Act. For example, surveyed school districts kept better records in 2002 than in 2001. The percentage of districts recording pest sightings, pest monitoring data and pest control treatments all increased (table 3). Since good record-keeping is a core tenet of IPM, this appears to be a positive trend.

Fig. 4. Satisfaction (rated as “good,” “fair” and “poor”) with factors considered important to the success of IPM programs, compared between California school districts with and without IPM programs (self-reported). Respondents were asked to rate their satisfaction over the previous year. Significant differences (P < 0.05, logistic regression) are shown by asterisks (*).
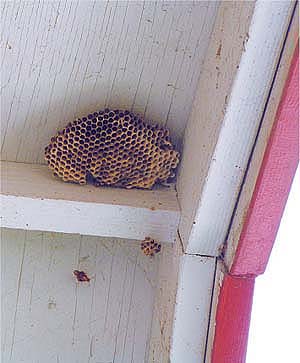
California schools are making progress in adopting less-hazardous pest management strategies. Above, effective methods are available to control wasps, which pose a serious hazard to students allergic to their venom.
Comparing the 2001 and 2002 surveys also suggests a movement toward reduced-risk methods for managing ants. The use of baits, soapy water sprays and caulking in cracks to prevent entry all increased significantly between 2001 and 2002 (table 3). However, insecticidal spray use during the 2 years could not be compared directly, due to refinements in question wording. Schools' approaches to deciding when ant treatments are necessary did not change significantly between years.
The trends in weed management were more mixed. On the negative side, the IPM-contrary practice of treating weeds at regular intervals rose in 2002, while the generally desirable practices of treating “when weeds are first noticed” or “when the abundance of weeds exceeds pre-established thresholds” both declined somewhat. On the positive side, the percentage of districts using physical controls (such as hand-pulling, cultivating and mowing) increased significantly, and the percentage using mulches grew slightly. Also, the percentage of respondents using the IPM-contrary practice of broadcasting herbicides on a regular schedule declined slightly.
In summary, California's public schools appear to be making some progress toward an IPM approach in their ant management, monitoring and recordkeeping practices, although Healthy Schools Act record-keeping requirements remain a challenge for many districts. The survey's picture of weed management practices is less clear; improving weed IPM and avoiding calendar treatment schedules may require additional attention. Increased training in methods such as weed flaming, and wider use of weed barrier technologies such as cloth or mulches, could improve some schools' weed management success, as could the trend toward artificial turf in athletic fields. Generally speaking, larger, urban schools seem to be performing better than smaller, rural schools; this could be function of inadequate training or merely a lack of resources in small districts. These surveys will be invaluable in monitoring progress of school IPM programs in future years.
Healthy Schools Act spurs integrated pest management in California public schools

