


All Issues
Testing protocol ensures the authenticity of organic fertilizers
Publication Information
California Agriculture 67(4):210-216. https://doi.org/10.3733/ca.v067n04p210
Published online October 01, 2013
NALT Keywords
Abstract
There is a pressing need for methodology to confirm the authenticity of fertilizers labeled “suitable for organic production.” In this study, we developed a testing protocol that can be used by laboratories and regulatory agencies to detect adulteration of organic fertilizers and soil amendments with a synthetic nitrogen source. By conducting an extensive literature review and analysis of 180 commercially available raw materials, organic fertilizers, soil amendments and synthetic fertilizers, we compiled a comprehensive database of quantifiable properties of those materials. We analyzed their ammonium content, C:N ratio and stable nitrogen isotope ratio, and for each metric we set thresholds that flag products with a high probability of adulteration. The protocol can be used to authenticate organic fertilizer products and bring transparency to the industry.
Full text
From 2000 to 2011, the organic industry grew from $6.1 billion to $29 billion in sales (OTA 2011). Year-to-year growth during that time was 8%, compared to 1% for the entire food industry (OTA 2011). Despite the organic industry accounting for only 3% of all farm-gate sales (2008 data), California leads the national organic charge, with the highest number of farms, land under production and sales (Klonsky 2010). Also, according to the 2008 Organic Production Survey (OPS), administered by the National Agricultural Statistics Service, the California industry accounts for 19% of all organic farms and 36% of all organic farm-gate sales in the nation (Klonsky 2012). With ever-increasing consumer demand for organic products, this industry is projected to continue its rapid growth in the short to medium term.
This demand has increased pressure on organic growers to maintain and increase productivity. However, this productivity has been partially constrained by availability and consistency (quality) of organic fertilizers. The wide array of fertility products on the market is daunting, presenting a selection challenge for many end users and, due to the natural variability of inputs, product consistency from batch to batch is a major challenge for fertilizer manufacturers. Inputs permissible for the manufacture and handling of organic fertilizers are regulated by the National Organic Program National List of Allowed and Prohibited Substances (USDA 2009a), a list mandated by the Organic Foods Production Act of 1990 (OFPA) and effective as of October 2002.

Researchers developed a database and six-step testing protocol that can be used to detect potential adulteration of organic fertilizers with synthetic compounds. Above, some of the diverse organic fertilizers available for use by growers.
The list allows for the use of non-synthetic inputs while prohibiting the use of synthetic inputs with a few named exceptions including alcohols, chlorine materials and ozone gas (these synthetic inputs are permissible provided they do not contribute to the contamination of crops, soil or water). Prior to 2009, this list formed the basis of oversight on the organic fertilizer industry, providing moderate penalties for known violations (civil penalty of not more than $10,000). However, no emphasis was placed on monitoring and independent verification of the final products to ensure consistency and authenticity of the products.
In December 2008, the Sacramento Bee newspaper published an article titled “Organic farms unknowingly used a synthetic fertilizer,” revealing an investigation by the California Department of Food and Agriculture (CDFA) on the activities of a Salinas-based company (Downing 2008). The company, a one-time supplier of organic fertilizer to approximately one-third of the state's organic farms, was believed to be adulterating their organic fertilizer with ammonium sulfate. At about the same time, another California supplier was implicated in fraud charges, amounting to over $40 million, arising from using cheaper inorganic compounds as substitute nitrogen sources in organic fertilizer made of fish meal and bird guano. These unscrupulous practices increased concern about the authenticity and integrity of soil and crop amendments sold for use in organic production.
To address this, California Assembly Bill AB856 was passed in 2009. This bill, which now governs the oversight of organic input materials sold in the state (Chapter 257, Statutes of 2009), substantially increased the penalties for violation of organic fertilizer standards, required registration of all organic fertilizers sold in the state and gave regulators greater authority to monitor and review organic fertilizer label claims and test the compliance of the guaranteed analyses (CDFA 2012). This oversight is performed by the CDFA Fertilizer Research and Education Program (FREP), a program within the industry-funded Fertilizing Materials Inspection Program (CDFA 2012).
However, until now, regulators administering this law have had no systematic protocol for evaluating and testing the authenticity of the organic products sold. Depending on the degree of adulteration, basic laboratory tests often fail to identify a problem. For example, analysis of nitrogen content may confirm the amount on a product label but will not indicate the source of nitrogen (organic or inorganic).
Stable isotopic ratio analysis can distinguish between organic and inorganic sources of nitrogen and has been used to detect adulteration of food, including honey (Kropf et al. 2010; Stocker et al. 2006) and lamb (Piasentier et al. 2003), as well as inferring the diet and history of cattle from beef samples (Schmidt et al. 2005) and the agricultural regime (organic versus conventional) of cultivated carrots, tomatoes and lettuce (Bateman et al. 2005; Freyer and Aly 1974). Due to large differences in the isotopic ratio of synthetic nitrogen (atmosphere-derived nitrogen isotope ratio [?15N] zero or negative) and organic nitrogen (animal–derived nitrogen has higher ?15N), this approach offers a rapid and reliable technique for detection of potential adulterants in organic fertilizers (Peterson and Fry 1987).
Other routine methods for developing potential metrics for adulteration detection are calculating the carbon to nitrogen (C:N) ratio and total nitrogen as ammonium (NH4-N). Typical values of C:N ratios for organic materials are fish and fish larvae 3.9, zooplankton 5.4 to 5.9, blue-green algae 6.5, corn plants 30.4 and legumes 15 to 25 (Müller 1977). Total nitrogen as ammonium in most organic materials is < 1%, except for liquid fish and seabird guano, but much larger for synthetic inorganic compounds such as urea and ammonium sulfate.
Our research provides insight into the analyses that can be used to assess the quality and regulate the production and testing of organic fertilizers and amendments. The first major objective of our study was to construct a database of materials used in organic and synthetic fertilizers through chemical and physical analyses of these materials and a detailed review of the literature. Our second objective was to establish parameters for the natural ranges of specific chemical properties (i.e., ammonium [NH4+], ?15N and C:N ratio), which can be used to distinguish between pure, or unadulterated, materials and adulterated ones. Our third study objective was to develop a stepwise protocol that labs and regulatory agencies can follow to identify fertilizers that may have been adulterated by synthetic fertilizers.
Database development
Fertilizer analysis methodology.
Synthetic and organic samples (solid and liquid) were obtained from commercial fertilizer suppliers for analysis (n = 180). Prior to analysis, all nonhomogenous liquid samples, such as raw fish, were homogenized by mechanically shaking the sample with glass beads or steel balls. Solid samples were homogenized by grinding with a mortar and pestle, or in the case of very fibrous samples, by mechanically shaking in a steel ball mill.
A subsample of the solid samples, approximately 200 milligrams, was shaken with 100 milliliters of water for about an hour. The solids were removed, either by centrifugation or filtration, and the remaining solution diluted as required for colorimetric ammonia and nitrate determination (Doane and Horwath 2003; Verdouw et al. 1978). For liquid samples, aliquots were taken and transferred to a volumetric flask for appropriate dilution, and concentrations of ammonia and nitrate were determined as above.
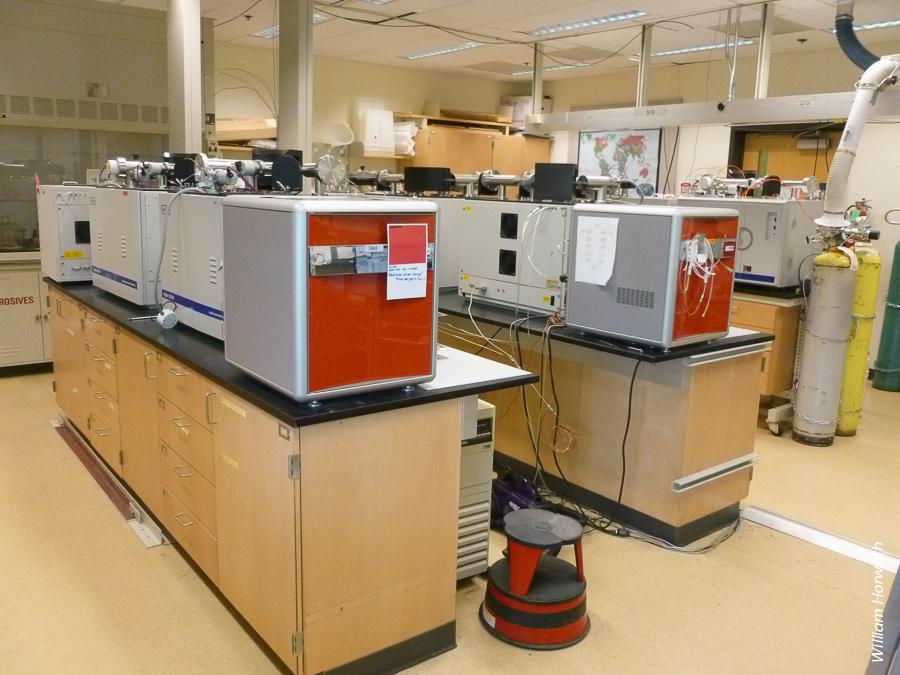
To obtain ?15N isotopic data from organic and synthetic fertilizer samples, researchers used a PDZ Europa 20–20 isotope ratio mass spectrometer in the UC Davis Stable Isotope Facility. Analyses using ATR-FTIR and FT Raman spectroscopy were also performed.
Digestion and combustion were utilized to determine the total nitrogen content of all the samples. The method for calculating total nitrogen by digestion was adapted from Lindner (1944). A subsample, typically 700 milligrams, was dispensed into a 100-milliliter volumetric flask and the weight of the sample recorded. Five milliliters of concentrated sulfuric acid were added, and the samples were heated to approximately 302°F (150°C) until all of the moisture was driven off. Subsequently the samples were heated strongly to 752°F to 932°F (400°C to 500°C) until clear and colorless or almost colorless. The samples were made to volume with water (with a purity of 18.2 M?-cm) and the NH4+ concentration, and therefore total nitrogen concentration, determined.
For total nitrogen by combustion (carbon determined simultaneously), an appropriate amount of sample (2 to 5 milligrams) was dispensed into standard tin capsules used in elemental analysis. The amount of sample required was estimated using the values for total nitrogen previously obtained by the digestion analysis. For liquid samples, a small piece of glass fiber filter was placed inside the tin capsule to absorb the sample. The samples were analyzed by combustion-gas chromatography (Elementar Vario MicroCube, Elementar, Germany), and results for all samples were expressed as percentage by weight of nitrogen or carbon. The C:N ratio (weight by weight, w/w) was calculated from these data.
The relative abundance of ?15N was determined with an isotope ratio mass spectrometer (PDZ Europa 20–20 IRMS, Sercon Ltd., Cheshire, U.K.) at the UC Davis Stable Isotope Facility. For liquid samples that were difficult to homogenize adequately, the ?15N content was also determined by diffusion of the ammonium in a sulfuric acid digest (Sørensen and Jensen 1991). This allowed for a larger subsample to be used than in combustion analysis.
Spectroscopic analysis (single-bounce attenuated total reflectance [ATR] Fourier transform infrared [FTIR] spectroscopy and Fourier transform [FT] Raman spectroscopy) of the organic fertilizers was also performed. ATR-FTIR spectra were collected on a Thermo Nicolet 6700 spectrophotometer (Thermo Scientific, Madison, WI), with 128 scans per sample and a resolution of 4 cm−1. FT Raman spectra were collected on a Bruker RFS 100/S FT Raman spectrometer (Bruker Optics, Coventry, U.K.) with a Nd:YAG laser operating at 1,064 nanometers. The spectra were collected at a power level of 100 milliwatts and a resolution of 4 cm−1, with the spectra being an average of 256 scans per sample.
Data and literature review.
Data from the analysis of 168 organic and 12 synthetic fertilizer samples were combined with data collected from the literature. For ease of comparison and analysis, the organic fertilizers were classified into categories based on feedstock components as used by the Organic Materials Review Institute (OMRI). Blends of varied composition, containing more than two components, were combined into an “other blends” category; for example, a composition of kelp or seaweed extract, humic acid, molasses, vinegar, compost and alfalfa tea; or liquid compost with humates and molasses; or 4–2–3 formulations of fish emulsions, seaweed extract, humic acid and molasses.
Ammonium (NH4+) content, C:N ratio and ?15N were identified as most useful for the initial inspection of the database and evaluation of fertilizers. Databases of expected values for certain parameters were created from laboratory organic fertilizer analyses and a review of raw materials and organic fertilizer literature (figs. 1 to 3). All data are shown together, including data from possibly adulterated products, resulting in a large spread of data in some categories.
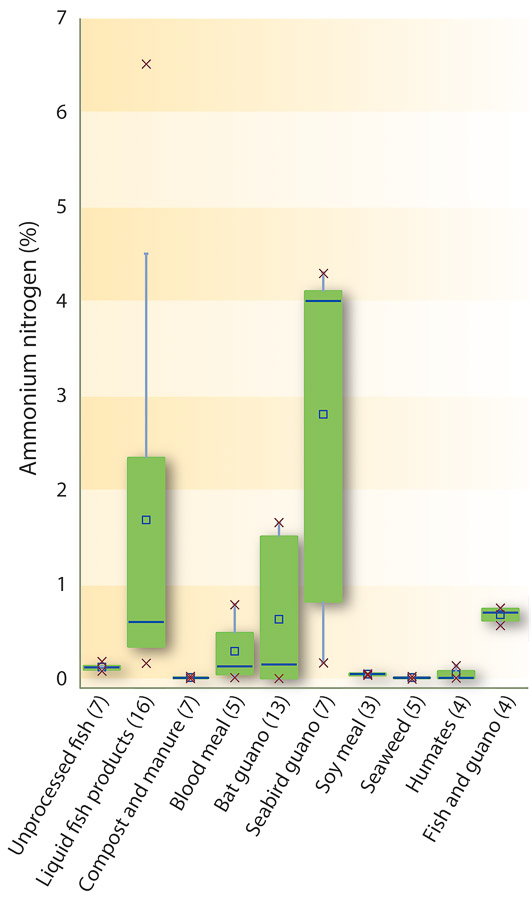
Fig. 1. Ammonium nitrogen content of the different categories of organic fertilizers. Percentages were calculated weight to weight (w/w) for solids and weight to volume (w/v) for liquids. The lines of the boxplot represent the median, 25th and 75th quartile values, and the whiskers represent the maximum and minimum values used in the calculation. The x's represent the range of data. Number of samples are shown in parentheses.
All but three categories (i.e., liquid fish products, bat guano and seabird guano) of the fertilizers had < 1% NH4-N, with considerable variability in the liquid fish and seabird guano fertilizers (fig. 1). Naturally, categories such as seaweed, blood meal, compost and feather meal (not included in fig. 1) do not contain much ammonium, and thus the amount of NH4-N could be an effective determinant of potential adulteration. However, fish-derived and guano fertilizers can contain elevated NH4-N concentrations (created from industrial processes such as heating and enzymatic hydrolysis), thus making this measurement less effective as a determinant of potential adulteration in these materials. Furthermore, the decomposition of fish tissue and products can also naturally result in increased ammonia concentrations (Spotte 1970).
The review of the literature values of the C:N ratio of different organic fertilizers revealed variable values and all mostly > 2. The only exceptions were the seabird guano–derived fertilizers, urea, proteins and amino acids, and uric acid. Several of the analyzed samples (fig. 2) showed a C:N ratio of < 2 (liquid fish products, seabird guano, fish and guano blends, and fish and seaweed blends), which suggests possible adulteration. This is consistent with an addition of nitrogen from a chemical source without carbon, such as urea and ammonia, which would lower the C:N ratio.

Fig. 2. C:N ratios of the different categories of organic fertilizers. The dashed line denotes the threshold value, based on typical protein C:N ratios; organic fertilizers with C:N ratios lower than the threshold might warrant investigation for potential adulteration. Based on 99% confidence intervals, guano and guano blend fertilizers are a possible exception. The lines of the boxplot represent the median, 25th and 75th quartile values, and the whiskers represent the maximum and minimum values used in the calculation. The x's represent the range of data. Number of samples are shown in parentheses.
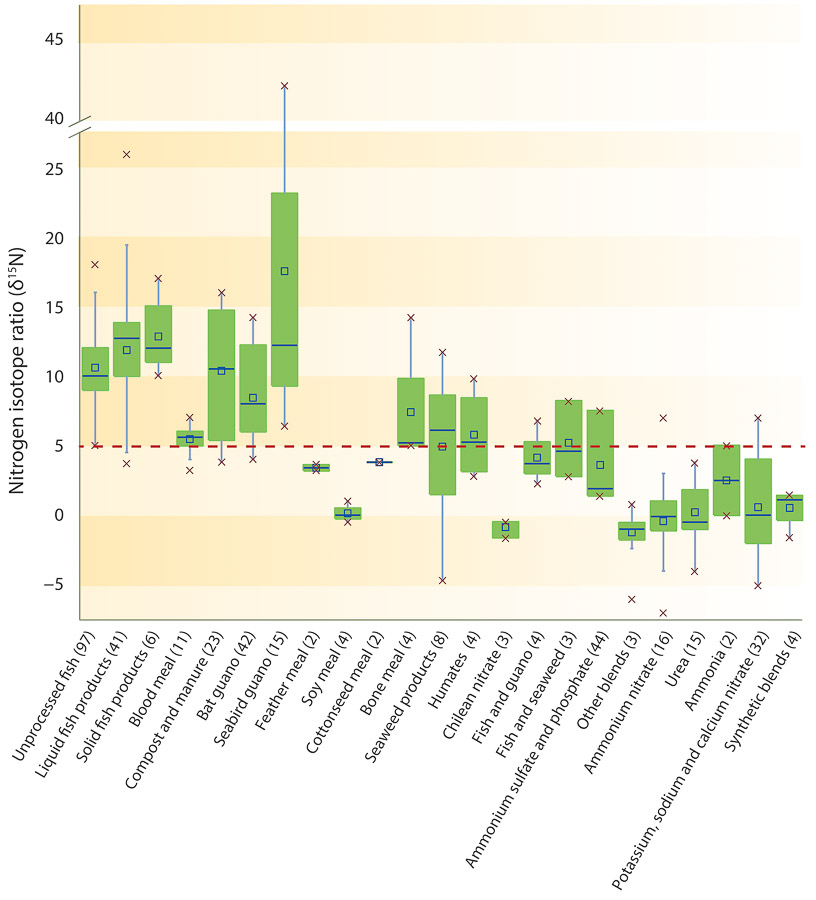
Most of the organic fertilizers had ?15N values > 5 (fig. 3). The exceptions were fertilizers derived from feather meal, soybean and seaweed. Leguminous plants such as soybeans, certain seaweeds and algae are capable of fixing atmospheric nitrogen (?15N of zero), resulting in very low ?15N values. The blends (fish and guano, fish and seaweed, and the blends in the other blends category containing fish and grain, or grain and feather) had lower ?15N values than the fertilizers containing the individual blend components, for example, liquid fish and bat guano. The majority of synthetic fertilizers (urea, ammonium sulfate, ammonium nitrate, and nitrates) had ?15N values < 5. Although not marked, this difference between organic and inorganic fertilizers enabled us to set threshold values for determining potential adulteration, but the situation is complicated by the low values of some organic fertilizers such as seaweed and soy meal products. A similar study of the nitrogen isotopic ratios of organic fertilizers by Verenitch and Mazumder (2012) observed data ranges and magnitudes consistent with those observed in our study.
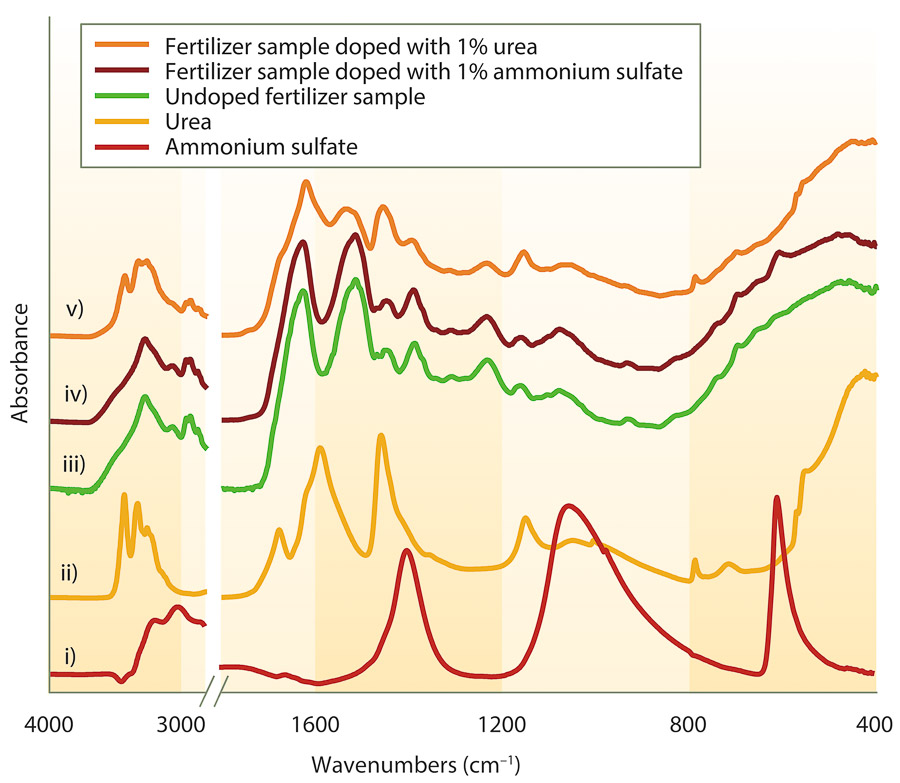
Fig. 3. Nitrogen isotope ratios (?15N) of the different categories of organic and synthetic fertilizer. The dashed line denotes the threshold value, based on the natural isotopic abundance of different materials; an organic fertilizer with a ratio below the line may warrant investigation for adulteration. Based on 99% confidence intervals, seaweed, algae, Chilean nitrate and soybean fertilizers and their blends are possible exceptions. The lines of the boxplot represent the median, 25th and 75th quartile values, and the whiskers represent the maximum and minimum values used in the calculation. The x's represent the range of data. Number of samples are shown in parentheses.
ATR-FTIR spectra of organic fertilizers and several synthetic fertilizers were combined to create a database of spectra. Due to the fact that some chemical bonds absorb infrared light at different wavelengths, FTIR spectroscopy can be used to elucidate the presence of specific chemicals in a given sample (e.g., soil, fertilizer, plant tissue). The infrared light is absorbed differently by various bonds (e.g, N-H, C-N, C-O, C-H, P-O), causing unique vibrations, which then can be used to identify unique compounds or compound classes.
Clear trends based on fertilizer category are evident, making this an important point of reference for future spectral comparison (spectra not shown). Selected fertilizer samples were doped with ammonium sulfate and urea (potential adulterants) to test the robustness of ATR-FTIR spectroscopy in detecting their presence. Spectra of the doped samples showed the technique was sufficiently sensitive to detect the presence of the adulterants at an addition of 1% (w/w) (fig. 4).
For example, a sample of blood meal fertilizer was doped with 1% urea, and the spectra of the doped sample (trace v) was different than the undoped sample (trace iii). The concurrent presence and enhanced peaks at approximately 3,450 cm−1 (N-H vibrational bond stretch), 1,450 cm−1 (urea N-C-N vibrational bond stretch) and 1,600 cm−1 (urea C=O vibrational bond stretch) in the doped sample (trace v) show the presence of urea. The undoped sample spectrum does not show all the urea peaks (e.g., 3,450 cm−1 peak absent); and the peaks that are present (1,600 cm−1 and 1,450 cm−1) are less prominent and likely arise from other constituents in the fertilizer. Also, postprocessing the ATR-FTIR data by subtracting the undoped spectra from the doped spectra (example not shown) can give a clearer indication of the presence of the adulterant. Similarly, analysis of the sample doped with ammonium sulfate was also performed (fig. 4, trace iv), and differences were evident when compared to the undoped sample (trace iii). Peaks associated with ammonium sulfate (trace i) were detected at approximately 1,400 cm−1 (N-H bond deformation) and 600 cm−1 (sulfate SO42− bending mode).
FT Raman analysis of the organic fertilizer samples also revealed clear trends based on fertilizer category (spectra not shown). As in ATR-FTIR analysis, selected organic fertilizer samples were doped with the adulterants (fig. 5, traces iv and v). FT Raman proved to be more straightforward than ATR-FTIR at detecting the presence of the adulterants, with minimal postprocessing of the spectra required. The presence of ammonium sulfate (trace i) and urea (trace ii) can be observed by significant peaks at approximately 980 cm−1 (ammonium sulfate SO42− stretching mode) and 1,012 cm−1 (urea N-C-N bond stretch).

The success of the spectroscopic techniques bodes well for similar analysis of solid fertilizers using near-infrared reflectance spectroscopy (NIRS), which is routinely used in plant, forage and feed tissue analysis to determine components such as crude protein content. As a result, application of this technology to organic fertilizers would not require purchase of new instrumentation. However, the liquid nature of most organic fertilizers presents a challenge for NIRS due to water being a strong absorber of NIR light (Stuth et al. 2003).
Fertilizer screening protocol
The database of ?15N, C:N ratios and levels of NH4-N provides a readily accessible resource for comparison of fertilizer samples and a cheap and rapid way to flag fertilizer samples for more comprehensive analysis. The results from the database compilation have also facilitated the setting of thresholds of expected values in ammonium content, C:N ratios and ?15N. By integrating the literature and laboratory information, we developed a protocol for detecting potential adulterants in organic fertilizers. This is the first such protocol and provides a quick and simple methodology for test labs and regulators of organic fertilizers.
The protocol assumes the most likely adulterants of organic fertilizers are various forms of ammonia (e.g., aqua ammonia or ammonium sulfate) or urea, which is converted to ammonium carbonate and ultimately ammonia in the presence of urease (Volk 1959). These adulterants are favored primarily due to their low cost and high nitrogen content. Since ?15N, C:N ratio and ammonium content most effectively separate different classes of organic and synthetic materials, they best help indicate the presence of adulterants. Furthermore, these properties provide the greatest opportunity to compare with literature data, and are relatively easy to measure (and therefore most useful to a testing lab). Although not part of our study, adulteration by adding nitrate salts is also possible, but the protocol would be able to detect the added nitrogen in the C:N ratios and ?15N values.
The protocol (fig. 6) involves six steps, which progress in order of increasing effort and expense. This protocol minimizes the chances of incorrectly flagging a fertilizer as potentially adulterated through a systematic approach and by ensuring no single metric is a sufficient determinant for classifying a sample as adulterated or unadulterated (Verenitch and Mazumder 2012).

Initially, identification of the category to which a sample belongs and knowledge of the components constituting the fertilizer are necessary in order to interpret the results of analysis and use the protocol effectively, since values that are suspect for one kind of sample may not be suspect for another kind.
Step 1.
Before any laboratory analysis, attention is directed toward the label and price of a product (evaluation of the latter is important, as authentic organic fertilizers with elevated nitrogen content would require considerable processing reflected in a higher cost of production).
A key metric to focus on is the nitrogen content. As stipulated by the USDA, organic fertilizers labeled as containing > 3% nitrogen must be evaluated through a material evaluation program (USDA 2009b). This program requires oversight from third-party evaluators capable of verifying compliance of the component inputs (including processing and handling of the product) independently of the crop producer and fertilizer manufacturer. The suppliers of such products should thus have chemical data on their products showing the independent analytically determined nitrogen levels of the final product.
Due to the numerous potential formulations of organic fertilizers, knowledge of the fertilizer constituents is an important step in directing subsequent analytical tests. For example, in the case of urea-enhanced sawdust, knowledge of sawdust constituents will be important in using the NH4-N content and nitrogen isotope ratios to flag a sample with a borderline C:N ratio.
Correct classification of the fertilizers according to the major constituents present is of paramount importance for subsequent interpretation of the data. As a guide, utilizing classifications similar to other organic fertilizer organizations (e.g., OMRI) will limit potential incorrect classification. Fertilizers containing blends may present a challenge if the relative proportions of the constituents are not revealed.
Step 2.
A first analytical step to evaluating a product is determination of the ammonia (ammonium) content. For common, well-characterized categories of products such as nonfish- or non-guano-based fertilizers, this is an easy preliminary step toward selecting samples for further investigation. Any product in these categories found to contain more than 1% nitrogen as ammonium (10,000 mg L−1) should be retained for further analysis. Potential adulteration of samples that naturally have ammonia (e.g., fish products) can be detected by other tests in the protocol.
Step 3.
The C:N ratio is a good indication of how organic a material is. The nitrogen in organic materials is derived primarily from protein, for which the ratio does not fall below 1. The same is true of guano, although guano may contain much of its nitrogen in the form of uric acid rather than protein. For the threshold, our calculated upper limit of the 99% confidence interval (CI) for the average C:N ratio of the five fertilizer categories with the lowest ratios (i.e., seabird guano, fish and guano, fish and seaweed, amino acids, and other blends, fig. 2) is 1.28. Any fertilizers that do not contain these materials and yet show C:N ratios below the CI value probably (99% likely) contain inorganic nitrogen. However, if the values are higher than these thresholds, it is impossible to say whether the sample has organic nitrogen only. Despite the calculated value of 1.28, it is extremely rare that any protein would have a C:N ratio of less than about 2, hence a threshold value of 2 has been selected for this protocol.
For seabird guano fertilizers, a reasonable threshold, based on literature values and the current database, would be a C:N ratio of 1. An obvious exception is Chilean nitrate, an approved product with a naturally high level of nitrogen relative to carbon. Due to the potentially low C:N ratios of blends containing guano and Chilean nitrate, questionable samples should be further analyzed.
Samples with an ammonium nitrogen content of < 1% (exceptions discussed above) and having a C:N ratio > 2 may be considered likely not adulterated. Failure to meet the criteria of either step warrants further investigation.
Step 4.
The nitrogen isotope ratio (?15N) of natural materials also rarely falls below a certain threshold, with a few exceptions. Fish tissue and guano, for example, do not have ratios less than 5, and they are typically greater. A threshold value of 2.3 was calculated based on the 99% CI for the average of the nitrogen isotope ratios of all nonorganic sources and accounting for variations in sample size (number of values used in the calculation of each product's CI).
Any products that go beyond this threshold (i.e., show higher ?15N values) are almost certainly not adulterated. It is important to note, however, that plants that rely on symbiotic nitrogen uptake can have ?15N values as depleted, or close to atmospheric values, as nonorganic nitrogen sources. So in fertilizers where biomass from nitrogen-fixing plants (e.g., legumes) has been added, it may be difficult to distinguish them from nonorganic sources.
Step 5.
The two spectroscopic techniques provide additional tools for investigating the authenticity of organic fertilizers. Detection of adulterants by ATR-FTIR can be performed by 1) comparing sample spectra with spectra of samples from a similar feedstock, 2) comparing the sample spectra with that of urea or ammonium sulfate and looking for characteristic peaks for ammonia or urea or 3) intentionally doping the sample with urea or ammonium sulfate and analyzing for increased magnitude in peaks characteristic to the adulterants, as in figure 4.
For FT Raman, similar methods of analysis can be used. The spectral interpretation of FT Raman is much simpler, with clear peaks associated with potential adulterants being evident (fig. 5). Both techniques require no sample preparation and very little sample setup, resulting in high throughput of samples. The cost of the instrumentation may be prohibitive; hence the use of these techniques is suggested after all other less expensive options of verification are exhausted.
Step 6.
When a sample clearly fails all or some of the tests, adulteration is likely and warrants further investigation of the manufacturer and process of production.
Suggested protocol
Due to the large diversity of organic fertilizer formulations (many with more than two constituents), this protocol may, with ongoing validation tests and analysis of more samples, undergo modifications that improve its robustness. This initial version, nonetheless, presents a useful approach and methodology for detecting, with high probability, the adulteration of organic fertilizers and other amendments by a synthetic fertilizer or other chemical nutrient sources. Its low cost and relative simplicity ensure regulators and test laboratories can use it to efficiently test commercially available organic fertilizers.
The required analyses for ammonia and total carbon and nitrogen are readily available at soil test labs and the CDFA Inspection Services Center for Analytical Chemistry. These tests alone can flag the majority of samples adulterated with synthetic sources of nitrogen; and any organic grower suspecting adulteration could submit a fertilizer sample to a commercial soil test lab or the CDFA to determine with high probability whether the fertilizer is authentic. Additional stable nitrogen isotope and spectroscopic analysis can likely confirm an adulteration. Since these analyses are not routine for soil test labs, we surmise that the CDFA Inspection Services Center for Analytical Chemistry might be approached to perform further analysis of these suspected samples.
The strength of the organic industry lies in maintaining the integrity of its “organic” brand. Without simple verification methods and rigorous oversight of the fertilizers used in organic production, consumers' trust in this brand may be jeopardized. With a defined testing protocol in place, manufacturers adulterating fertilizers will face the appropriate scrutiny, and legitimate producers of fertilizers will benefit by having the quality of their products assured.
Citations
Testing protocol ensures the authenticity of organic fertilizers

