


All Issues
Tractor-mounted, GPS-based spot fumigation system manages Prunus replant disease
Publication Information
California Agriculture 67(4):222-227. https://doi.org/10.3733/ca.v067n04p222
Published online October 01, 2013
Abstract
Our research goal was to use recent advances in global positioning system (GPS) and computer technology to apply just the right amount of fumigant where it is most needed (i.e., in a small target treatment zone in and around each tree replanting site) to control Prunus replant disease (PRD). We developed and confirmed the function of (1) GPS-based software that can be used on cleared orchard land to flexibly plan and map all of an orchard's future tree sites and associated spot fumigation treatment zones and 2) a tractor-based GPS-controlled spot fumigation system to quickly and safely treat the targeted tree site treatment zones. In trials in two almond orchards and one peach orchard, our evaluations of the composite mapping and application system, which examined spatial accuracy of the spot treatments, delivery rate accuracy of the spot treatments, and tree growth responses to the spot treatments, all indicated that GPS spot fumigation has excellent potential to greatly reduce fumigant usage while adequately managing the PRD complex.
Full text
California almond and stone fruit orchards cover nearly 1 million acres and produced revenues of $3.6 billion in 2010 (NASS 2013). To maintain their productivity and economic competitiveness, however, almond and stone fruit orchards must be replaced every 15 to 25 years. Preplant soil fumigation with 1,3-dichloropropene (1,3-D) or mixtures of 1,3-D with chloropicrin (Pic) is widely practiced in the process of replacing almond and stone fruit orchards. Fumigant treatments are often applied in strips of land that are centered over future tree rows and cover about half of the orchard area. Alternatively, soil fumigation is applied as a full-coverage treatment covering an entire orchard area. When administered properly, soil fumigation prevents serious biological replant problems, which include nematode parasitism (McKenry 1996; McKenry and Kretsch 1987) and the Prunus replant disease (PRD) complex (Browne et al. 2006; Browne et al. 2013). Plant-parasitic nematodes were estimated to infest up to a third of California's almond and stone fruit acreage (McKenry and Kretsch 1987), potentially causing root damage and suppressing yields throughout an orchard's lifetime. PRD is a poorly understood yet widespread soilborne disease complex that suppresses tree growth and cumulative yields in successive plantings of almond and stone fruit orchards (Browne et al. 2006; Browne et al. 2013).

Trial results suggest that GPS-controlled spot fumigation has the potential to reduce fumigant use. Above, testing the fumigant applicator at UC Davis.
For several reasons, soil fumigation must be carefully managed. In California, uses of fumigants and other volatile organic compounds are regulated to reduce their contributions to formation of ground-level ozone (DPR 2012a, 2012b). In addition, the high cost of soil fumigation and increasingly stringent regulations dealing with fumigant rates, buffer zones and surface sealing methods for fumigated soils are incentives for growers to reduce dependence on soil fumigation and keep fumigant rates low.
In previous research, it was determined that the most widespread replant problem of almond and stone fruits, PRD, could be controlled by spot fumigation (Browne et al. 2006). Preplant spot fumigation administered with a hand-held probe to tree planting sites (applied at a single point per tree site) greatly improved growth of trees in several replanted orchards that were subject to PRD but not infested with significant populations of plant-parasitic nematodes.
Spot treatments achieved acceptable PRD control using 25 to 100 pounds of soil fumigant per orchard acre, whereas typical strip and full-coverage treatments require 170 to 400 pounds per orchard acre. However, hand-held probe application of fumigant is considered undesirable for several reasons: It puts workers in close proximity to fumigant hoses and discharge points; it involves large amounts of labor to auger and refill tree planting sites to facilitate probe and fumigant penetration in the soil; and it is relatively slow compared to conventional shank fumigation of an orchard. Also, it is likely that the dose of fumigant administered through a hand-held probe to a single point at a tree planting site would be more effective if it were applied to an area surrounding as well as including the tree site.
In addition to the need for safe and practical delivery methods for fumigants or other preplant treatments to tree sites, there is an associated need for an efficient tree site mapping process; preplant treatments typically occur months before tree planting, and it can be a logistical challenge to accurately place and relocate tree sites throughout the period before planting when cultivation, surface sealing and other cultural operations remove physical tree site markers. A GPS-based mapping system for tree sites would be helpful.
The goal of this research was to engineer and test a safe and practical spot fumigation system for the control of PRD with minimal fumigant. Our specific objectives were to 1) develop GPS-based gridding software that maps tree planting sites and associated spot treatment zones in user-selected tree planting patterns, 2) retrofit a conventional tractor-powered shank fumigation applicator to administer GPS-controlled spot fumigation treatments, 3) evaluate the accuracy and effectiveness of the retrofitted applicator and 4) adapt the system to a commercially available variable-rate application system (VRA) equipped with a sub-inch accuracy real-time kinematic (RTK) GPS-based autoguidance system.
Gridding software
A key component of our system is the gridding software that computes the future planting sites of the trees and associated spot treatment zones in an orchard. Coordinates of field corners are needed to create the planting map. These coordinates can be obtained using a GPS unit with an accuracy that is similar to or higher than the high-performance GPS (HP GPS) unit connected to the precision fumigant controller (PFC). The HP GPS used in this study had an accuracy of 4 to 8 inches. Most growers may want higher accuracy and decide to use a sub-inch accuracy RTK GPS unit.
Orchard sites that involve rows of uneven length and rows that are discontinuous are accommodated by the software. The gridding software allows the user to select row direction, edge of the field along which the first tree in each row would be planted, row spacing, tree spacing along each row, fumigant spot treatment zone length (i.e., the length of the rectangular area to be treated at each tree site) and pattern of planting (rectangle or diamond). The software processes the inputs and produces a transferable file containing the tree site and treatment zone map. Figure 1 shows a partial tree site map developed for an orchard in Arbuckle, Colusa County.

Fig. 1. Part of a tree site map generated by the gridding software for an orchard in Arbuckle, Colusa County. Tree spacing is 14 feet (4.3 meters), row spacing is 20 feet (6.1 meters) and the planting pattern is diagonal. Note that the scales are not the same along the horizontal and vertical axis. Northings and eastings are distance measurements in a Universal Transverse Mercator projection (2-D) commonly used in GPS measurements.
Fumigant application system
Based on the earlier work by Coates et al. (2007), we developed a second-generation site-specific fumigant application system, shown in figure 2. This system was retrofitted on to a conventional shank-type fumigation rig made available to us by Trical, Inc. (Hollister, CA). The conventional rig included a wheeled tractor, shanks, a Raven flow controller (Model SCS 4400, Raven Industries, Sioux Falls, SD) and additional fumigation hardware assembled by Trical, Inc. The conventional rig had five shanks spaced 20 inches (51 centimeters) apart, and each shank was tipped with a horizontal wing attachment that released fumigant from two points that were 8 inches (20 centimeters) apart. Figure 2 shows the components of the conventional rig (only three shanks are shown, as spot fumigation did not use the outer two shanks) as well as additional electronics included to implement spot fumigation.
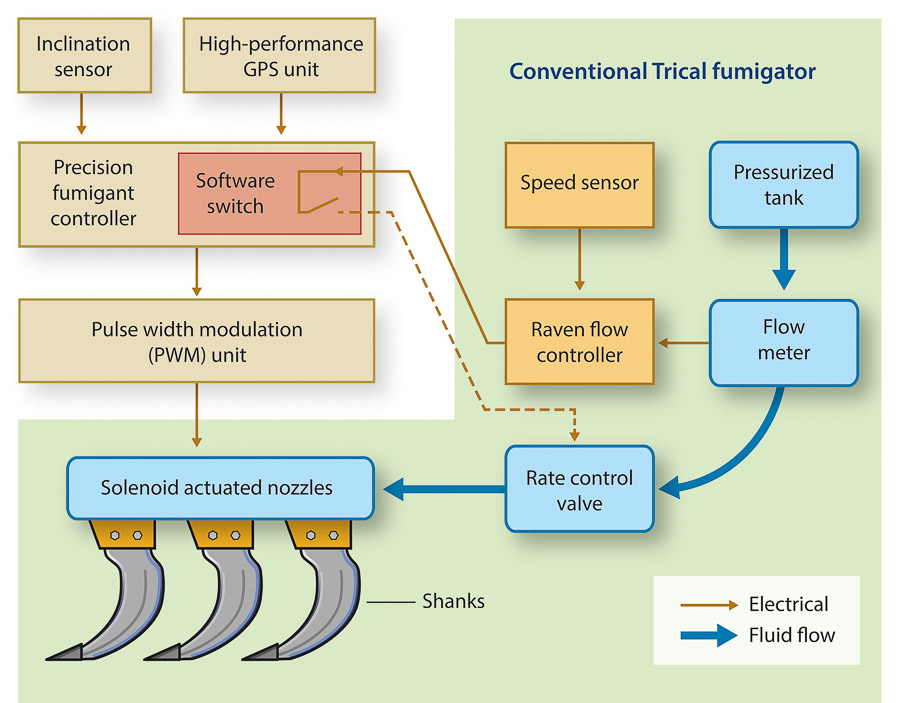
The enhancements to the conventional system were assembled by Holtz and Needham Development (San Francisco, CA) based on our designs and field experiences with those designs. The system consisted of a precision fumigant controller, which was connected to an HP GPS unit (Model RPR 410, Raven Industries, Sioux Falls, SD), an inclination sensor (Model S121T, Murata Electronics, Vantaa, Finland) and a pulse width modulation (PWM) unit with solenoid-actuated nozzles (Capstan Synchro PWM, Capstan Ag Systems, Topeka, KS).
In preparation for spot fumigation, the file of the GPS-referenced tree site and treatment zone map is downloaded as output from the mapping software and uploaded into the PFC, and the desired fumigant application rate and width of the treated area are entered into the Raven flow controller unit. Standard width options include 20, 60 and 100 inches (51, 153 and 250 centimeters) using one, three or five shanks, respectively.
System operation
Once the PFC and Raven flow controller inputs are specified, the system operates as follows:
-
The inclination sensor indicates to the PFC whether the shanks are raised above or submerged in the soil.
-
If the inclination sensor indicates that the shanks are in a raised position, the PFC performs a global search to determine which tree planting spot the applicator is approaching. When the applicator enters the spot treatment zone, the PFC connects the Raven controller to the PWM unit through a software switch (fig. 2), provided the shanks are submerged in the soil (as indicated by the inclination sensor). The PWM unit actuates solenoid nozzles and holds them open for an appropriate duration (i.e., the duty cycle, defined as the ratio of “on” time to total cycle time) to deliver a specified fumigant application rate. The PFC takes into account the response time of the system and applicator travel speed (i.e., it uses an appropriate look-ahead value [LAV]) to anticipate when it will arrive at the treatment zone.
-
The PFC disconnects the PWM unit from the Raven controller when the applicator exits the treatment zone (using an appropriate LAV). This action turns off the nozzles.
-
After the planting site of the first tree is treated, the PFC searches the neighbors of this tree (maximum of eight trees) to determine which tree site will be treated next. The treatment procedure is similar to the one used for the first tree.
-
Once the first and second trees in a row are identified, the PFC determines the direction of travel and locates the rest of the trees in that row using the planting pattern.
-
Spot treatment continues until the inclination sensor indicates that the shanks are raised (e.g., at the end of the row), at which time the PFC disconnects the PWM unit from the Raven controller. This action turns off the nozzles.
-
The operation returns to step 1, repeating through step 6 for the next row, and so on.
Road tests
The PFC may also be operated in a road test mode, during which it ignores the inclination sensor to allow positional accuracy tests with the shanks lifted up in the air. Positional accuracy tests were conducted near the Western Center for Agricultural Equipment (WCAE) on the UC Davis campus using eight marked points spaced 50 feet (15.2 meters) apart on a paved surface.
The applicator was operated in both the east-west and north-south directions with the shanks raised in the air in the road test mode at four different travel speeds: 2, 3, 4 and 5 mph (3.2, 4.8, 6.4 and 8.0 kilometers per hour). The shank nozzles (using water for testing) were supposed to turn on 3.5 feet (1.05 meters) before and turn off 3.5 feet (1.05 meters) after each of the marked points (for a spot treatment zone length of 7 feet). However, due to the system response time (i.e., delay between opening the nozzles and fumigant spraying from the shanks), the spray turned on and off at different locations than expected.
The positional errors were measured to determine appropriate LAVs to minimize the error irrespective of travel speed. The appropriate values (one corresponding to turning the nozzles on and one corresponding to turning them off) were uploaded to the PFC, and another set of road tests was conducted to determine the final positional accuracy of the system.
Field tests
The applicator was then tested to determine accuracy of its delivery rates and delivery placement at the WCAE. The gridding software and a HP GPS unit were used to map 30 hypothetical tree sites. The points were marked off in a rectangular area consisting of six rows spaced 50 feet (15.2 meters) apart, each including five tree sites located 40 feet (12.2 meters) apart.
A spot application zone length of 7 feet (2.1 meters) was selected. The applicator was filled with a colored liquid to be used for injection, and the system was operated at 3 mph (4.8 kilometers per hour) with the shanks submerged in the soil. Liquid deposited from the center shank into the soil was used to evaluate the positional accuracy of the system. To determine the accuracy of delivery rates, fumigant supply tubes were disconnected from shanks and inserted into liquid-catching bottles; the liquid delivered per spot treatment zone was determined. Nine replicates were obtained at a set application rate of 24 gallons per acre. Limited tests were also conducted at other application rates (20 and 33 gallons per acre), and the results were similar.
Orchard tests
The composite mapping and spot applicator system was next evaluated in orchard replant trials, one near Arbuckle, another near Madera, and a third near Parlier. The Arbuckle site was on Arbuckle sandy loam soil and had been devoted to almond on various rootstocks for 27 years (an almond rootstock trial site). The Madera site was on El Peco, Fresno and Lewis sandy loam soils and had grown almonds on ‘Nemaguard’ rootstock for approximately 20 years. The Parlier site was on Hanford sandy loam soil and had grown plums on ‘Nemaguard’ rootstock for 7 years. The trial sites were cleared of their trees in spring (Arbuckle) or summer 2007 (Madera, Parlier). Each replanted orchard was to receive preplant treatments of strip fumigation, spot (tree site) fumigation and a nonfumigated control.
In preparation for the experimental treatments, the orchard mapping software was used to generate a tree site and treatment zone map for each trial. The GPS coordinates of field corners were determined and entered into the software, along with the desired row spacing, the in-row tree spacing, the planting pattern, and the spot treatment zone length (i.e., the length of the treated area desired around the tree sites destined to receive spot treatments). The width of the spot treatment zone is determined by the number of shanks operated.
The HP GPS system was used with the tree site map to place surveying flags to delineate positions of rows and boundaries of replicate plots for the treatments. At the Arbuckle trial, the plots measured 60 feet by 140 feet (three orchard rows wide by 10 tree sites long); the Madera plots measured 66 feet by 126 feet (three rows wide by 9 tree sites long); and the Parlier plots measured 20 feet by 144 feet (one row wide by 12 tree sites long). There were five replicate plots per treatment for each replant trial.
In October 2007, the preplant fumigation and control treatments were applied. At each trial location, its tree site and treatment zone map was uploaded to the PFC. The applicator was used to apply spot fumigation treatments, strip fumigation treatments and nontreated controls to replicate plots. The fumigants used were Pic, and a mix of 1,3-D and Pic (63:35, Telone C35).
The same fumigation rig was used for all fumigation treatments. It was operated in conventional mode for strip fumigation treatments and in spot treatment mode for the tree site treatments. In each trial, the depth of fumigant application by the shanks was 18 to 20 inches (46 to 51 centimeters). The experimental treatments, as well as additional treatments described in Browne et al. (2013), were arranged in randomized complete blocks. The fumigant supply cylinders on the application rig were weighed before and after applying fumigant to known land areas, so that accuracy of fumigant rates could be assessed.
The Arbuckle and Madera trials were planted with almond on ‘Nemaguard’ rootstock in March and January 2008, respectively; the Parlier plots were replanted with peach on ‘Nemaguard’ rootstock in February 2008. Efficacy of the treatments in each trial was initially assessed by measuring increases in tree trunk diameters annually from the time of planting through the end of the second growing season. Long-term assessments of the treatments described here, as well as of additional treatments, are presented in Browne et al. (2013).
Road test results
Road test results indicated that LAVs, which measure the system response times, were 328 milliseconds while turning on the solenoid-actuated nozzles and 317 milliseconds while turning them off. When these were incorporated into the system, the location accuracy of the system was independent of the travel speed and was within the accuracy range of the HP GPS unit used in this study, that is, 4 to 8 inches (10 to 20 centimeters).
Field test results
Field test results (table 1) indicate that the system tended to turn on and off early, by 8 to 10 inches (20 to 25 centimeters), in both the east-west and north-south directions. Even a slight error in positioning the shank nozzles could result in errors of this magnitude. Moreover, the movement of soil at the surface caused by the passage of the shank also contributed to this error. The root mean square (RMS) error was in the range of 4.7 to 6 inches (12 to 15 centimeters) for all the tests. The actual spot application zone length was about 87 inches (221 centimeters) in both east-west and north-south directions (a 3.8% error compared to the expected value of 84 inches, or 213 centimeters). These error values are within the range expected for the HP GPS system used (4 to 8 inches, or 10 to 20 centimeters).
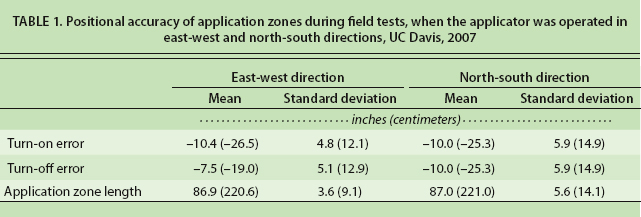
TABLE 1. Positional accuracy of application zones during field tests, when the applicator was operated in east-west and north-south directions, UC Davis, 2007
Table 2 presents the results of the application rate test for a set delivery rate of 24 gallons per acre. The mean application rate was found to be 22.98 gallons per acre, with a coefficient of variation of 7.34%. This level of accuracy was considered reasonable in this study.

TABLE 2. Fumigant delivery rate accuracy during field tests, with the applicator set at 24 gallons per acre, UC Davis, 2007
Orchard test results
At the Arbuckle trial, where treatments called for application of 1,3-D: Pic (60:39) at 400 pounds per treated acre either to spot treatment zones 7 feet long by 5 feet wide or to strips 8.3 feet wide centered over future tree rows, actual fumigant application rates were acceptable. However, there were no significant growth responses in the replanted trees to preplant fumigation as compared to the control treatment.
Based on cylinder weights, the actual spot application rate averaged 10% above the target rate for the spot treatment zones (standard deviation 14%, based on three determinations). The strip application rate averaged 2% above the target rate (standard deviation 1%, three determinations). The mean increase in trunk circumference from the time of planting to 1 year later ranged from 4 to 4.2 inches (10.1 to 10.7 centimeters) among the control, spot and strip treatments; there was no significant treatment effect (P = 0.5).
At both the Madera trial and Parlier trial, actual spot and strip fumigation rates were acceptably close to the targeted rates, and there were positive growth responses to all fumigation treatments (tables 3 and 4). At Madera, spot and strip application rates each averaged 2% above rates targeted for the application zones; standard deviations of the spot and strip application rates were 22% and 2%, respectively (each based on three measurements). At Parlier, the mean spot application rates were equal to the targeted rates (standard deviation 22%, based on three measurements), while the mean strip application rates averaged 2% above targeted rates (standard deviation 2%, three measurements).

TABLE 3. Effect of spot and strip treatments on growth of replanted almond trees, Madera trial, 2008–2010
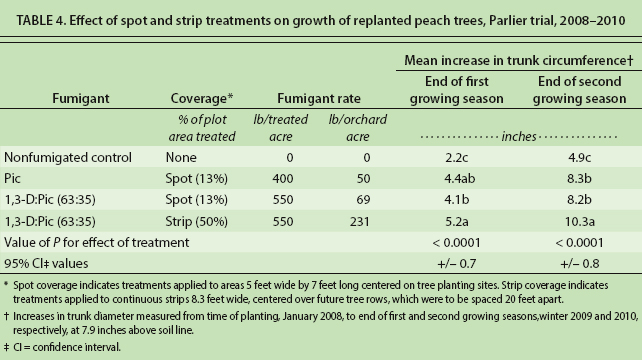
TABLE 4. Effect of spot and strip treatments on growth of replanted peach trees, Parlier trial, 2008–2010
Both spot and strip treatments significantly increased growth in trunk circumference from the time of planting through the second growing season (tables 3 and 4). In the Madera trial, compared to the nonfumigated control, fumigation treatments increased mean trunk circumference growth by 33% to 37% (spot treatments) and 37% to 40% (strip treatments) by the end of the first growing season, and by 22% to 23% (spot) and 31% to 35% (strip) by the end of the second growing season (table 3). In the Parlier trial, compared to the control, fumigation treatments increased mean trunk circumference growth by 87% to 102% (spot treatments) and 140% (strip treatment) by the end of the first season, and by 68% to 71% (spot) and 110% (strip) by the end of the second growing season (table 4).
Fumigant savings, expectations
Overall, results of our orchard assessments, including the fumigant rate delivery evaluations and preliminary tree growth assessments, indicate that the GPS-assisted orchard mapping and spot fumigation system offers great potential to reduce the amount of fumigant required to control PRD. The spot treatments tested here reduced fumigant amounts used per orchard acre by 71% to 74% compared to strip treatments with the same fumigant. Such reductions could reduce overall fumigant use for almond production as well as aid growers in meeting buffer zone requirements, which are based to a significant extent on fumigant used per orchard acre.
Additional data, including canopy absorption of photosynthetically active radiation (PAR) at Madera, 2 and 4 years of crop yield data for the Madera and Parlier trials, respectively, and multiple-year treatment cost and value assessments for both trials are presented in Browne et al. (2013). The additional data support the conclusion of this paper, that GPS-controlled spot fumigation may afford practical and adequate control of PRD with less fumigant. Finally, the spot treatment technology may have additional utility beyond application of fumigants. For example, our system may be used to apply nonfumigant liquid soil amendments that may be beneficial for growth of replanted trees.
It is important to distinguish between responses that growers may expect from spot treatments when replanted orchards are impacted only by PRD and responses that may result from spot treatments when plant-parasitic nematodes also are present. In comparison to PRD, which typically has its most severe impact on young orchards in their first and second years of growth, plant-parasitic nematodes that affect almond and stone fruits (i.e., ring, lesion and root knot nematodes) may have a later yet more persistent impact over the life of an almond or peach orchard, and spot treatments may not adequately protect trees from building of nematode populations. Nevertheless, whereas about 35% of almond and stone fruit orchards are impacted by plant-parasitic nematodes, it is considered likely that a much higher percentage of the acreage is impacted by PRD and therefore may benefit from spot treatments (Browne et al. 2006). We are currently optimizing the spot treatment system to facilitate its use in commercial agriculture.
New developments
Since establishing the technical feasibility of the spot treatment system, our focus has been on facilitating its use in agriculture. Major parts of this process have been adapting the system to meet commercial needs and taking advantage of emerging agricultural technologies. One set of the adaptations has involved replacement of the PFC with a variable-rate applicator (VRA) system produced by Ag Leader Technology (Ames, IA). VRA systems are used widely in precision agricultural applications, including soil fumigation, and the systems feature helpful visual displays and GPS-interfacing capabilities that are helpful in practical use.
Use of the VRA for spot treatment applications required accommodations in our gridding software; it was necessary that the map delineate all of the tree site treatment zones into a shape file containing just a few polygons. We decided to create a shape file containing a single polygon. Figure 3 shows a graphic representation of a shape file for tree sites arranged in a diagonal planting pattern. The wavy pattern is a consequence of the diagonal arrangement of tree sites; had the tree sites been arranged in a rectangular pattern, the interconnecting zones of the shape file would have been rectangular. Although within the required polygon the spot treatment zones are connected (fig. 3), the VRA uses the shape file to treat only the target spot treatment zones, which are still discontinuous along the tree row and selected according to the spot treatment zone length specified in the gridding software and the swath width option (20, 60 or 100 inches) selected according to the number of shanks used to deliver fumigant.
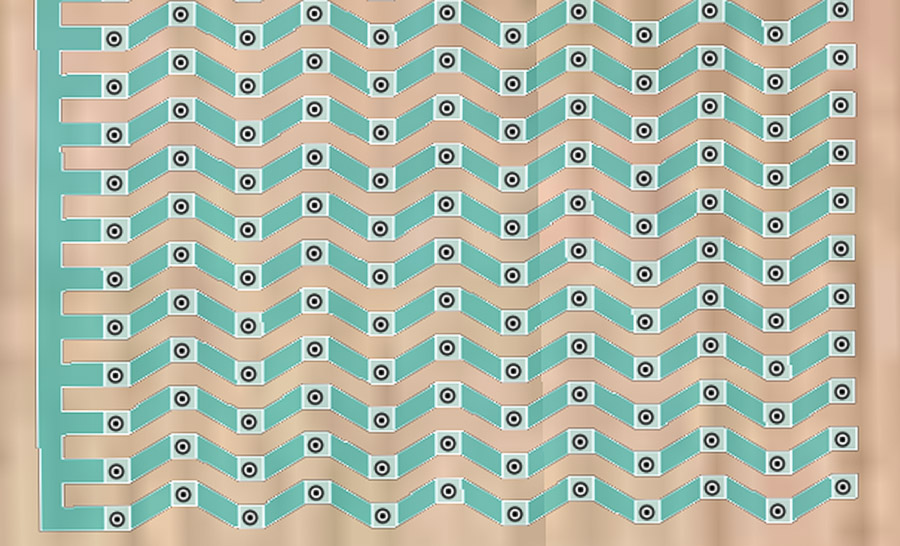
Fig. 3. A map of a section of the Arbuckle orchard (fig. 1) showing the grid points (tree sites, black dots), spot treatment application zone around the grid points (white square), and a single polygon created by joining application zones for each tree so that the map is compatible with commercial variable-rate fumigant applicators.
A serious limitation of the Ag Leader VRA system used in this ongoing study is that it does not report delivered flow frequently enough to produce an accurate as-applied map (i.e., a spatial GPS-referenced map recording actual deliveries of fumigant, relative to the targeted spot treatment zones). The VRA system works fine in generating as-applied maps of chemical application in field crops, but in these applications data are typically logged at the rate of 1 hertz or lower, which is too slow for fumigation of a very small targeted spot treatment zone. We are seeking solutions to this problem, because fumigant delivery records for all tree sites would have practical value for commercial applicators, growers and perhaps even regulatory personnel.
Additional adaptations have involved use of RTK-based autoguidance systems that achieve sub-inch accuracy using virtual reference stations (VRS). These stations are available through subscription in most parts of California and eliminate the need for expensive physical base stations. Preliminary tests have been conducted using the updated software and applicator components of our spot treatment system, and the results have been satisfactory. Additional tests will be conducted in the coming year.
Tractor-mounted, GPS-based spot fumigation system manages Prunus replant disease

