


All Issues
Satellite imagery can support water planning in the Central Valley
Publication Information
California Agriculture 63(4):220-224. https://doi.org/10.3733/ca.v063n04p220
Published October 01, 2009
PDF | Citation | Permissions
Abstract
Most agricultural systems in California's Central Valley are purposely flexible and intentionally designed to meet the demands of dynamic markets such as corn, tomatoes and cotton. As a result, crops change annually and semiannually, which makes estimating agricultural water use difficult, especially given the existing method by which agricultural land use is identified and mapped. A minor portion of agricultural land is surveyed annually for land-use type, and every 5 to 8 years the entire valley is completely evaluated. We explore the potential of satellite imagery to map agricultural land cover and estimate water usage in Merced County. We evaluated several data types and determined that images from the Moderate Resolution Imaging Spectrometer (MODIS) onboard NASA satellites were feasible for classifying land cover. A technique called “supervised maximum likelihood classification” was used to identify land-cover classes, with an overall accuracy of 75% achievable early in the growing season.
Full text
AT approximately $35.4 billion in estimated economic value (AIC 2006), agriculture is extremely important to the economy and well being of California. The state's high level of agricultural productivity is driven by favorable climate and water availability; the latter is a direct result of water planning and crop management. Water balances — the annual equation of water availability and usage — are used to develop plans and management strategies for ensuring agricultural productivity and optimizing water use.
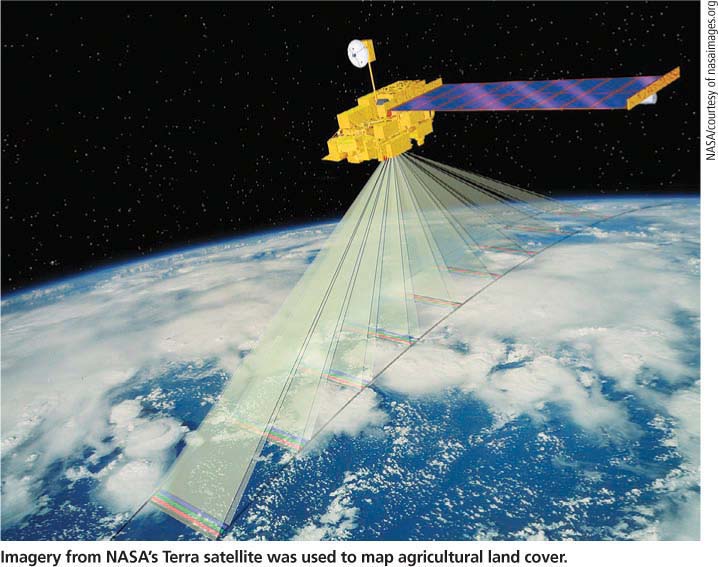
Imagery from NASA's Terra satellite was used to map agricultural land cover.
In the Central Valley, which accounts for about 43% of California's agricultural production, water is scarce and the water balance is primarily determined by irrigation requirements for different types of crops such as corn, tomatoes and cotton. Accurate maps of agricultural land cover are critical if we are to develop annual water balances and maintain agricultural productivity.
Currently, agricultural land cover is mapped using an observational survey, which does not efficiently capture actual annual changes in crop type. This survey is generally conducted by representatives of state and federal agencies, who collect some information about crop types, land-use changes and agricultural land management for a subset of all agricultural land in the Central Valley, for example, land-use maps by the Department of Water Resources, State of California ( www.water.ca.gov/landwateruse/lusrvymain.cfm ). This information is compiled annually into a land-cover map, which is then analyzed to estimate agricultural water use.
Critics of this approach argue its intrinsic shortcomings. First, the annual compilation of data by human observation is expensive, incomplete and sometimes erroneous. Second, too much time is required to observe and compile land-use information and develop a water balance. Lastly, agricultural land-management objectives change from year to year as reflected by visible changes in crop cover; an observational survey does not completely assess these changes, since only a percentage of land is sampled in any one given year due to financial constraints.
We believe that a better approach would be to include automation, objectivity and a feasibility study for complete annual land-use assessments. Automation reduces the cost of human labor, time and, potentially, error and enables the collection of timely information in a consistent manner. Objectivity, or the ability to collect unbiased information, gives credibility to water planning.
Remote sensing, or the analysis of satellite imagery, is a widely used method to obtain information for water planning, since it employs objectivity and can be used to automatically map agricultural land cover (Erol and Akdeniz 2005; Martinez-Casasnovas et al. 2005; Murakami et al. 2001; San Miguel-Ayanz and Biging 1997; Turker and Arikan 2005; Xie et al. 2007). One type of widely available satellite data is Moderate Resolution Imaging Spectrometer (MODIS) imagery collected and maintained by the National Aeronautics and Space Administration (NASA). This imagery is free, which makes it especially desirable from a cost-savings perspective. Additionally, MODIS images are recorded twice a day for the entire Central Valley, allowing for some unique temporal analyses. In this study, we explored how MODIS imagery can be used to map agricultural land cover for a portion of the Central Valley. Our long-term goal is to improve and extend the described methodology to the entire valley, to efficiently support water planning.
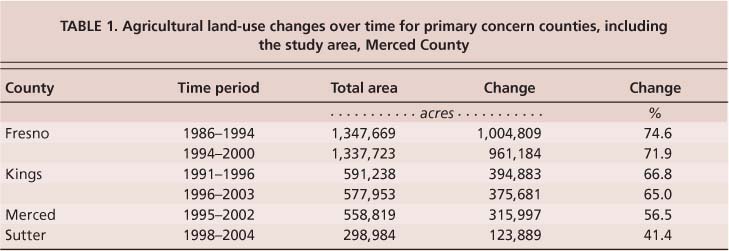
TABLE 1. Agricultural land-use changes over time for primary concern counties, including the study area, Merced County
The objectives of this study were to (1) demonstrate the feasibility of MODIS imagery to monitor crop types for water planning, (2) assess the accuracy of derived crop-type maps and (3) determine when crop types can first be identified from MODIS imagery on an annual basis. The latter objective is critical to the timely development of water balances for planning purposes.
Analyzing MODIS data
Study area.
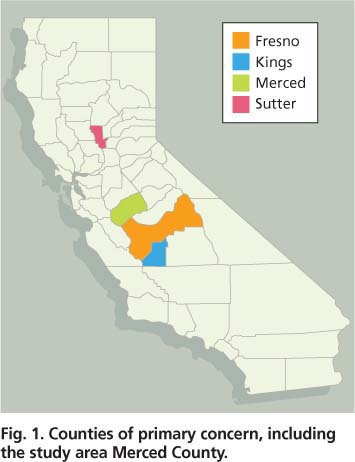
Four counties are particularly important to the agricultural economy of the Central Valley: Fresno, Kings, Merced and Sutter (fig. 1). The total value of agricultural products sold from these counties is about 36% of all those sold from the valley, and these counties depend on flexible agricultural systems that are adaptable to annual or semiannual economic conditions, as indicated by historic map data (USDA 2004). This data shows that approximately 40% to 60% of land cover in the four counties has changed within the last 5 to 8 years, and that land-cover changes have gone unrecorded by current land-use sampling methods (table 1). Any of these counties were logical study areas for our research because of their economic importance and because planners need accurate land-use information; however, we chose Merced County arbitrarily.
Satellite images.
In this study, MODIS imagery was analyzed to identify agricultural land cover using reflectance and changes in reflectance over time. MODIS imagery was selected for its coverage, frequency, quality and cost. Unlike other types of satellite imagery, individual MODIS images cover large land areas that are repeatedly observed on an 8-day cycle. Additionally, MODIS imagery is high quality and available for free public download ( https://wist.echo.nasa.gov/api ).
Other types of satellite imagery were considered but found inadequate to our study objectives. We considered NASA's Landsat Thematic Mapper and Enhanced Thematic Mapper Plus (TM/ETM+), which also provides free images, but found it had poor coverage, relatively low frequency and quality issues. Although the spatial resolution of Landsat imagery is higher than MODIS imagery (30 meters versus 250 meters for optical bands), many more Landsat images are required to cover the same land area. Also, Landsat makes observations on a 16-day cycle rather than daily, which increases the risk that images may be obscured by cloud cover, especially during Central Valley winters. Landsat imagery is more likely to be unusable than MODIS imagery, which significantly affects the time-series analysis used in this methodology. Finally, due to the malfunctioning of the ETM+ sensor onboard Landsat 7 (the most recent satellite of the Landsat series), the quality of the imagery has largely deteriorated, which would negatively affect the accuracy of agricultural land-cover mapping.
Quantifying vegetative growth.
A common measure called the normalized difference vegetation index (NDVI) was used to quantify vegetation growth. Like all color digital images, MODIS captures bands of spectral reflectance information during each exposure. Each pixel (picture element) in the image contains these bands, and for most hand-held digital cameras they correspond to the red, green and blue segments of the visible spectrum. Satellite imagery has additional bands that are taken from the invisible portions of the spectrum, such as the near infrared (NIR). NDVI is calculated from a combination of the red and near-infrared spectra for a single pixel as: NDVI = NIR−RED NIR+RED This ratio is based on the photosynthetic attributes of vegetation, which tends to absorb red and blue radiation from the sun (hence reflecting the color green) but reflect more near-infrared energy. More importantly, NDVI can be used to determine plant vigor. Using a series of images over time, the change in vigor as measured by NDVI can be used to identify specific crop types (Choudhury and Chakraborty 2006; de Wit and Clevers 2004; de Santa Olalla et al. 2003; Martinez-Casasnovas et al. 2005; Murakami et al. 2001; Tso and Mather 1999; Turker and Arikan 2005).

Improvements in high-resolution satellite imagery and modeling techniques will help to classify crops at higher degrees of accuracy.
Supervised classification.
We identified agricultural land cover for the entire study area using an approach called “supervised classification,” which involves training a computer to associate pixels with types of land cover. First, we trained the computer in two different types of pixel data over time: (1) NDVI and (2) red (620 to 670 nanometers [nm]) and near-infrared (841 to 876 nm). The latter of these types is referred to as componential, since it spans two layers of spectral information (red and near infrared) as opposed to a single composite NDVI layer. Second, the computer classified the MODIS imagery into agricultural land-cover classes for two sets of images: (1) those taken during the growing season and (2) a subset taken early in the season.
High-quality images.
MODIS imagery, which is adjusted for atmospheric and radiometric conditions, has a spatial resolution of approximately 250 meters by 250 meters and temporal sampling frequencies that depend on the type of pixel data. The NDVI pixel data is a time series with 16 days between sequential images, while the componential pixel data has an 8-day period. Within each period, all daily images, barring heavy cloud cover and equipment error, are extracted to produce an extremely high-quality composite image for the entire 16- or 8-day period. Therefore, both types of pixel data can be viewed as having multiple spectral bands, each related to a specific period in time. For example, pixel data having a series with six periods will have six layers under the NDVI type (one spectral band per period times six periods), while the componential type will have 12 layers (two spectral bands per period times six periods). Similar research on sugar cane shows that imagery such as MODIS, with temporal sampling frequencies, will give good results (Xavier et al. 2006).

Supervised training
A computer-based software program was trained using a subset of data: images of Merced County captured in 2002 and historic information collected from the same year's land-use survey. We considered nine major crops comprising 83% of all agricultural acres in the county for training and classification (table 2). Groups of pixels, or samples in the MODIS imagery, were manually associated with each of the nine crops based on their spatial proximities to true land covers in the historic land-use survey data. Each group of pixels represented an observed class of agricultural land cover and more importantly, from a statistical perspective, each was a sample from a probability distribution. Although probability distributions are fairly complex mathematical objects, they are generally parameterized by means, variances and covariances.
Between 76 and 500 samples were used to estimate the means and variance-covariances for each of the nine classes. Based on the estimated statistics, the computer used a well-accepted technique called maximum likelihood classification (El-Magd and Tanton 2003) to assign a pixel with NDVI or componential data into one of the nine classes. Maximum likelihood is a mathematical approach to estimation that involves fitting model parameters using products of samples. The resultant models, one for each of the nine classes, were the fundamental bases for automatic classification.
Automatic classification
Prior to classifying all MODIS pixels, each of the nine parameterized models was examined for uniqueness, because models that are too similar will not give good results. Since training was conducted separately for each pixel data type — the NDVI pixel data separately from the componential (red and near-infrared) pixel data — the parameterized models corresponding to classes were analyzed for separability.
Based on the analysis, the classes derived from componential pixel data were more unique than those derived from NDVI pixel data. For example, the double-use land-cover class “grain/corn rotation” was similar to the land-cover class “grain” under the NDVI pixel data (fig. 2). This was also the case for corn and tomatoes. These similarities between classes under the NDVI pixel data might have been due to the limited number of samples used in the maximum-likelihood estimation of model parameters.
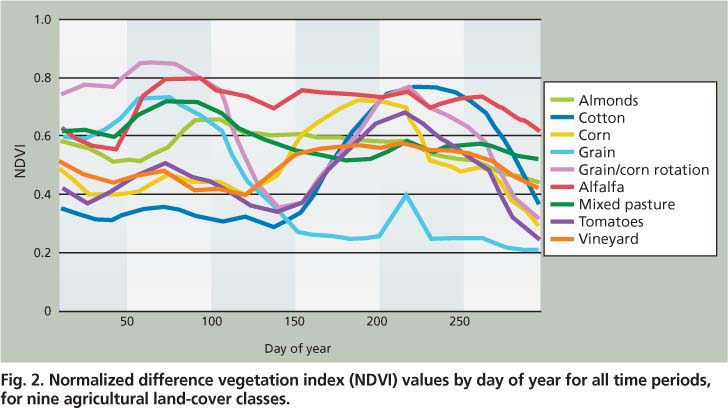
Fig. 2. Normalized difference vegetation index (NDVI) values by day of year for all time periods, for nine agricultural land-cover classes.
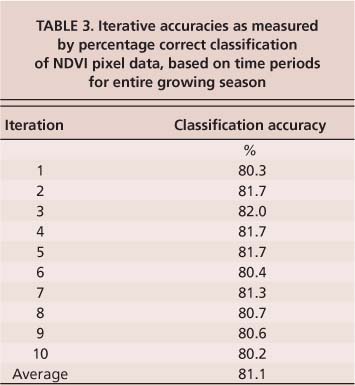
TABLE 3. Iterative accuracies as measured by percentage correct classification of NDVI pixel data, based on time periods for entire growing season
Despite the observed limitations in crop-class separability (fig. 2), we implemented the automatic classification of all MODIS pixels for both the NDVI and componential pixel-data types separately. Each pixel having bands and values corresponding to periods in time was evaluated under each of the nine models for each of the pixel-data types. Discriminate analysis was used to decide the best model for each pixel, and each pixel was classified to one of nine land covers.
Cross-validation of accuracy
Classification accuracy was measured as a percentage of pixels correctly classified in a set of test pixels randomly chosen in the imagery. Just as groups of training pixels were used to parameterize probability models for each of the nine classes, groups of test pixels were used to evaluate the classification accuracy of the models. A special iterative technique called “cross-validation” was used to calculate a robust measure of classification accuracy. Given an entire set of pixels with known land-use classes (identified from the historic land-use survey data), half were randomly selected and used for training and their complement was used for accuracy testing. Upon a certain number of iterations — random training, classification and accuracy testing — the average of iterative classification accuracies converges to overall classification accuracy. We examined this measure based on 10 iterations for two sets of images in time, one captured during the entire growing season and another early in the growing season.
Entire growing season.
Only the NDVI pixel data was used for classification over the entire growing season. It was fairly accurate in classifying crop types despite limitations in the separability of cover classes such as grain and grain/corn rotation or corn and tomatoes (fig. 2). Four time-periods (scenes) of the NDVI pixel data are shown in figure 3 along with the overall classification results, which are based on all periods in the time series. An overall classification accuracy of 80% was achieved using the NDVI pixel data (table 3), but the classification accuracy for corn, tomatoes and cotton was lower than overall (about 50%).
As indicated by the separability analysis, these misclassifications were probably due to the limited amount of training data, for corn in particular. Another possible cause might have been spectral mixing. Since the resolution of the MODIS imagery is about 250 meters per pixel, two or more types of land cover could exist in any one pixel, causing an inseparable mixing effect and confounding models for respective land-cover classes. Possible solutions to improve classification accuracy include using high-resolution imagery containing pixels that are less mixed or implementing a complex, multistage classification scheme.

Fig. 3. Arbitrary NDVI pixel data displayed as stacked grayscale images for all time periods, and final classification of NDVI pixel data based on all time periods for entire growing season.
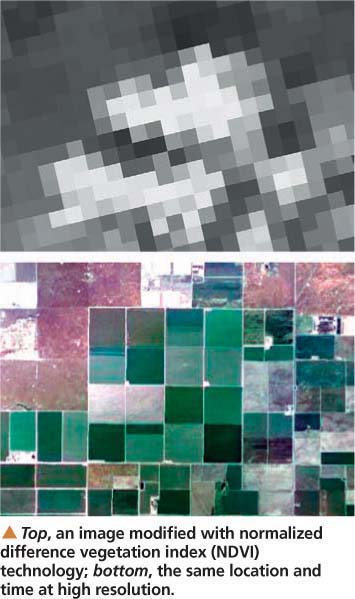
Top, an image modified with normalized difference vegetation index (NDVI) technology; bottom, the same location and time at high resolution.
Early growing season.
The number of images used for early-growing-season classification was increased by period to determine when agricultural land cover can first be reliably identified. For the NDVI pixel data, this point occurs at approximately 12 periods or 192 days into the growing season with an overall classification accuracy of 75%. For the componential pixel data, the reliable identification time is approximately 17 periods or 136 days into the growing season to achieve accuracy as high as 75%.
For classification early in the growing season, the componential pixel data gave classifications that were equal in accuracy to the NDVI pixel data, but results were achievable almost 2 months earlier than with NDVI. This means that agricultural land cover can be identified by the month of May to support the current year's water planning. Similar to classification issues for the entire growing season, we expect that accuracy can be improved for early-growing-season classification with high-resolution imagery and a modified classification method.
A feasible solution
The accuracy and timeliness of land-cover classification can be improved over existing mapping methods using satellite imagery and remote sensing. We have shown that time-series MODIS imagery in the form of NDVI, or red and near-infrared spectra, provides a feasible solution for agricultural land-cover mapping. Our results indicate that the major agricultural crops can be identified by as early as May with an overall accuracy of about 75%. While our research was conducted in Merced County using MODIS imagery from 2002, we expect that our methodology is applicable to the entire Central Valley with similar results.
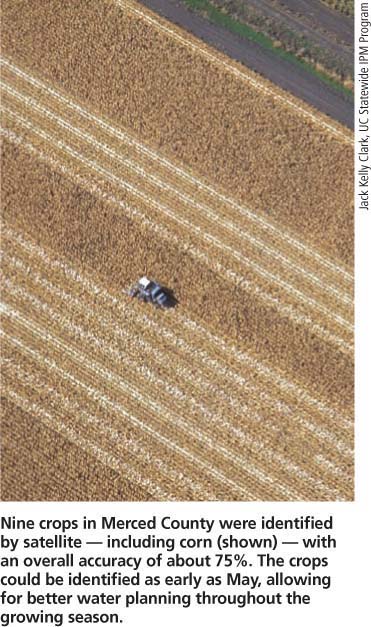
Nine crops in Merced County were identified by satellite — including corn (shown) — with an overall accuracy of about 75%. The crops could be identified as early as May, allowing for better water planning throughout the growing season.
We have identified two possible improvements. First, MODIS imagery with a pixel resolution of approximately 250 meters contains some mixed pixels that cause inseparability between confounded, parameterized models, making them inherently difficult to classify. These problems can be addressed by higher-resolution imagery containing more pure pixels and using a larger number of samples for supervised training. Second, the maximum-likelihood technique used to parameterize the models for crop-cover types can be modified to improve the classification results, perhaps by making use of neural-network or support-vector machine-type classifiers (Gong et al. 1996; del Frate et al. 2003; Murthy et al. 2003; Pal and Mather 2006).
Satellite imagery can support water planning in the Central Valley

