


All Issues
Management reduces in irrigated pasture runoff
Publication Information
California Agriculture 61(4):159-165. https://doi.org/10.3733/ca.v061n04p159
Published October 01, 2007
PDF | Citation | Permissions
Abstract
Microbial pollutants, some of which can cause illnesses in humans, chronically contaminate many California water bodies. Among numerous sources, runoff from irrigated pastures has been identified as an important regulatory target for improving water quality. This study examined the potential to reduce E. coli contamination from cattle in irrigated pastures. During the 14 irrigation events examined, we found that E. coli concentrations were lowest with a combination of three treatments: filtering runoff through a natural wetland, reducing runoff rates, and letting the pasture rest from grazing at least a week prior to irrigation. Integrated pasture and tailwater management are required to significantly reduce E. coli concentrations in runoff.
Full text
Contamination of surface waters by pathogens — and the associated human health risks — is a leading water-quality issue for California and the nation. Pathogens are the most common impairment to surface waters in California, according to the statewide list of polluted water bodies (Cal EPA 2004). Listed pathogen-impaired water bodies include 103 miles of coastal shorelines, 4,713 acres of estuaries, 688 acres of lakes and reservoirs, and 1,788 miles of rivers and streams.
Pathogens that can cause illness in humans include protozoa such as Cryptosporidium parvum and Giardia duodenalis, as well as bacteria such as Salmonella and Escherichia coli O157:H7, a virulent strain of the commonly found coliform. The sources of these pathogens are diverse; they are shed in the feces of wildlife, humans, livestock and pets found across most watersheds. Pathogen contamination can come from point sources such as discharge from municipal wastewater treatment plants, as well as nonpoint sources such as wildlife (Atwill et al. 2001) and intensive and extensive livestock production systems (Atwill et al. 2003; Lewis et al. 2005).
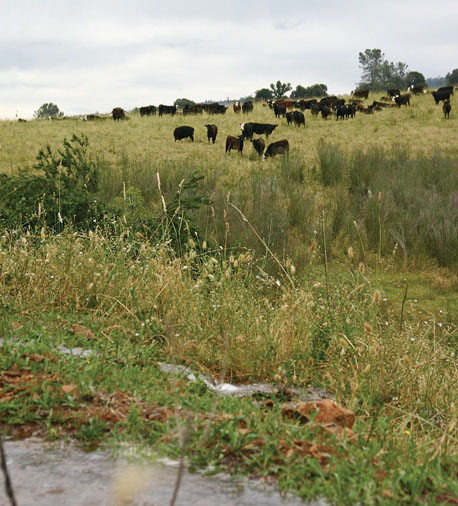
A study at the UC Sierra Foothill Research and Extension Center examined the ability of small wetlands to filter E. coli in runoff from irrigated, grazed pastures. Such disease-causing pathogens pollute waterways across California.
Although pathogens are the underlying concern, most state and federal ambient fresh-water quality standards are based on indicator coliform bacteria. The standards use total or fecal coliforms and/or a subset of this group called Escherichia coli. For fresh waters such as streams and lakes across California, fecal coliform standards range from 20 to 2,000 colony-forming units (cfu) per 100-milliliter (ml) sample, depending on the designated beneficial use of the water body. For full-body-contact beneficial uses such as swimming and bathing, the U.S. Environmental Protection Agency (U.S. EPA) currently recommends an E. coli standard of 126 cfu/100 ml for an average of five samples collected over 30 days, or 235 cfu/100 ml for a single grab sample.
While these standards are based on the assumption that there is a correlation between these indicator bacteria and microbial pathogens of concern, the validity of this assumption likely varies from watershed to watershed as well as seasonally within a given watershed. In addition, we have a generally poor understanding of how indicator bacteria and pathogen concentrations correlate in rural or agriculturally dominated watersheds. Regardless, indicator bacteria are used as regulatory surrogates for pathogens due to their relatively low analysis costs and analytical simplicity compared to most pathogens, which can be expensive and technically difficult to test for on a large scale.
Pathogens from irrigated pastures
Recent regulatory developments in California have focused significant attention on the quality of waters discharged from agricultural production systems, including extensive livestock production on irrigated pastures and nonirrigated rangelands. Irrigated pastures in California maintain an estimated 800,000 acres of green forage throughout the dry summer months, a critical food source for the state's livestock. While flood irrigation is a common and inexpensive way of delivering water to these pastures, this method can generate significant runoff (tailwater) (Bedard-Haughn et al. 2004; Tate et al. 2001).
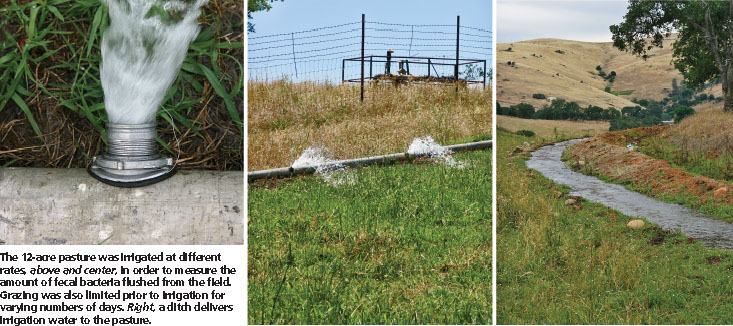
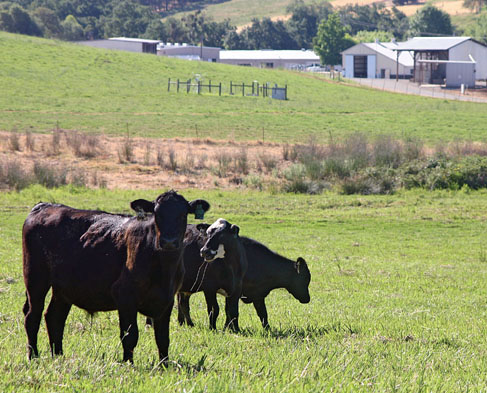
The 12-acre pasture was irrigated at different rates above and center, in order to measure the amount of fecal bacteria flushed from the field. Grazing was also limited prior to irrigation for varying numbers of days. Right, a ditch delivers irrigation water to the pasture.

Fig. 1. (A) Wetland sampling scheme, and (B) range of E. coli concentrations observed at each site (cfu = colony-forming units).
Information is needed on the effectiveness of integrating three approaches to reduce microbial pollutant concentrations in tailwater discharged from pastures: (1) vegetative filters such as wetlands and buffer strips, (2) pasture grazing management and (3) irrigation management. We conducted a management-scale case study on a flood-irrigated pasture and wetland system in the northern Sierra Nevada foothills. Our objective was to examine the reduction in tailwater E. coli concentrations due to: (1) wetland filtration of tailwater, (2) offsetting the timing of livestock grazing and irrigation and (3) the management of irrigation-water application rates.
Study pasture and wetland
The rangeland landscape in the western Sierra Nevada foothills of Northern California is a patchwork of irrigated perennial grass and clover pastures interspersed with annual grasslands and oak woodlands. For this study, E. coli concentrations and instantaneous runoff rates were measured immediately above and below a flow-through wetland receiving irrigated-pasture tailwater at the UC Sierra Foothill Research and Extension Center (SFREC) in Yuba County. Cattle were excluded from the wetland for the duration of the study period, April 2004 through September 2005.
The wetland was on an ephemeral stream channel at the base of a small basin that collects runoff from a 12-acre, flood-irrigated, foothill pasture (fig. 1A). Tailwater runs directly into the ephemeral channel along the base of the irrigated pasture. Tailwater is then transported approximately 150 yards down the channel to the top of the wetland. The only source of flow in the channel during the summer irrigation season is tailwater from this irrigated pasture. Flow from this upstream channel is naturally dispersed throughout the wetland and eventually leaves via another channel at the bottom.
The wetland has a surface area of about 0.5 acre, with a flow path (the length of wetland between inflow and outflow points) of about 135 yards and an average width of 200 yards. The wetland is densely vegetated with dotted smartweed (Polygonum punctatum), water speedwell (Veronica catenata) and rice cutgrass (Leersia oryzoides). Due to regular irrigation events on the pasture, the wetland remains saturated throughout the summer months with standing surface water between irrigation events.
Grazing and irrigation protocols
Pasture irrigation was managed during the 2004 and 2005 summer irrigation seasons to create a range of water-application and tailwater-runoff rates (table 1). This allowed us to investigate the potential to reduce E. coli concentrations in tailwater by reducing the runoff rate, which in turn reduces the erosion of bacteria from cattle fecal pats (hydrologic mobilization) and the flushing of bacteria from the pasture in surface runoff (transport capacity). The timing of pasture grazing by beef cattle was managed to create a range of total days rest between grazing and irrigation of the pasture. This allowed us to characterize the potential reduction of E. coli in tailwater attributable to such processes as the background mortality rate of E. coli, and the drying and heating of fecal pats during the summer season (Li et al. 2005).
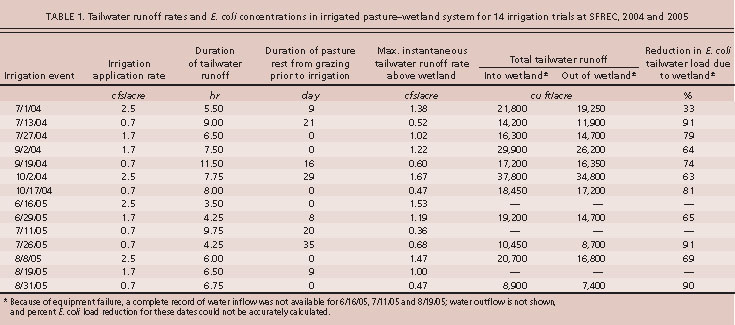
TABLE 1. Tailwater runoff rates and E. coli concentrations in irrigated pasture-wetland system for 14 irrigation trials at SFREC, 2004 and 2005
Grazing
The 12-acre irrigated pasture was fenced as one complete unit and was grazed by beef cattle during the 2004 and 2005 summer irrigation seasons (May through October). Grazing duration ranged from 8 to 16 days per month. The number of cattle ranged from 56 to 102, resulting in mean stocking rates per grazing event of 1.3 to 1.8 animal unit months per acre.
Irrigation
The pasture was irrigated in five discrete sections called sets, and set size ranged from 1 to 4 acres. These sets were irrigated sequentially so that the entire pasture was irrigated over the course of 2 to 3 consecutive days. Irrigation scheduling was such that the entire pasture was irrigated every 9 to 14 days throughout the summer, with the shortest intervals in July when hot temperatures and long days created the greatest plant-soil water demand.
Days of rest
The timing of grazing (once per month for 8 to 16 days) combined with the timing of irrigation (every 9 to 14 days) created a range of days of rest between grazing and irrigation. This resting period ranged from 0 to 35 days (table 1), with 0 days of rest meaning that cattle were present during irrigation. Finally, irrigation application rates of 0.7 (n = 6), 1.7 (n = 4) and 2.5 (n = 4) cubic feet per second (cfs) per acre were applied over the 14 irrigation events to create a range of tailwater runoff rates from 0.36 to 1.67 cfs/acre (table 1).
Tailwater collection
Half of the 14 irrigation events were in summer 2004 and the other half in summer 2005 (table 1). For this study, we focused tailwater monitoring on specific irrigation events in a single irrigation set that was slightly over 1 acre. Thus, we could control for variation in the area of pasture generating runoff between irrigation events, and achieve a relatively broad range of tailwater runoff rates across events. The duration of tailwater runoff per irrigation event ranged from 3.5 to 11.5 hours, and during this time samples were collected at 30- to 60-minute intervals. This allowed for the characterization of E. coli concentrations throughout the entire runoff period for each irrigation event.
Measuring E. coli.Samples were collected within the stream channel immediately above and below the wetland using ISCO 6700 autosamplers (ISCO, Lincoln, Neb.). This allowed the quantification of input-output E. coli concentrations and loads to evaluate the effectiveness of wetland filtration. Flow rates were continuously recorded every 15 minutes using a 1-foot, 90° V-notch weir with an automatic depth recorder (Metritape Type AGS, Metritape, Littleton, Mass.). This allowed us to examine the effect of tailwater runoff rate on E. coli concentration. E. coli concentration (cfu/100 ml) was determined within 24 hours of sample collection by direct membrane filtration and then culture of the membrane onto CHROMagar EC (Chromagar Microbiology, Paris, France) at 112.1 °F (44.5 °C) for 24 hours.
Hydraulic residence times
Hydraulic residence time, which is generally an estimate of how long water takes to pass through a wetland, can be a major factor influencing the efficiency of the wetland to retain pollutants (Blahnik and Day 2000). Longer residence times, often associated with lower runoff rates, generally result in greater retention of pollutants (Knight et al. 2000). Determining the hydraulic residence time for a study wetland allows extrapolation of the results to other wetland systems.

Runoff below the wetland had significantly lower E. coli concentrations; nonetheless, 95% of the samples collected still did not meet federal standards for E. coli.
To quantify hydraulic residence times, continuous bromide injections were conducted at irrigation application rates of 0.7, 1.7 and 2.5 cfs/acre. Bromide is considered a conservative tracer of water movement through space and time because it is not utilized by plants or microorganisms, and is not readily bound to soil particles. A solution of known bromide concentration was injected at a known rate (20 to 25 milliliters per minute) into the center of the stream above the wetland, using a fluid-metering pump. During injections, water samples were collected at short intervals (3 to 20 minutes) to capture the entire runoff period both above and below the wetland. Bromide concentrations were quantified using ion chromatography. The hydraulic residence time was calculated using the time it took for half of the bromide to pass from above to below the wetland (Webster and Ehrman 1996). More than 95% of the bromide injected was recovered below the wetland for all three irrigation events.
Data analysis
We used linear mixed effects regression to simultaneously examine the reduction in E. coli concentration by the wetland, as well as the relationships between E. coli concentration and instantaneous tailwater runoff rate (cfs/acre) above and below the wetland, days of rest from grazing prior to irrigation, and time of sample collection relative to the arrival of tail-water at a sample location (for more detailed methodology, see Tate, Lancaster et al. 2005, and Tate, Lyle et al. 2005). The dependent variable was E. coli concentration (cfu/100 ml) in water samples (n = 364) collected throughout 14 irrigation events from sample locations immediately above and below the wetland. E. coli concentration was log10 transformed. Independent or fixed effect variables in the model were sample location (above or below the wetland), tailwater runoff rate (cfs/acre), duration of rest from grazing prior to irrigation (days), and time since the arrival of tail-water runoff at each sample location for each sample collected (hours) for each irrigation event.
To assess whether wetland efficiency was dependent upon instantaneous tailwater flow rate, we included an interaction between sampling location (above versus below) and instantaneous tailwater runoff rate at the sample location. The quadratic term for days of rest from grazing was included to account for the possibility that the relationship between rest period and E. coli concentration was not linear. A backward-stepwise approach was followed to identify significant (P < 0.05) factors associated with E. coli concentrations. Year (2004 or 2005) was treated as a random effect variable to adjust the results for possible differences between years.
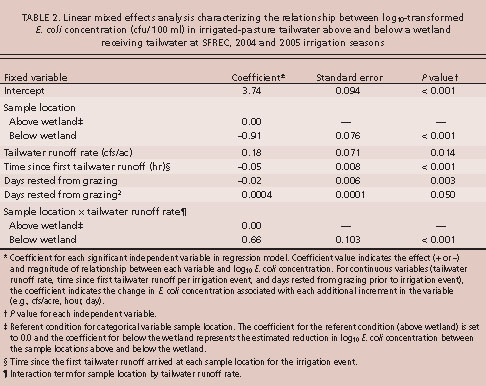
TABLE 2. Linear mixed effects analysis characterizing the relationship between log10-transformed E. coli concentration (cfu/100 ml) in irrigated-pasture tailwater above and below a wetland receiving tailwater at SFREC, 2004 and 2005 irrigation seasons
Effects on E. coli concentrations
Wetland filtration
E. coli concentrations were reduced below the wetland compared to above the wetland (table 2; fig. 2). For example, at an instantaneous tailwater flow-rate of 1.0 cfs and following 7 days of pasture rest from grazing, the final analysis found that the wetland decreased E. coli concentrations in tailwater by about 40% (fig. 3A).
E. coli concentrations in pasture runoff above the wetland were never below the 235 cfu/100 ml standard recommended by the U.S. EPA for any of the samples (n = 182) collected during the 14 irrigation events, ranging from 420 cfu/100 ml to 157,800 cfu/100 ml, with a median of 5,400 cfu/100 ml (see fig. 1B, page 160). In contrast, overall E. coli concentrations below the wetland (filtered pasture runoff and wetland runoff) were significantly lower than those above the wetland (pasture runoff). Specifically, E. coli concentrations below the wetland ranged from 10 to 74,600 cfu/100 ml, with a median of 1,283 cfu/100 ml. However, in spite of the more than four-fold decrease in median E. coli concentrations by the wetland, only 6% of the 182 samples collected below the wetland met the U.S. EPA standard.

Fig. 2. E. coli concentration and tailwater profiles above and below the study wetland for a typical (A) high- and (B) low-flow irrigation event.
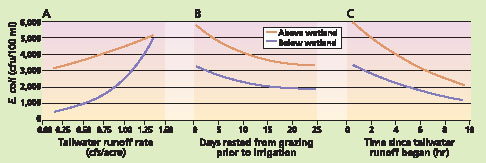
Fig. 3. Predicted E. coli concentrations in pasture tailwater above and below the wetland as (A) tailwater runoff rate increases (time since first runoff 3 hours, days since grazing 7 days); (B) days rested from cattle grazing prior to irrigation increases (time since first runoff 3 hours, tailwater runoff rate 1 cfs); (C) time since tailwater runoff begins during an irrigation event (days since grazing 7 days, tailwater runoff rate 1 cfs).
Although the primary regulatory concern with E. coli centers on concentration, it is also important to consider the reduction in E. coli load (the total number of E. coli entering and exiting the wetland) per irrigation event. We calculated the percentage of total number (cfu) of E. coli retained within the wetland during each event from the difference between inflow and outflow load, and found that percent reduction ranged from 33% to 91%, with an average of 73% (table 1). These results are comparable to previous findings that relatively narrow (1 to 2 yards wide) vegetative buffer strips can reduce E. coli and C. parvum in runoff by as much as 90% to 99% on California's annual grasslands under rainfall-runoff conditions (Atwill et al. 2002, 2006; Tate et al. 2004, 2006). Reductions of 80% to 99% have been seen for E. coli and fecal coliforms with the use of constructed surface-flow wetlands to treat municipal and livestock wastewater (Gerba et al. 1999; Hill 2003; Quinonez-Diaz et al. 2001).

Top left, channelized runoff from the pasture was collected in a small basin. Above, V-weirs were fitted with, left, autosamplers to monitor E. coli concentrations.
Wetlands can reduce E. coli runoff from irrigated pastures, but their use should be integrated with management strategies such as timing grazing prior to irrigation and minimizing the volume of irrigation tailwater.
Tailwater runoff rate
As irrigation tailwater runoff rates increased, E. coli concentrations increased both above and below the wetland (figs. 2 and 3A); for example, figure 2 shows the increased E. coli concentrations profile for an irrigation event with a peak instantaneous pasture runoff rate of 1.53 cfs/acre compared to an event with a rate of 0.47 cfs/acre. This relationship can be attributed to the fact that higher runoff rates increase the tailwater's capacity for pollutant mobilization and transport. In other studies, we have found that runoff rate is positively correlated with the load of E. coli and C. parvum discharged from cattle fecal deposits on annual grasslands under rainfall-runoff conditions (Atwill et al. 2002; Tate et al. 2004, 2006).
As the tailwater runoff rate increased, the wetland was less effective at filtering E. coli and reducing concentrations in tailwater (fig. 3A). Essentially, at high runoff rates, the filtration capacity of the wetland becomes overwhelmed by the mobilization and transport capacity of the tailwater. The increase in instantaneous tailwater runoff rate corresponded with a decrease in hydraulic residence time, which also likely reduced the amount of time for wetland processes that reduce E. coli concentrations, such as exposure to solar ultraviolet radiation and predation by other microbes.
In this wetland, the hydraulic residence time varied from 38 minutes at an irrigation-water application rate of 2.5 cfs/acre to over 120 minutes at 0.7 cfs/acre; these application rates resulted in maximum instantaneous pasture runoff rates of 1.53 and 0.47 cfs/acre, respectively. These relatively short hydraulic residence times, in conjunction with the relatively low retention of total runoff volume (table 1), indicate that the majority of tailwater runoff contributed to the wetland during an irrigation event passed through that wetland during the same event. From total water inflow and outflow volume data (table 1), we can calculate that water retention in the wetland over these irrigation events ranged from 5% to 23%, with the wetland retaining an average of 13% of the water contributed per event.
Soils at the study site were formed over greenstone with a rocky clay B-horizon at a depth of about 1 foot, and an impervious, dense clay C-horizon at a depth of about 3 feet. There is not much storage volume in the soil profile below this wetland, so that any significant water loss to vertical seepage would have to come from losses through fractured bed material. Instead, we suspect that most water retained in the wetland was lost to subsurface flows through channel substrates and lateral subsurface flow from the wetland to the surrounding soil profile. In general, we have observed that the major hydrologic transport pathways in the study site soils are significant lateral flow on top of the B-horizon and through macro-pores such as rodent tunnels, root tunnels and soil cracks.
Grazing
E. coli concentrations in tail-water directly from the pasture (above the wetland) were highest when cattle were actively grazing during an irrigation event with high tailwater runoff rates. E. coli concentrations in tailwater were significantly reduced with increasing rest time between grazing and irrigation (table 2, fig. 3B). However, the relationship was not linear, and E. coli reductions became smaller with each additional day of rest. For example, the E. coli concentration was 23% lower after 9 days of rest than after 1 day of rest, but only 2% lower after each additional day of rest. This reduction was likely due to two primary processes: (1) as cattle fecal pats age, the microbial pollutants in them naturally die off (Li et al. 2005; Meays et al. 2005), and (2) as the pats dry, they develop shells that trap the bacteria inside.
Irrigation events
Over the course of an irrigation event, E. coli concentrations initially spiked but then declined (figs. 2 and 3C). This pattern is likely due to two primary processes: (1) as the irrigation event progresses, the tailwater volume increases and dilutes the E. coli, and (2) as the first irrigation water flows, it flushes the readily mobilized and transportable bacteria from the pasture.
This result shows the importance of collecting multiple samples during an irrigation event to accurately characterize E. coli concentrations. In addition, a single sample near the end of the event will be much more likely to achieve water-quality standards than a single sample collected early in the event.
Attaining water-quality standards
Results from this study indicate that passing tailwater through relatively small wetlands can significantly reduce E. coli from irrigated pastures. As with any management measure, the feasibility and costs of creating a wetland will be site-specific. However, wetlands reduce E. coli concentrations less efficiently as the tailwater runoff rate increases. In addition, the concentration of E. coli in pasture runoff increases with the tailwater runoff rate. Collectively, these results indicate that the implementation of a wetland filter to reduce pathogens should be integrated with irrigation management designed to minimize tailwater runoff rates and volume. Simply implementing a wetland filter under conditions of high tailwater runoff rates may not lead to significant reductions in E. coli concentrations discharged from irrigated pastures (fig. 3A). This study also indicates that allowing several days of rest from grazing prior to irrigation can significantly reduce E. coli in pasture runoff.
We found that the combination of a wetland filter, low tailwater runoff rates, and at least 1 week of rest from grazing prior to irrigation generated the lowest E. coli concentrations. Nonetheless, 94% of the 182 samples collected below the wetland during 14 irrigation events were above the U.S. EPA recommended level of 235 cfu/100 ml. (California water quality is now regulated by nine regional boards with differing standards; these standards also differ from the federal recommendations [ see p. 156 ].) Under the grazing and irrigation conditions of this study, we also found that up to 91% of the total E. coli load discharged from the pasture was filtered by the wetland, with 73% filtered on average per irrigation event. It is critical to fully explore opportunities to further reduce tailwater runoff rates and subsequent E. coli generation from irrigated pastures, allowing wetlands to serve as efficiently as possible.
Finally, it is important to note that the standard E. coli test is used to identify indicator bacteria rather than a specific pathogen of concern. We have found E. coli concentrations in beef cattle feces on irrigated pastures to be as high as 500,000 to 1,000,000 cfu per gram of wet feces. It is therefore not uncommon to find relatively high E. coli concentrations in pasture tailwater, particularly when the feces are fresh and tailwater runoff rates are high.
The critical questions that must be addressed focus on the load and concentrations of actual pathogens in tail-water, and the efficiency of integrated wetland, irrigation and grazing management to reduce the pathogens that may be discharged from pastures during irrigation events. For instance, in California's beef cattle herds, C. parvum oocysts (eggs) are primarily shed in high concentrations in the feces of beef calves 1 to 4 months old, with very low shedding rates for adult cattle (Atwill et al. 1999, 2003). In contrast, E. coli indicator bacteria are consistently shed in all ages of cattle feces at high rates year-round. A grazed pasture might discharge high concentrations of indicator bacteria, but low or zero concentrations of the pathogen C. parvum.
Without such information on all pathogens of concern, it is possible that regulation based upon indicator bacteria alone will lead to unnecessary management restrictions. Alternatively, if indicator bacteria are poorly correlated with certain pathogens, it is also possible that regulation based solely upon indicator bacteria will lead to a false sense of human health protection. This suggests that water-quality monitoring and standards should target specific microbial pathogens of concern.
Management reduces in irrigated pasture runoff

