


All Issues
California cotton growers utilize integrated pest management
Publication Information
California Agriculture 61(1):24-30. https://doi.org/10.3733/ca.v061n01p24
Published January 01, 2007
PDF | Citation | Permissions
NALT Keywords
Abstract
In 2000, the UC Statewide Integrated Pest Management Program (UC IPM) conducted a comprehensive survey of pest management decision-making and pest control practices of cotton growers in the 11 major cotton-producing counties of California. The results indicate progress in growers' knowledge and implementation of IPM principles and techniques, although the use of certain aspects, such as treatment thresholds for insects, often fell short of researchers' recommendations. The survey also confirmed the central role of pest control advisers (PCAs) in IPM decision-making. Although independent PCAs communicate more with growers than do PCAs who are affiliated with product suppliers, PCA affiliation did not affect most on-the-ground pest treatment actions measured by this survey. The results indicate a need to expand IPM adoption surveys to include PCAs and to develop more effective ways of measuring IPM decision-making beyond counting the techniques used or not used.
Full text
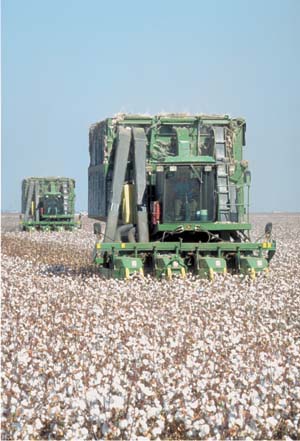
A cotton harvest
The adoption of integrated pest management (IPM) practices in agriculture has been a goal of federal and state programs since the 1970s and was emphasized by the Clinton administration's target of IPM implementation on 75% of the nation's crop acreage by 2000. The UC Statewide Integrated Pest Management Program (UC IPM 2006) defines IPM as:
“an ecosystem-based strategy that focuses on long-term prevention of pests or their damage through a combination of techniques such as biological control, habitat manipulation, modification of cultural practices and use of resistant varieties. Pesticides are used only after monitoring indicates they are needed according to established guidelines, and treatments are made with the goal of removing only the target organism. Pest control materials are selected and applied in a manner that minimizes risks to human health, beneficial and nontarget organisms, and the environment.”
Despite these goals, a recent review of U.S. agriculture by the federal government criticized the lack of progress (GAO 2001). According to this review, while the U.S. Department of Agriculture (USDA) had reported that IPM was being practiced on approximately 70% of U.S. farmland by 2000, much of this perceived progress could be attributed to rudimentary monitoring and prevention practices. More significant practices, such as biologically based pest control methods, had been adopted on as little as 3% and up to 47% of cropland, depending on the crop.
UC IPM was established in 1979 to develop and promote the use of IPM throughout California. The program uses federal Smith-Lever 3(d) funding for IPM extension and outreach, and therefore is required by the Government Results and Performance Act of 1993 to establish methods for reporting program accountability and performance. To meet the requirements of this legislation, the national IPM program requested that UC IPM develop baseline measurements of IPM usage so that future progress could be measured.
Beyond collecting data for reporting purposes, information about IPM adoption will help to address growing public concern about the implications of pesticide use on the environment and human health, and the increasing consumer demand for lower-risk pesticides on food and fiber crops. These demands can only be met by improving our understanding of growers' pest management decision-making processes. With this understanding, we will be better able to direct extension efforts to promote the inclusion of rational decision-making in the choice of pesticides, the increased use of reduced-risk pesticides, and the greater acceptance of biologically intensive practices by growers.
Establishing baseline IPM usage
UC IPM selected two cropping systems in California to begin establishing baseline IPM usage data and examine growers' decision-making criteria. Almonds (Brodt et al. 2005) and cotton were chosen because of their extensive acreage, use of certain high-risk pesticides and long history of UC IPM efforts in promoting IPM. This article reports on results from the cotton survey conducted in 2000 and highlights selected results from the almond survey for comparison. The purpose of both surveys was to assess pest management strategies used by growers; pest management decision-making, including knowledge sources for IPM; and grower familiarity with and attitudes about IPM, as well as other general farm characteristics.

Cotton flower
For the cotton survey, growers were randomly sampled from agricultural commissioners' lists taken from 11 counties in the three major cotton-growing regions of California — the San Joaquin Valley (Fresno, Kern, Kings, Madera, Merced and Tulare counties), Sacramento Valley (Colusa, Glenn and Sutter counties) and southern desert (Imperial and Riverside counties). A prescreening process reduced the initial sample of 1,009 growers to a usable sample of 845 eligible growers. To keep the questionnaire at a reasonable length, this sample was split in half. One half of the sample received a questionnaire that included questions about insect and mite management, and the other half received one with questions about disease, nema-tode and weed management.
Questions pertaining to decision-making, information sources, attitudes toward IPM and demographic characteristics were identical in both versions. All questions pertained to the 1999–2000 growing season.
The protocol used to implement the mail survey was based on the Total Design Method (Dillman 1978, (2000). This approach included a personalized presurvey letter, a questionnaire mailing, a follow-up postcard and a second questionnaire mailing to nonrespondents. An incentive gift, a pocket guide to natural enemies in cotton (Knutson and Ruberson 1996), was enclosed in the first mailing of the questionnaire to all respondents.
A 32% survey completion rate resulted in a final sample size of 266 growers across the three regions (238 from the San Joaquin Valley, nine from the Sacramento Valley, 18 from the southern desert and one for which the region was not identified). Of these 266 growers, 120 completed the insect and mite management version of the questionnaire, and 145 completed the disease, nematode and weed management version. The margin of error is +/-5.5% at the 95% confidence level.
Mean acreage planted to cotton in 2000 for the entire sample was 1,026 acres, with a standard deviation of 1,945 acres and a range from 14 to 17,000 acres. Respondents represented approximately 29% of the total cotton acreage in the selected regions in 2000.
We used nonparametric statistical tests to analyze the survey data because in some instances the groups being compared had different variances, and in many cases the variables being analyzed were categorical (such as “yes“, “no” and “don't know” responses to questions about the use of a practice). We used the Kruskal-Wallis test to assess differences in values of a continuous variable among two or more groups. We used the chi-square statistic to assess differences between two or more groups when categorical variables were involved. Finally, we used Fisher's exact test in cases where the sample size was too small to allow appropriate use of the chi-square statistic.
Common pests and IPM knowledge
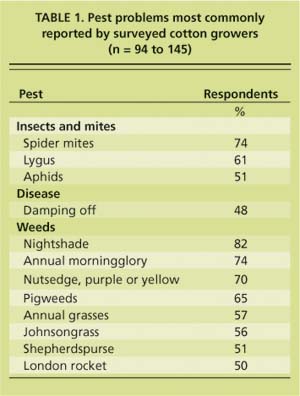
Growers were asked to identify whether a given pest was a problem during the 1999–2000 growing season, based on whether they thought it would have caused economic damage to the cotton crop if no control measures were taken. The pest problems experienced by the most respondents included spider mites, Lygus, aphids and damping off (disease-related seeding death). Weeds mentioned included nightshade, annual morningglory, purple and yellow nutsedge, pigweeds, annual grasses and johnsongrass (table 1). This list is similar to one compiled 30 years ago, with five of these nine weeds appearing on both lists (Keeley et al. 1975).
About 14% of respondents indicated that they had never heard of IPM. But among those who had heard of IPM, more than one-third (36%) rated themselves as moderately knowledgeable about IPM and 39% as somewhat knowledgeable. Fewer than one in five (17%) rated themselves as very knowledgeable about IPM. The most common information sources from which growers first learned about IPM were consultants or pest control advisers (PCAs) (26%), UC farm advisors or specialists (19%), UC publications (11%) and trade publications (11%).
Insect and mite management
Monitoring
Careful monitoring of pest populations, especially insect and mite pests, is one of the most important decision-making tools for the IPM practitioner. The survey asked questions about sampling and evaluation techniques available from UC IPM sources for cotton, including the cotton IPM manual (Ohlendorf et al. 1996) and pest management guidelines (Ohlendorf 2005). The vast majority of responding growers who were asked about insect and mite management reported some form of monitoring of Lygus (88%), spider mites (87%) and aphids (90%), mostly via leaf and fruit inspections and/or sweep nets. This figure is roughly comparable to data from a 1996 survey, which found that scouting for insects occurred on 88% of planted cotton acreage nationwide (Fernandez-Cornejo and Jans 1999).
Lygus treatment thresholds
Understanding and following appropriate treatment thresholds is another important aspect of IPM decision-making. Lygus bugs are key pests in cotton and are insidious in their damage. Adults can quickly move into a field and feed on developing flower buds or squares. Since squares are naturally shed as the plant matures, it is important to understand the relationship between plant development, expected square retention and Lygus densities, as presented in the UC pest management guidelines and cotton IPM manual.
In this survey, 66% of respondents reported that they make early-season treatment decisions when the number of Lygus bugs per 50 sweeps exceeds 10, and 47% reported making late-season treatment decisions on the same basis. In contrast, about half (53%) based decisions on fruit retention or loss, and one-fifth (20%) used square damage, insect numbers and UC guidelines for interpreting these numbers. The limited adoption of the complete approach may be related to the time commitment of collecting data and the complexity of interpreting the results.
Spider mite treatment thresholds
Spider mites are small arthropods that are difficult to count and easy to miss. UC IPM supported the development of a presence/absence sampling methodology that was easy to learn and use, and that standardized mite data for the first time (Ohlendorf et al. 1996). Results were presented as percentage of infested leaves in a field. When asked at what level of mite infestation they treat, 51% of growers preferred to treat when fewer than 30% of leaves were infested, suggesting a more conservative approach than is warranted by research on economic injury by spider mites (Wilson 1985). This conservative approach may be a form of risk aversion in response to an absence of effective control measures after plants reach full size. However, regardless of the infestation used to trigger a treatment, the use of presence/absence sampling was almost universal among the respondents.
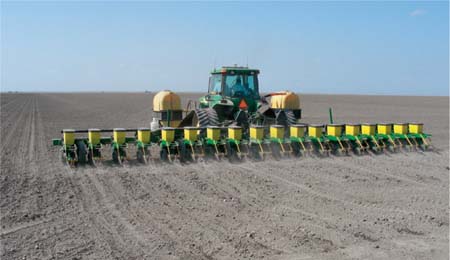
Integrated pest management is a strategy for controlling crop pests that combines a range of environmentally beneficial and economically sound techniques. In cotton, this may include choosing herbicide-tolerant varieties or adjusting planting times to maximize plant emergence and vigor.
Aphid treatment thresholds
A similar pattern holds for midseason aphid control, although the thresholds developed from research are currently less certain than for spider mites. Most responding growers (80%) reported treating at fewer than 50 aphids per leaf, while research suggests that an economic threshold occurs between 50 and 100 per leaf (Godfrey and Leser 1999). The challenge to growers, however, is to reduce the aphid population adequately before bolls are open and lint is exposed to insect honeydew, at which time an economic threshold is thought to occur at as few as five to 15 aphids per leaf. After lint is exposed, 71% of respondents treated at 10 to 15 aphids or fewer. “Don't know” responses for all questions referenced in this paragraph ranged from zero to 10 (9% of responses).
Insecticide use
In spite of these conservative treatment triggers, insecticide use in cotton has declined when measured by the number of treatments per acre (number of acres treated divided by total acres planted), from nine in 1995 to three treatments per acre in 2000, where that level has remained (Goodell et al. 2006).
This change may be associated with growers' increasing confidence about their understanding of IPM in cotton. For example, when comparing the use of spider mite treatment thresholds with self-rated knowledge of IPM, 80% of growers using the higher threshold of 30% to 50% of leaves infested also rated themselves as very knowledgeable about IPM generally, compared to only 20% of those using 30% of leaves infested, and 14% of those using less than 30% of leaves infested (chi-square P = 0.07). There was no significant difference between those using different thresholds for aphids, possibly due to the lesser certainty about what those economic thresholds should be.
Weed monitoring and management
The majority of responding growers who were asked about weed management did not use the more-complex weed management methods oriented toward monitoring and record-keeping. For example, most did not keep records of weed species locations using paper or GPS-generated maps (82% and 96%, respectively, answered “no” to these questions). Furthermore, 63% reported that they did not monitor weeds in untreated areas to detect weed abundance and diversity, and all respondents reported that they did not sample the soil to monitor weed seed abundance and diversity.
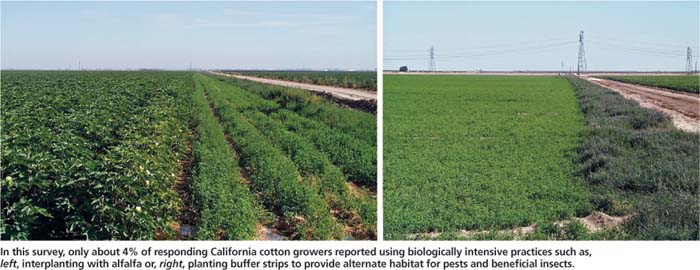
In this survey, only about 4% of responding California cotton growers reported using biologically intensive practices such as, left, interplanting with alfalfa or, right, planting buffer strips to provide alternate habitat for pests and beneficial insects.
However, many growers did indicate that they understood the importance of selecting herbicides based on their ability to target the specific weeds present in their fields. A large majority (94%) reported selecting herbicides based on weed species location and density, suggesting that they did monitor more informally and were aware of which species occur in which areas. This suggestion is further supported by a 1996 survey, which found that 72% of cotton acreage nationwide is scouted for weeds, even though mapping occurs on only 5% of acreage where just preemergent herbicide is used (and where mapping is most needed) (Fernandez-Cornejo and Jans 1999).
Of the responding sample, 68% also considered an herbicide's ability to target specific weeds as a very important factor in choosing a selective herbicide; 84% considered efficacy a very important factor; and 57% valued reduction of the amount of herbicide applied as an important factor. Moreover, more than half (56%) of growers responded that they rotated herbicides to prevent resistance, an important tactic in the face of the increasing incidence of herbicide resistance among weeds.
An integral part of weed management is cultivation, and all responding growers said that they cultivate after cotton emergence and before layby (the period of time after which tractors cannot enter the field due to plant height). In addition, although growers have a number of herbicide options as well as herbicide-tolerant cotton varieties, 73% still hoe by hand for broadleaf weeds and grasses, while 63% hand-pull, rouge or physically remove weeds from the field. On the other hand, most respondents also reported using combinations of chemical (94%) and mechanical weed control (88%) in areas adjacent to fields, with 83% of all 145 respondents indicating use of both strategies.
The planting of genetically modified cotton varieties to facilitate the use of herbicides was relatively common, with 57% of respondents planting glyphosate-resistant (Roundup Ready) varieties and 30% planting varieties tolerant of the herbicide bromoxynil (Buctril; BXN). On the other hand, the increase in planting of glyphosate-resistant cotton has not brought the anticipated decrease in use of preplant-incorporated herbicides such as trifluralin (Treflan) and pendimethalin (Prowl), which 91% of growers still reported using (including 91% of growers planting glyphosate-resistant cotton). “Don't know” responses ranged from zero to seven individuals (5%) for all questions on weed monitoring and control practices.
Grower reliance on PCAs
PCAs play a key role in implementing IPM in California. Creating a successful IPM program requires close association and trust between the field scout, PCA and grower. In rare cases, the same individual might have more than one of these roles; but more commonly, field scouts collect data and PCAs interpret the data to create information for the grower to make pest management decisions.
The reliance on PCAs for pest management advice was almost universal among the survey respondents, with 99% using one or more PCAs. This finding is consistent with the use of PCAs in almonds (Brodt et al. 2005). However, cotton growers used more PCAs per grower than did almond growers; only half (49%) reported using only one PCA (compared to 73% in almonds), while 30% used two (21% in almonds), and 20% used three or more (3% in almonds). The reasons for having more than one PCA visiting a farm may include an increased level of surveillance, the ability to contrast different scouting reports, the specific expertise of different PCAs, and various suppliers competing for business and dividing the fields among PCAs. The difference between almond and cotton farmers in the number of different PCAs visiting is not documented, but it might be related to farm size, the shifting of cotton into different fields annually and crop rotational issues.
The degree of PCA influence on decision-making varies with different pest types. When cotton growers who used PCAs were asked what percentage of the time they follow their primary PCA's recommendations, they reported a mean of 88% of the time for insect and mite pest-management actions (standard deviation = 17%) and 74% of the time for disease management (standard deviation = 35%). For weed management, the mean was 70% (standard deviation = 30%). On the other hand, for nematode management, the mean was only 61% of the time, with a large standard deviation of 45%. Relatively few growers (13%) reported having had nematode problems in the previous 3 years (with an additional 11% unsure), so the result for nematodes is not surprising.
Many of the differences in reliance on the PCA are probably due to the fact that insect and mite management in cotton typically involves more frequent monitoring and continual decision-making over a longer period of time than do disease and weed management. In addition, decision-making must often take into account factors such as treatment thresholds, treatment timings, variable weather conditions, and the balance of pest and beneficial insect populations. These are all factors for which expert input can make a substantial difference in controlling efficacy and cost (Brodt et al. 2005).
On the other hand, decision-making for disease and weed management tends to be concentrated in brief, critical intervals during which longterm decisions are made. In addition, many of these decisions are related to basic cultural practices (for example, the selection of resistant varieties, cultivation and crop rotation), with which growers may feel more confident and less in need of PCA advice. The figures for cotton and almonds were similar for insect and disease recommendations (88% vs. 80% and 74% vs. 78%, respectively), while the percentage following weed recommendations was higher for cotton than for almonds (70% vs. 28%), reflecting the annual versus permanent nature of the cropping systems.
Supplier vs. independent PCAs
IPM is information-intensive in order to decrease risk with increased data. Gathering data by using reliable methodology is only the first step. Communicating and interpreting those field observations in a useful manner is an essential part of the IPM process. This process is conducted by PCAs, who may be independently employed, employed through supplier affiliation or employed in-house by the farm. PCA affiliation is important in an IPM survey because of the perceived bias that can be introduced when those providing advice are also the same people who supply the commercial products.

In this survey, more than half (60%) of responding growers who used a PCA worked most closely with a PCA affiliated with an agricultural products supplier, while one-third (33%) worked with an independent PCA as their primary PCA. An additional 6% reported having an in-house or employee PCA as the primary PCA. These figures closely resemble the results for almonds (Brodt et al. 2005), despite the differences in crop and pest management practices.
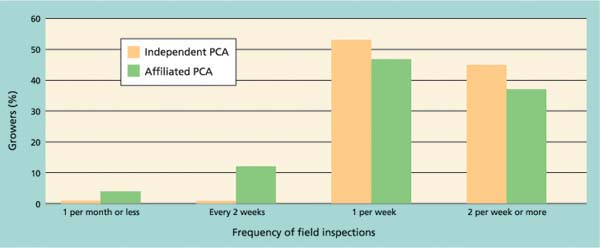
Growers who reported consulting an independent PCA as their primary PCA also reported a significantly greater tendency to follow the PCA's recommendations for insect/mite and disease management (Kruskal-Wallis P = 0.02 and P = 0.03, respectively) than did those who primarily used a supplier-affiliated PCA. The growers with independent PCAs also indicated that their PCAs made more frequent field inspections; 98% of those with independent PCAs reported inspections once a week or more frequently during the growing season, while only 84% of those with affiliated PCAs reported this frequency (chi-square P = 0.005) (fig. 1). Growers with independent PCAs were also more likely to receive more frequent verbal reports, with 46% receiving reports twice a week or more, compared to 31% of growers with affiliated PCAs (chi-square P = 0.01) (fig. 2).
Both groups of growers received about the same frequency of written status reports, with 57% of growers with independent PCAs receiving reports once a week, compared to 59% of growers with affiliated PCAs. This frequency was similar for independent PCAs in almonds. However, there was a substantially higher frequency of written reports by affiliated PCAs in cotton than in almonds; for almonds, only 8% reported receiving reports at least weekly. The higher frequency of visits and reporting in cotton than in almonds perhaps reflects the rapidly changing nature of annual field crops compared to perennial tree crops.
Growers with smaller acreage were significantly less likely to use independent PCAs than those with larger acreage. Among our respondents, growers with independent PCAs as their primary PCAs had a mean of 1,129 cotton acres, while growers with supplier-affiliated PCAs had a mean of 667 cotton acres. Those with in-house PCAs had an even larger mean of 4,309 acres (Kruskal-Wallis P = 0.0002). This difference might be explained by the economies of scale afforded to PCAs by larger farms. The practice of compensating independent PCAs on a per-acre basis is a disincentive to the PCAs to accept contracts on small farms, where the compensation is small relative to the fixed costs associated with traveling to and from the fields on a regular basis.
Growers using independent PCAs were more likely to consider themselves very knowledgeable about IPM (75%), compared with growers using affiliated PCAs (25%, chi-square P = 0.04).
PCA affiliation and pest management
The PCA's affiliation had no influence on growers' tendency to use particular insect and mite monitoring practices or insecticide-related treatment practices, with the exception that growers using independent PCAs were more likely to report the use of sweep nets for aphid and spider mite monitoring. For aphids and spider mites, 72% and 48%, respectively, of growers with independent PCAs reported use of sweep nets, while only 46% and 25% of growers with affiliated PCAs reported using them (Fisher's exact test P = 0.01 for aphids and P = 0.05 for mites).
PCA affiliation also did not influence herbicide use for weed control, with the exception that 97% of growers with independent PCAs used banded applications, compared to 82% of those with affiliated PCAs (chi-square P = 0.02). Glyphosate-resistant (Roundup Ready) varieties were planted by more growers with independent PCAs (72%) than by those with affiliated PCAs (50%; Fisher's exact test P = 0.006). Bromoxynil-tolerant (Buctril, BXN) varieties were also planted by more growers with independent PCAs (49% of those with independent PCAs vs. 21% of those with affiliated PCAs; Fisher's exact test P = 0.004). On the other hand, no respondents with independent PCAs used light-activated sprayers, compared to 8% (only 10 individuals) of those using affiliated PCAs (Fisher's exact test P = 0.08).
Most cultural weed control practices were also used by similar percentages of growers with the two different types of PCAs. The only exceptions were three practices that had either quite low or quite high rates of use overall. Only six growers reported the release of weevils for puncturevine control (a biological control), but three were growers with independent PCAs, two had in-house PCAs (employed directly by the grower), and only one had an affiliated PCA (Fisher's exact test P = 0.02).
Keeping records of weed species locations on a paper map (GPS-based recording systems were not widely available in 1999) was reported by only 24 growers overall, but this figure included 26% of all respondents with independent PCAs compared to only 11% of respondents with affiliated PCAs, and 57% of respondents with in-house PCAs (Fisher's exact test P = 0.02). These responses suggest that either in-house PCAs have the most time to pursue the more intensive monitoring and control practices, or alternatively, growers with in-house and independent PCAs are more committed to pursuing these types of practices. Finally, only seven individuals reported not using chemical control of weeds in areas adjacent to cotton fields to manage external sources of Lygus, but all seven were growers with affiliated PCAs (Fisher's exact test P = 0.08).
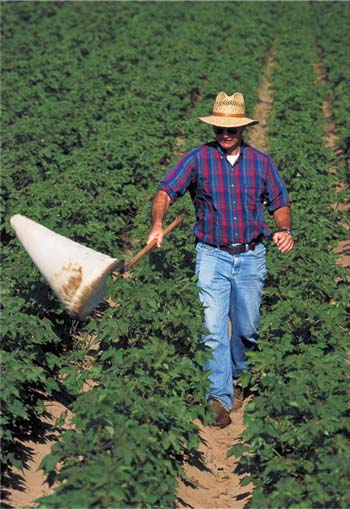
Pete Goodell of the UC Statewide IPM Program uses a sweep net to monitor insect populations in a cotton field.
These results in PCA and grower interactions were similar to those reported for almonds, including that farmers who use independent PCAs reported being more knowledgeable in IPM, had larger farms, followed a PCA's recommendation for arthropod and disease management recommendations, and received more frequent field visits and verbal communications. One contrast between the cropping systems was in growers' use of biologically intensive IPM practices based on PCA affiliation. In almonds, growers who used independent PCAs were more likely to use biological and cultural practices in their IPM program. In cotton, this difference was not noted (table 2) except for “Manage the crop for early termination to avoid late whitefly/aphid” (chi-square P = 0.08).
Insights for further research
The degree of knowledge about the details of IPM, as shown by farmers in this study, indicates definite success in moving IPM onto farms, especially in the areas of monitoring and decision-making. However, one drawback with this type of mail survey is the inability to distinguish a multidimensional understanding of an agroecosystem — what we might call an “IPM mindset” — from the piecemeal adoption of individual practices.

TABLE 2. Percentage of responding cotton growers who used various biologically intensive practices, based on affiliation of pest control advisers (PCAs)
Investigating this distinction would require a more in-depth and integrated survey or interview process to ascertain whether growers are purposely integrating different pest control strategies and doing so only when they have reached recommended decision criteria, including economic pest thresholds. Such a research project should also obtain objective measures of actual pest pressure faced by growers in any given season. Only then will it be possible to distinguish growers who have yet to try alternative biological practices from those who no longer need to use them because they have managed their system for overall health.
Surveys of pest management practices should also move beyond growers as the primary target. In California, PCAs are recognized as among the most important disseminators of IPM information, especially concerning sampling and the interpretation of pest and natural enemy densities. The role of PCAs in spreading IPM is suggested by our finding of more extensive adoption of IPM practices (such as choosing more selective chemicals, rotating chemicals and pest monitoring) in arthropod control, where growers indicate that PCAs have more influence, than in weed control. Although the present study contributes to our understanding of the importance of PCAs in grower decision-making, it cannot answer questions about PCA perspectives on IPM and whether they themselves have adopted an IPM mindset, or what the role of PCA affiliation is in adopting such a mindset. Surveying PCAs, however, poses many challenges, because they typically work on many farms and commodities at once, and their knowledge and decision processes in any one crop or on any particular farm would be difficult to track.
Finally, discrepancies in the extent of IPM adoption for different pest types also point to a need for more research on effective IPM options for weed and disease control. The relatively low rate of grower adherence to recommended treatment thresholds for arthropod management also suggests a need to reexamine these thresholds in light of growers' on-the-ground constraints in making risk assessments; for example, when they feel they must treat for pests at appropriate times to prevent future population explosions that may be more difficult to handle.
California cotton growers utilize integrated pest management

