


All Issues
Weather-based yield forecasts developed for 12 California crops
Publication Information
California Agriculture 60(4):211-215. https://doi.org/10.3733/ca.v060n04p211
Published October 01, 2006
PDF | Citation | Permissions
NALT Keywords
Abstract
Crop-yield forecasts provide useful information to growers, marketers, government agencies and other users. Yields for several crops in California are currently forecast based on field surveys and farmer interviews, although official forecasts do not exist for many crops. Because broadscale crop yields depend largely on the weather, measurements from existing meteorological stations have the potential to provide reliable, timely and cost-effective predictions. We developed weather-based models of statewide yields for 12 major California crops and tested their accuracy using cross-validation from 1980 to 2003. Many of the weather-based forecasts were highly accurate, as judged by the percentage of yield variation explained by the forecast, the number of yields with correctly predicted direction of yield change, or the number of yields with correctly predicted extreme yields. The most successfully modeled crop was almonds, with 81% of yield variance captured by the forecast. Predictions for most crops relied on weather measurements well before harvest time, in many cases allowing longer lead times than existing procedures.
Full text
Forecasts of crop yields can provide important information about commodity markets and are frequently used by growers, industry and government to make decisions (Vogel and Bange 1999). For instance, growers may use forecasts to plan their harvest, storage and distribution strategies: California growers used the 2004 forecast of a large rice harvest to arrange greater storage capacity, and used a 2005 forecast of reduced almond production to allocate limited quotas among preferred customers (D. Flohr, CASS, personal communication). Similarly, industries involved in handling and trading commodities often use information on future harvests to make logistical decisions (Hammer et al. 2001).
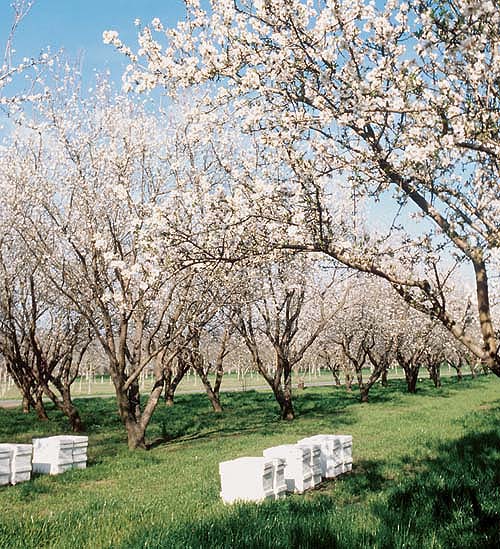
Weather-based yield predictions were developed for 12 major California crops, based on more than 20 years of daily weather records and actual yield data. The highest correlation between weather and yield was seen in almonds.
Each year, the California Agricultural Statistics Service (CASS) estimates the size of the coming harvest for various major California crops, including almonds, grapes, olives, oranges and walnuts (NASS 2005a, 2005b). These estimates are categorized as either subjective or objective. The former are based on phone interviews with hundreds of farmers to assess their opinions of crop development, and the latter are based on field samples taken from hundreds of fields. Forecasts are generally made public 1 to 3 months before the end of harvest (NASS 2005a).
It is common knowledge that one of the main factors causing yields to change from year to year is climate variability — no two growing seasons experience exactly the same weather. Indeed, grower expectations of crop yields are likely to be based at least partially on subjective weather observations and perceived relationships between weather and yields. To our knowledge, objective, quantitative weather measurements are not currently used in existing yield-forecast procedures. Such an approach would be attractive because yields could potentially be forecast at lower cost, with greater accuracy and longer lead times.
Building forecast models
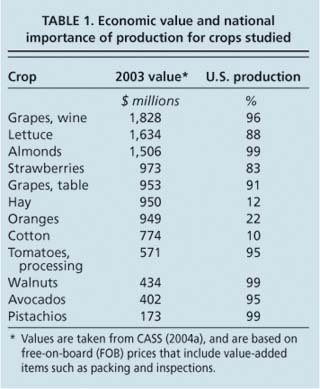
To test the ability of weather measurements to forecast crop yields prior to harvest, we studied the statistical relationships between historical weather and crop-yield records. We selected 12 crops (wine grapes, lettuce, almonds, strawberries, table grapes, hay, oranges, cotton, processing tomatoes, walnuts, avocados and pistachios) that are among the most valuable in California (table 1) (CASS 2004a), and obtained state yield data for 1980 to 2003 from California county agricultural commissioners (CASS 2004b). Several crops have exhibited significant positive yield trends since 1980 due to management and cultivar changes, so we removed a linear trend from each crop to produce a time series of yield anomalies, or departures from expected yields. A positive anomaly indicates yields higher than expected based on time trends, and a negative anomaly indicates yields lower than expected.

Daily weather records for the same period were obtained for 382 stations throughout California from the California Climate Change Center at the Scripps Institution of Oceanography (M. Tyree, staff scientist, personal communication). The average daily minimum and maximum temperature and precipitation for each month in each county were then computed, resulting in a monthly time series of three variables for 24 years. For each crop, a statewide monthly time series for each meteorological variable was calculated by weighting each county by the relative area of the crop in that county in 2003 (Lobell et al. 2006).
The weather and yield data were then combined in linear regression models to test how well yield anomalies could be predicted before harvest based on monthly weather measurements. Between two and four weather variables were selected for each crop, based on a combination of objective (good model accuracy) and subjective (physiologically reasonable) criteria (table 2). Because temperature and precipitation can have a nonlinear effect on yields, with yields maximized at intermediate values, we included the squared values of the weather variables in the regression model along with the variables themselves. For crops such as pistachios that are known to exhibit alternate bearing, with years of high reproductive growth (high yields) alternating with years of high vegetative growth (low yields), yield anomalies from previous years were also included in the model. The total number of predictors — including the weather variables, squared variables and previous years' yields — ranged from four to eight. (The model equations are omitted for brevity, but can be obtained from the authors.)
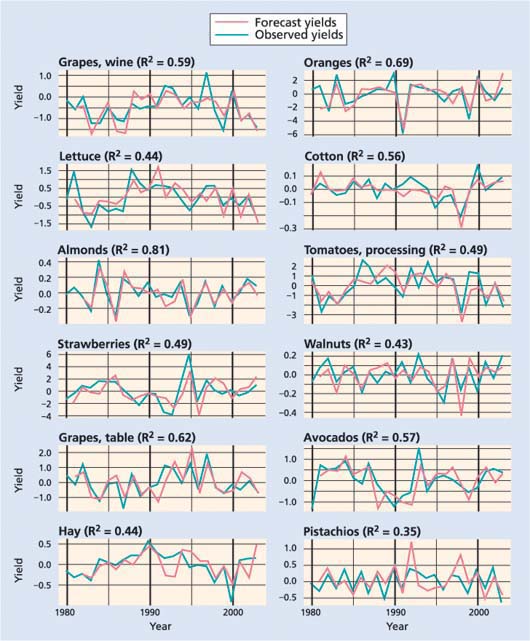
Fig. 1 Observed and forecast yields from 1980 to 2003. Forecasts were derived for each year using a model fit to data in all other years. Coefficient of determination (R2) between observed and forecast yields is shown for each crop.
An important step in building statistical models is to independently test model predictions, because tests using the same data that was used to calibrate the model tend to be overly optimistic (Hastie et al. 2001). The straightforward approach of reserving part of the data during model calibration, however, is problematic when the quantity of data is limited. An alternative approach, which we employed here, is “leave-one-out” cross-validation. In this approach, a single year is left out of the calibration step and subsequently compared to model predictions in that year. This comparison is done for each year, in this case resulting in 24 comparisons between model predictions and observations.
Forecast accuracy
The results of the cross-validation analysis suggest that yields of some crops can be forecast with fairly high accuracy based on objective weather measurements (fig. 1; table 3). For many crops, the model forecasts captured close to or more than 50% of the variability in yield anomalies, meaning that the selected weather variables explained over half of the variations observed in crop yields. Interestingly, the models did fairly well at forecasting extremely low yields, such as almonds in 1995, oranges in 1991, and processing tomatoes and cotton in 1998 (fig. 1). Almonds were particularly well modeled, with over 80% of variance captured by the model.
For a few crops, some of the power of the models came from knowing the previous year's yield (table 3). For instance, including weather information did not improve the pistachio model, where the biological pattern of alternate bearing seemed to dominate effects on yield more than any weather signal. For all other crops, however, most or all of the predictive power came from weather variables.
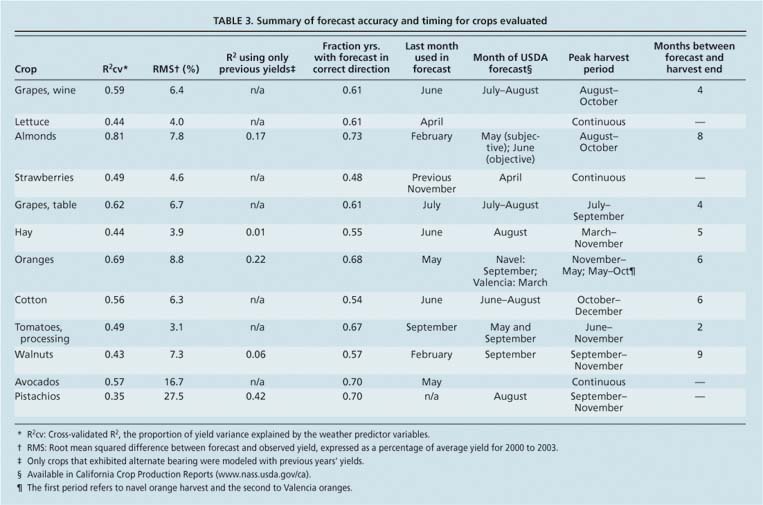
As an alternative measure of forecast skill, we considered the fraction of years in which the model correctly predicted the direction of yield anomoly (table 3). That is, we examined the frequency with which the model correctly predicted whether the yield would be above or below the trend. For a random forecast, this statistic has a distribution whose mean is 0.5 and whose 90th percentile is 0.625 for a 24-year record (15 out of 24 years). Six of 12 crops had a forecast with skill greater than a random forecast using this criterion and significance level. Three others (wine grapes, table grapes and lettuce) fell slightly below this value.
Another criterion is the ability of forecasts to correctly predict unusually high or low yields, which is of particular interest to many forecast users. For each year, both the forecast and the actual yield were classified into one of four classes: below one standard deviation (SD) from zero, between minus one SD and zero, between zero and one SD, and above one SD from zero. The first and fourth of these classes represent unusually low or high yields, respectively, and the middle two represent more moderately negative or positive years. We then computed the number of years when the forecast correctly predicted the yield class, was off by one class (in either direction), two classes or three.
Most crops did not exhibit any years when the forecast was off by more than one class. There were some exceptions; for example, lettuce yields in 1981 were forecast to be slightly negative but were actually very high (above one SD), and the reverse was true for hay in 1995. Overall, the forecasts were usually no more than one class off. Most of the cases discussed above — where the forecast predicted an anomaly in the wrong direction — corresponded to years with moderate yields, so the forecast was in fact not far from the observed yield. None of the crops exhibited any years with a forecast error of three classes.
To test the significance of these class accuracies, we performed 1,000 simulations using two 24-year, random-noise variables with a normal distribution. The average percentage of years with an error of zero, one, two or three classes was 28%, 45%, 22% and 5%, respectively. Only 10% of the simulations had more than 40% of years (10 out of 24) classified correctly by chance, while all crops except strawberries, pistachios and walnuts met this criterion. This indicates that the forecast accuracies for most of the crops were statistically significant by this measure.
Importance of timing
Forecast timing can be as important as accuracy. A “forecast” made after harvest, for example, would not be very valuable. Most of our models are capable of providing forecasts at least several months before the end of harvest, giving growers and others an opportunity to use the information to make decisions (table 3). For instance, our models for almonds and walnuts relied mainly on winter weather, while harvest does not begin until late summer.
We compared the times that our modeled yield predictions could be made available to growers with the times that currently available USDA forecasts are released (table 3). The two approaches were similar for wine grapes, table grapes and cotton, and existing forecasts were available 4 months earlier for processing tomatoes than our models. However, our models offer significant timing advantages over existing forecasts for almonds (3 to 4 months earlier than current forecasts), hay (2 months earlier), strawberries (5 months earlier) and walnuts (7 months earlier).
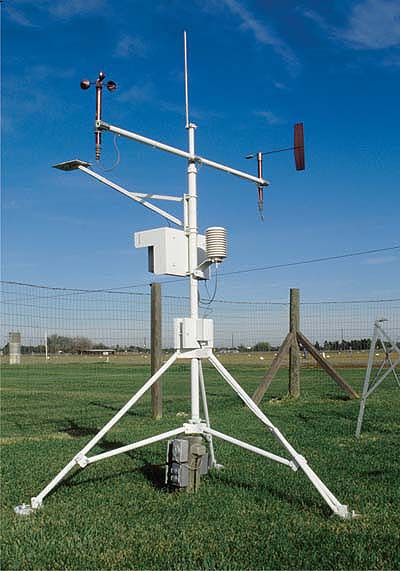
It is well known that climate is an important factor influencing crop yields from year to year. Weather-based yield forecasts can be developed at lower cost than field surveys, and with longer lead times. Above, a weather monitoring station.
Potential improvements
The current analysis was limited to only a dozen of the many crops grown in California and considered only statewide yields. We chose to aggregate several crops over different subcrop groupings, such as by combining varieties of hay and lumping navel and Valencia oranges together. In addition, we used only monthly averages of three meteorological variables (number of frost days per month was also considered, but did not substantially improve any of the models).
These decisions reflect an explicit desire to test forecasts of state yields for major crops using commonly reported climatic data. However, data for many additional crops is currently available at both state and county levels, as are additional weather measurements at time scales from hourly to monthly. Open questions are how well other crops can be modeled and whether different scales of analysis and meteorological indices would substantially improve forecast accuracies. Additional information such as remote sensing data might also aid predictions.
It is also possible that different model formulations could improve results. For example, in certain situations, process-based models that rely on a mechanistic understanding of crop growth and yield may outperform statistical models such as the ones developed here, which are derived from observed relationships without explaining the mechanisms causing the relationships. Alternative statistical approaches to the multiple linear regression that we used may also improve accuracies. (For example, we tested the use of regression trees, which did not perform as well.) Whether these more sophisticated approaches offer worthwhile improvements can be tested only on a case-by-case basis, using actual observations and well-defined criteria for an ideal forecast.
Weather promising for forecasts
The models developed in this study are promising for forecasting statewide crop yields based on weather measurements. Because the significance levels for the models depend on specified performance criteria, the eventual value of such forecasts will depend on the acceptable types and magnitude of errors for particular applications. The potential to forecast yields also depends on crop type. In general, almonds had significantly greater forecast accuracies than the other crops that we considered. Because almonds are California's most valuable export crop and account for over 80% of global almond production (Almond Board of California 2004), such forecasts could be of great relevance to almond trade and management decisions. For example, an almond grower could have used data on January rainfall and February nighttime temperatures to correctly predict the low yield in early March 1995 and adjust cultural or marketing practices accordingly, well before the forecasts from USDA became available in May and June.
Although field-based surveys are likely to be more accurate than weather-based forecasts, it is important to consider the tradeoff between forecast accuracy, cost and timing. The low cost and long lead times that are possible with weather-based models would likely provide a useful complement to existing approaches for crops that are currently surveyed. For crops that are not currently forecast by USDA, such as avocados, these models present an opportunity to develop forecasts with minimal cost by using existing weather measurements.
Weather-based yield forecasts developed for 12 California crops

