


All Issues
New crop coefficients developed for high-yield processing tomatoes
Publication Information
California Agriculture 60(2):95-99. https://doi.org/10.3733/ca.v060n02p95
Published April 01, 2006
PDF | Citation | Permissions
NALT Keywords
Abstract
Processing tomato yields have increased by 53% over the past 35 years, but the current seasonal crop-evapotranspiration requirements that growers use to schedule irrigation are based on 1970s-era data. We updated this data and developed new crop coefficients for processing tomatoes using the Bowen ratio energy balance method in eight commercial fields from 2001 to 2004. Today's evapotranspiration rates are similar to those of the early 1970s, indicating a substantial increase in water-use efficiency by processing tomatoes during the past 35 years. In addition, we collected data in both furrow- and drip-irrigated fields, but no statistical differences were found between them.
Full text
California produces nearly 95% of the processing tomatoes grown in the United States (CTGA 2005; USDA 2005). Nearly one-third of the state's tomato acreage is in the Central Valley's West-lands Water District (2005). Statewide, the average yields of processing tomatoes have increased by more than half (53%) from the early 1970s to the early 2000s (from 23.7 tons per acre for 1970 to 1974, to 36.3 tons per acre for 2000 to 2004), with most of the yield increase occurring after 1975 (CTGA 2005).
This long-term yield increase is the result of breeding programs that developed new tomato varieties better adapted to the climate and soil conditions of the Central Valley. In addition to higher yields, these new varieties also have better fruit quality. Furrow irrigation is commonly used in processing tomato cultivation, although drip irrigation is increasing, particularly in salt-affected soils along the west side of the San Joaquin Valley. Recent studies have shown that tomato yields in these salt-affected soils are considerably higher for drip irrigation compared to sprinkler and furrow irrigation (Hanson and May 2003).
Thanks to site-specific breeding, processing tomato yields in California have increased by more than 50% since the early 1970s, while water-use efficiency has increased about 40%. Bowen ratio instruments were used to collect climate and soil data from processing tomatoes, in order to calculate evapotranspiration and update crop coefficients.
Managing tomato irrigation water efficiently requires estimating crop evapotranspiration (ETc) — its water use — between irrigations. ETc is commonly estimated by multiplying a crop coefficient by a reference crop evapotranspiration (ETo). ETo is the evapotranspiration of well-watered grass and is obtained from the California Irrigation Management Information System (CIMIS), operated by the California Department of Water Resources. The crop coefficient is the ratio of ETc to ETo, and depends on crop type and growth stage. During the 1970s, the seasonal ETc for processing tomatoes in the Central Valley ranged from 25.1 to 28.1 inches, depending on planting time, with an average seasonal value of 25.4 inches (Fereres and Puech 1981).
Crop coefficients vary with crop type and stage of growth. There are four growth stages: (1) initial, from planting to about 10% canopy coverage, including planting, germination and stand establishment; (2) crop development, from about 10% to about 75% canopy coverage; (3) midseason, 75% coverage to the start of maturity, encompassing bloom, fruit-set and the majority of fruit sizing; and (4) late season, from full maturity to harvest or complete senescence. Midseason crop coefficients (during the period of the highest ETc) were developed from previous experimental data and range from 1.05 under subsurface drip irrigation (Phene et al. 1985) to 1.25 under sprinkler irrigation (Pruitt et al. 1972). More recently, the recommended midseason coefficients were 1.10 to 1.15 (Allen et al. 1998), although the source of these coefficients was not identified.
Several studies have shown a linear relationship between tomato yield and ETc. The long-term processing-tomato yield increase since 1975, coupled with the variability in crop coefficients determined from experimental data conducted 20 to 35 years ago, raise questions about current ETc requirements. This study evaluated the water usage of processing tomatoes on the west side of the San Joaquin Valley in furrow- and drip-irrigated commercial fields under a wide range of cultural practices used by growers, in order to develop more up-to-date evapotranspiration data and new crop coefficients.
Assessing evapotranspiration
From 2001 to 2004, we determined the ETc for processing tomatoes using three furrow-irrigated and five drip-irrigated commercial fields near Five Points, about 50 miles southwest of Fresno. Measurements were made in one drip-irrigated field and one furrow-irrigated field each year except for 2003, when measurements were made in two drip-irrigated fields. At all sites, irrigation water-management decisions were made by the growers or consultants hired by the grower. The soil type was clay loam for all fields.

The eight commercial fields that we studied were selected to represent a wide range of cultural practices (table 1). One plant row per bed was used at all sites except one (H2003), a drip-irrigated field with two plant rows per bed. Furrows ranged from about 640 to 800 feet long, and alternate furrow irrigation was used throughout except during the canopy development stage in 2001.
Drip lines were installed from 8 to 14 inches deep, and their lengths were 2,600 feet in 2001, and 1,200 feet during the rest of the study. Emitter spacing was 12 inches from 2001 through 2003, and 18 inches in 2004. In 2002, the subsurface drip system was replaced at the end of June due to emitter clogging; the new lines were installed in every other furrow. At all sites, each bed contained one drip line per bed, except for the surface drip system.
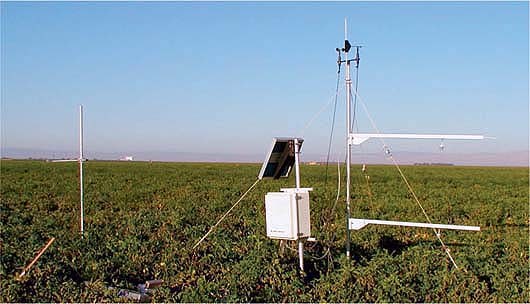
ETc was determined with the Bowen ratio energy balance (BREB) method using Campbell Scientific (Logan, Utah) systems. The BREB method calculates ETc from measurements of net radiation, soil heat flux, soil temperature, soil water content, wind speed, air temperature and dew point temperature. A computer ET model developed by (Hsiao and Henderson (1985) was used to estimate ETc during the cultivation periods, which required the removal of the BREB systems, and during periods of instrument problems. There was a difference of 5% or less between the cumulative ETc estimated by the model (calibrated from the BREB data) and the BREB systems.
Using experimental plots in commercial fields sacrifices the statistical rigor of a randomized replicated design. However, there are several important advantages to using commercial fields: (1) ETc is determined under the conditions experienced by growers, (2) ETc reflects the fieldwide conditions, and (3) fields can be selected to reflect a range of cultural practices used by tomato growers.
Moreover, there are several reasons why it is not practical to measure ETc in a randomized, replicated experimental design. Plot sizes must be relatively large because the BREB method requires a significant amount of fetch, or area of crop around the instruments. A fetch-to-instrument height above the surface of 100-to-l is commonly used as a rule of . For example, at maximum canopy coverage in our study, the instruments were positioned 6.5 feet above the ground surface and so required 650 feet of fetch. Furthermore, instruments would be needed in each plot, which — at $15,000 to $20,000 per setup — would be prohibitively expensive.
Crop coefficients were calculated as the ratio of ETc to ETo. The latter was obtained from the California Irrigation Management Information System (CIMIS) station at the UC Westside Research and Extension Center, about 3 to 5 miles from the eight study fields.
Crop evapotranspiration trends
Initially, the 2001 furrow ETc was 0.22 inches per day due to sprinkler-irrigated stand establishment, but rapidly decreased to nearly 0.05 inches per day for the next 25 days (fig. 1A). Thereafter, ETc increased during canopy development, reaching maximum values on or about day 170, and then decreasing again to the season's end. During canopy development, ETc spikes occurred due to furrow irrigations, which wet the soil surface across the bed. The 2001 drip ETc was very small at the beginning of the crop season due to stand establishment with the drip system, but increased with time to maximum values of nearly 0.3 inches per day. Thereafter, drip ETc generally fluctuated between 0.22 and 0.32 inches per day. The average midseason ETc was 0.29 inches per day for furrow and 0.27 inches per day for drip irrigation.
In 2002, both furrow and drip ETc values exceeded 0.17 inches per day due to sprinkler irrigation at the beginning of the crop season, but ETc rapidly decreased to less than 0.08 inches per day followed by relatively constant values until the start of canopy development (fig. 1B). ETc then rapidly increased to high midseason values of 0.31 inches per day for both irrigation methods. Drip ETc decreased near the end of the crop season, indicating a late-season growth stage; no similar behavior occurred for the furrow ETc.
Relatively high initial values of ETc occurred for H2003 (drip irrigation) due to sprinkler irrigation, followed by values generally smaller than 0.05 inches per day for about 35 days (fig. 1C). The initial values for D2003 (drip irrigation) were about 0.05 inches per day due to the drip-irrigated stand establishment, followed by a rapid increase in ETc after about 23 days. Average midseason values were 0.27 and 0.31 inches per day for D2003 and H2003, respectively.
In 2004, two sprinkler irrigations occurred for both furrow and drip irrigation during initial growth. Following the second sprinkler irrigation of the furrow site, ETc decreased slightly but then increased to maximum values at midseason (fig. 1D). After day 210, furrow ETc decreased with time. Drip ETc increased with time after the second sprinkler irrigation, reaching midseason values on about day 220. After day 220, drip ETc generally decreased with time. Average midseason values were 0.30 and 0.27 inches per day for furrow and drip irrigation, respectively.

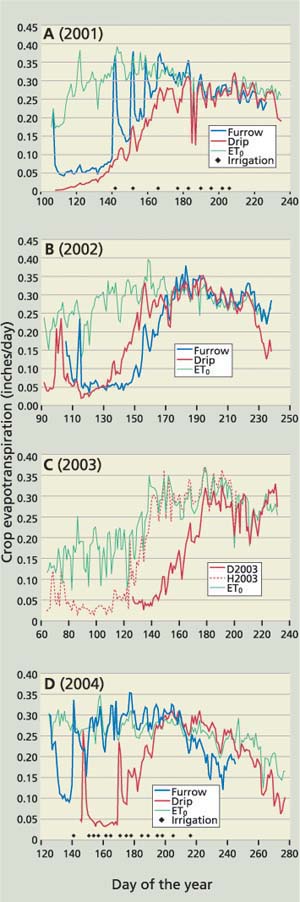
Fig. 1. Daily reference crop evapotranspiration and daily crop evapotranspiration for furrow and drip sites in (A) 2001, (B) 2002, (C) 2003 (drip only) and (D) 2004.
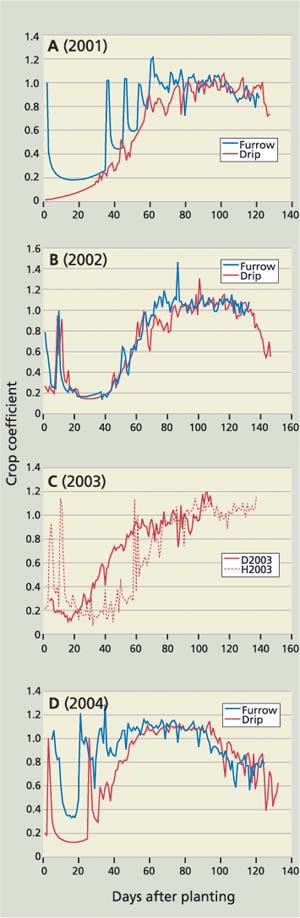
Fig. 2. Daily crop coefficients with days after planting for (A) 2001, (B) 2002, (C) 2003 and (D) 2004.
Daily crop coefficients
During sprinkler irrigation at the start of the crop season, crop coefficients were nearly equal to 1 for all years; this indicates that ETc was nearly equal to ETo during sprinkler irrigation because of evaporation from the soil surface (fig. 2). Maximum crop coefficients determined from the BREB data ranged from 0.91 to 1.21, with an average of 1.03. The average crop coefficient between sprinkler irrigation and 10% canopy coverage was 0.19, due to a substantial reduction in evaporation caused by a drying soil surface. Crop coefficients at the start of the crop season were smaller than 0.3 for sites where subsurface drip irrigation was used for stand establishment. During canopy development, crop coefficients increased rapidly to values generally exceeding 1.
The crop coefficients remained relatively constant during midseason, but the average midseason crop coefficient varied year to year from 0.96 to 1.09 (table 2). No statistical differences were found between the midseason crop coefficients of the two irrigation methods in any year. The 2001 coefficients were smaller and generally statistically different from those of the other years, while the 2004 coefficients were higher and statistically different from those of the other years. These average midseason coefficients were similar to those found by Phene et al. (1985), but smaller than those of Pruitt et al. (1972).
The daily crop coefficient data showed well-defined late-season growth stages for only the 2002 drip system and the 2004 drip and furrow systems. The average crop coefficients for the last 5 days of the measurement period were 0.55 (2004 drip), 0.59 (2002 drip) and 0.78 (2004 furrow). No late-season stages of decreasing ETc were found for the other sites.
Canopy growth rates
Canopy coverage over time (days after planting) showed similar growth rates for drip- and furrow-irrigated fields in 2001 and 2002, due to similar planting dates and types (figs. 3A and B). A slight decrease in canopy coverage occurred near the end of the crop season due to vine training (pushing the vines in the furrow back onto the bed) and / or trimming (cutting off vines in the furrow), methods used to improve air circulation and reduce mold and rot in the canopy.

Fig. 3. Canopy coverage (%) versus days after planting for (A) 2001, (B) 2002, (C) 2003 or (D) 2004.


Fig. 5. Family of curves showing crop coefficients versus time of year for planting times of March 1, April 2, May 1 and May 25.
The canopy growth of H2003 (drip irrigation) lagged behind that of D2003 (drip irrigation) because the former was planted much earlier (March 1 vs. May 1, respectively) (fig. 3C). This early planting date resulted in a much longer initial growth stage. However, similar values of maximum canopy coverage occurred in both 2003 fields.
In 2004, growth rates varied between the two fields due to different planting dates and stand establishment problems with the drip-irrigated field (fig. 3D). These problems slowed down the initial growth rate of the drip-irrigated field, but eventually its canopy coverage recovered to nearly 90%. The canopy coverage of the drip field later decreased to about 80% due to vine training.
Coverage and crop coefficients
We described the relationship between canopy coverage (C) and crop coefficient (Kc) using a second-order polynomial equation (fig. 4). Crop coefficients that occurred during the sprinkler irrigations or were calculated by the computer model were excluded from this relationship. A regression analysis developed the following equation:
Kc = 0.126 + (0.0172)(C) — (0.0000776)(C2). (1)
The regression was highly significant, with a coefficient of determination of 0.96. This relationship appeared to be independent of specific field characteristics.
Equation 1 can be used to determine crop coefficients from canopy coverage data for Central Valley processing tomatoes. However, this may be inconvenient due to the time required to measure canopy coverage. Therefore, based on the canopy growth curves for different planting times and equation 1, we developed a family of curves showing crop coefficients by time of year for various planting times (fig. 5). Some adjustments may be needed for site-specific conditions. For example, the canopy growth of transplants may be 10 to 20 days ahead compared to direct-seeded plants for similar planting times.
Soil water tension
The soil water tension data (not shown) indicated that most of the time, the irrigation frequencies and amounts of irrigation water applied during this study were adequate, and that ETc rates and processing tomato yields should not be adversely affected by water stress. The exception was H2002 (drip irrigation), where clogging of the drip lines during the initial and canopy-development growth stages caused soil water tensions to exceed 200 centibars (maximum values less than 80 centibars are recommended). Interestingly, the canopy growth rate and processing tomato yield for that field did not show any adverse effects due to these high tensions.
Water-use study results
Evapotranspiration
For all years, seasonal crop ETc ranged from 20.8 to 29.6 inches (table 3), and the average difference in ETc between irrigation methods was not statistically significant (t-test, level of significance = 0.05). The average ETc of all sites was 25.5 inches with a standard deviation (SD) of 3.1 inches. The average ETc of the furrow systems was 27.4 inches (SD = 2.0 inches) and the drip systems was 24.4 inches (SD = 3.1 inches).
Applied water
Applied water ranged from 22.9 to 40.1 inches. The furrow irrigation amounts included surface runoff that was recovered and reused elsewhere on the farms. The D2003 high water applications reflected an attempt by the irrigator to reverse decreasing soil water potential at the 6-inch depth. Reasons for the high water application of H2003 (drip irrigation) were not clear.
Yields
Crop yields ranged from 35.1 to 65.5 tons per acre. The large yield of H2003 reflected its very early planting time, which experience has shown results in larger yields. Differences between average yields of furrow and drip irrigation were not statistically significant, which is not surprising considering the variability in the data. There was no correlation between crop yields and ETc; we believe the main reason for this was the different processing-tomato varieties planted, based on a separate study that we conducted on the effects of variety on yield under drip irrigation (May and Hanson 2004). Year-to-year climate variability and different crop seasons also may have contributed to the crop yield differences.
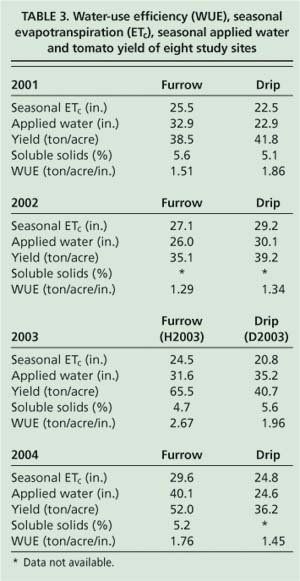
TABLE 3. Water-use efficiency (WUE), seasonal evapotranspiration (ETc), seasonal applied water and tomato yield of eight study sites
Water-use efficiency
Water-use efficiency, defined as the ratio of yield to ETc, ranged from 1.29 tons (2002 furrow) to 2.67 tons (H2003) per acre per inch. The average water-use efficiency was 1.52 and 1.86 tons per acre per inch for furrow and drip irrigation, respectively, but these values were not statistically different (t-test, level of significance = 0.05).
It has been hypothesized that the seasonal ETc of subsurface drip irrigation may be smaller than that of furrow irrigation due to reduced evaporation from the soil. The only previous study found on this matter showed little difference in seasonal ETc — measured with lysimeters — between surface drip and furrow irrigation of processing tomatoes (Pruitt et al. 1984).
The only conclusion that can be drawn from our current study is that evaporation under subsurface drip irrigation may be smaller during the early growth stage compared to furrow irrigation, as shown by the furrow and drip ETc data for 2001. For the furrow system, relatively high ETc due to evaporation from the wet soil surface occurred during the stand-establishment sprinkler irrigation and during furrow irrigations at the canopy development stage, as evidenced by the spikes in the ETc data (fig. 1). During those irrigations, wetting of the soil surface occurred across the bed width. In contrast, little wetting occurred with the subsurface drip system. Cumulative ETc at the end of canopy development was 4.6 inches higher for the furrow system as compared to the subsurface drip system. Similar behavior, however, was not found for the 2002 and 2004 furrow systems. These systems were managed so that soil-surface wetting was minimal, reducing the evaporation component of ETc during canopy development.
Seasonal trends
In 2002, the seasonal ETc for drip irrigation was 2.1 inches more than that for furrow irrigation. Contributing factors were the longer crop season of the drip system as well as reduced evaporation during furrow irrigation at the early growth stages due to limited surface wetting during furrow irrigation. The 2004 data showed higher seasonal furrow ETc when compared to seasonal drip ETc. However, this difference was partly due to different planting times and problems with the stand establishment in the drip system.
Efficient irrigation scheduling
The seasonal ETcs that we calculated are similar to those reported by Fereres and Puich in 1981. Therefore, the 53% increase in processing tomato yields since the mid-1970s has not increased the seasonal ETc. Instead, the average water-use efficiency of processing tomatoes has increased by about 50% during the same period (from 0.93 to 1.42 tons per acre per inch). For the same amount of water per acre, much higher tomato yields are being obtained today compared to those of 35 years ago.
It is unlikely that converting from furrow to drip irrigation in processing tomatoes will reduce seasonal ETc. While some reduction in water use may occur during the early growth stages, as shown by the 2001 data, the 2002 and 2004 data showed that evaporation under furrow irrigation can be reduced. Stand establishment with subsurface drip irrigation may reduce ETc during the initial growth stage compared to sprinkler irrigation, but this approach is feasible only for transplanted fields. There is little or no opportunity for reduced drip ETc during midseason because for a given year, similar midseason crop coefficients occurred with both irrigation methods.
To provide sufficient water to meet crop ETc requirements, we recommend that processing tomato growers schedule irrigations using either the relationship between canopy coverage and coefficients along with ETo data, or the family of curves in figure 5.
New crop coefficients developed for high-yield processing tomatoes

