


All Issues
Biotic diversity interfaces with urbanization in the Lake Tahoe Basin
Publication Information
California Agriculture 60(2):59-64. https://doi.org/10.3733/ca.v060n02p59
Published April 01, 2006
PDF | Citation | Permissions
NALT Keywords
Abstract
In the Lake Tahoe Basin, the retention of native ecosystems within urban areas may greatly enhance the landscape's ability to maintain biotic diversity. Our study of plant, invertebrate and vertebrate species showed that many native species were present in remnant forest stands in developed areas; however, their richness and abundance declined in association with increasing development across all taxonomic groups. Species richness for land birds and mammalian carnivores declined with development, whereas ant richness and small mammal abundance peaked at intermediate levels of development. Vegetation structure simplified with increasing development and the exotic plant species increased. The results of this study, the first to consider the effects of urbanization and remnant forests on biotic diversity in the Lake Tahoe Basin, can be used to guide land-use planning in order to maintain and enhance biodiversity in the face of increasing urbanization.
Full text
After almost a century of resource extraction, the 1950s and 1960s brought rapid development to the Lake Tahoe Basin that fragmented formerly large and contiguous wildlands, with the resulting parcels converting to urban uses (Lindström 2000). Concern about the diminishing beauty and ecological integrity of Lake Tahoe has led to substantive changes in resource management and land-use planning. For example, the Tahoe Regional Planning Agency, created in 1969, imposed land-use regulations that slowed the pace of urbanization and changed development patterns. In addition, over the past two decades, the U.S. Forest Service, California Tahoe Conservancy and Nevada Division of State Lands have acquired more than 9,000 parcels (totaling approximately 20,000 acres) of environmentally sensitive lands in an effort to maintain and protect their ecological integrity, thereby reducing threats to the clarity of Lake Tahoe and the integrity of its watershed.
The Tahoe Basin is particularly vulnerable to the loss of biotic diversity because of its topography and geography. Lake Tahoe sits in an isolated montane basin with a broad elevational range; as such, it supports narrow bands of three distinct life zones nested within a relatively small geographic area. Development is most prevalent near the lake, therefore species restricted to the lower montane zone adjacent to the lake (under 7,500 feet) are particularly vulnerable to the direct and cumulative impacts of urbanization.
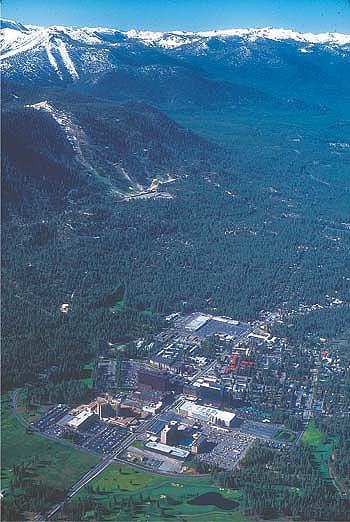
Development since the 1950s and 1960s has had important effects on animals and plants around Lake Tahoe, in California and Nevada. The authors studied a diversity of taxa to evaluate the role of urban forests in supporting biodiversity.
Urbanization can alter the biodiversity of native forest habitat at both site and landscape scales, such as decreasing the richness of native species, losing vulnerable species (such as habitat specialists, dietary specialists and large-bodied species), and increasing generalist and exotic species (Hansen et al. 2005). Our study evaluates the species richness and relative abundance of multiple taxonomic groups along a gradient of surrounding urbanization to provide a fundamental indication of the effect of urbanization on biotic diversity in lower-montane remnant forests.
Sampling for plants and animals
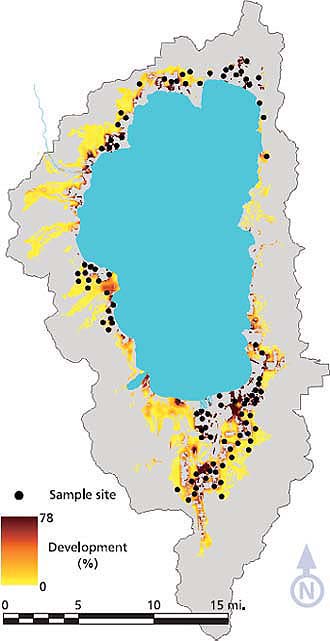
We selected sample sites surrounded by varying degrees of urban land use and road density (fig. 1). Using ArcGIS (ESRI 2002), we created a grid of 100-by-100-foot pixels across the entire basin and estimated the percentage development within each pixel based on land uses represented on county parcel maps. Development within 1,000 feet of each pixel (70-acre area) ranged from zero to more than 75% developed. Sample sites were randomly selected from the available 100-by-100-foot pixels within defined levels of development and basin orientations (north, south, east and west). All sample sites were centered within a native forest stand at least 1 acre in size.
Birds, mammals, ants and plants were sampled at up to 101 sites in 2003 and 2004. Of these sites, 68 were sampled for all four or more taxonomic groups. Field methods encompassed a variety of detection and descriptive methods.
Land birds were sampled using point counts; 10-minute counts were conducted during three visits to five stations located 650 feet apart per site. Bird species richness was based on the suite of terrestrial, nonraptor species detected across the five point-count stations; average relative abundance per count per site was based on all detections within 325 feet of each count station averaged across all stations and visits per site.
Small mammals were sampled using 64 Sherman live traps configured in a 350-by-350-foot grid. Traps were baited with oats and seeds, and checked twice a day for four consecutive days. The relative abundance of each species was calculated as the number of first captures per 100 trap nights; the abundance of deer mice (Peromyscus maniculatus) was only recorded on a random subset of 50 sites. Shrews (Sorex spp.) and voles (Microtus spp.) were analyzed at the genus level to avoid errors associated with identification to species.
Larger-bodied mammals were sampled using a combination of baited track plate stations and baited camera-detection stations spaced 820 feet apart per site (one each at the center).
Ground-dwelling ants were sampled using 12 pitfall traps arrayed in a 130-by-165-foot grid. Richness and relative abundance values were based on all individuals captured at each site.
The composition, structure and percentage cover of vegetation were characterized using a combination of standard measurement methods, including circular plots, quadrats, and line-intercept and point-intercept transects.

Birds showed the strongest response to development. Species that frequently cohabit with humans such as, top right, the house finch and, bottom right, Steller's jay, responded well to development while less-abundant species like, leftthe pileated woodpecker declined.
Species richness and abundance
Birds
Patterns of species richness and abundance varied among taxonomic groups, with birds showing the strongest response to development. We detected 21,726 individual birds of 68 native land bird species. Species richness ranged from 16 to 37 per site (average = 27.1, s.d. = 4.45) and declined significantly with development (adjusted [adj.] R2 = 0.327, P < 0.001) (fig. 2), and richness based on the center point alone (such as, primarily in native forest) also declined significantly with development (adj. R2 = 0.178, P < 0.001).
The richness of many bird species groups — ground nesters, shrub nesters, overstory tree nesters, primary cavity excavators, bark foragers, foliage foragers and invertivores — also was negatively related to development. Conversely, bird abundance, which ranged from 7.6 to 34.5 individuals per count (average = 19.3, s.d. = 4.30) increased with development (adj. R2 = 0.064; P = 0.016), but individual species varied widely in their abundance relative to development. Over 50% of the 68 native bird species in the sample showed a significant change in abundance with development: 12 species increased and 24 decreased.
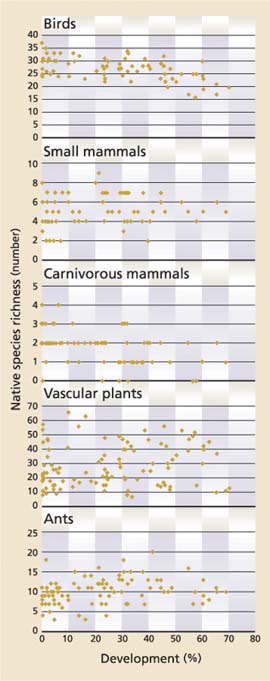
Fig. 2. Number of species detected relative to percentage development within a 1,000-foot radius around 72 to 101 sites sampled for five taxonomic groups in 2003 and 2004, in the Lake Tahoe Basin.

Fig. 3. Number of exotic plant species relative to percentage development within a 1,000-foot radius around 101 sites sampled in 2003 and 2004, in the Lake Tahoe Basin.
Responding positively to development were species that frequently cohabit with humans, including Steller's jay (Cyanocitta stelleri), American robin (Turdus migratorious) and brown-headed cowbird (Molothrus ater), as well as cliff swallow (Petrochelidon pyrrhonota) and Brewer's blackbird (Euphagus cyanocephalus). The 24 species that declined with development included less-abundant species associated with older forests, such as pileated woodpecker (Dryocopus pileatus), hermit thrush (Catharus guttatus), brown creeper (Certhia americana) and hermit warbler (Dendroica occidentalis), as well as species that were not expected to be as sensitive to development, such as dusky flycatcher (Empidonax oberholseri) and olive-sided flycatcher (Contopus cooperi).
Small mammals
More than 23,000 trap nights (average = 238.5 per site, s.d. = 26.00) for small mammals resulted in the capture of 4,755 individuals representing 18 species. Species richness ranged from two to nine per site (average = 5.2, s.d. = 1.59). We found no significant difference in the richness of small mammal species along the development gradient (adj. R2 = 0.011, P = 0.385); however, variablity in species richness appeared to decrease with development (fig. 2). The average number of individuals captured per 100 trap nights per site, excluding deer mouse, ranged from 3.2 to 54.9 individuals (average = 19.7, s.d. = 10.98). On average, over 95% of these individuals were squirrels and chipmunks (average = 19.1 individuals per site, s.d. = 11.12).
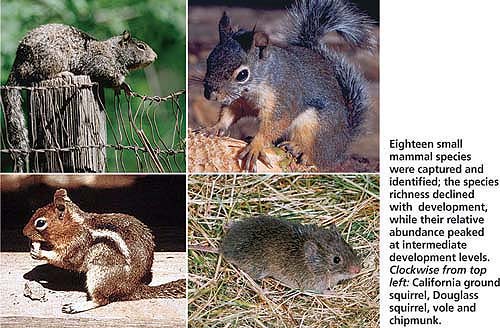
Eighteen small mammal species were captured and identified; the species richness declined with development, while their relative abundance peaked at intermediate development levels. Clockwise from top left: California ground squirrel, Douglass squirrel, vole and chipmunk.
We found that the relative abundance of small animals peaked at intermediate levels of development (40% to 50%), as reflected in the quadratic regression (adj. R2 = 0.231, P < 0.001). Of the 11 species and genera that were detected at more than one site, the abundance of three was positively, and significantly, associated with development: California ground squirrel (Spermophilus beecheyi), Douglas squirrel (Tamiasciurus douglasii) and voles (adj. R2 = 0.054, P = 0.028, adj. R2 = 0.117, P = 0.002, and adj. R2 = 0.310, P < 0.001, respectively). One species, shadow chipmunk (Tamias senex), was negatively associated with development, but not significantly (adj. R2 = 0.034, P = 0.068). Four additional species exhibited a threshold effect: they were not detected where development exceeded more than 30% (shrews and shadow chipmunk) or 40% (goldenmantled ground squirrel [Spermophilus lateralis] and lodgepole chipmunk [T. speciosus]).
Large mammals
Ten carnivore species were detected: eight native species, domestic dog (Canis familiaris) and domestic cat (Felis catus). The most frequently detected native species were coyote (C. latrans) (n = 34 sites), black bear (Ursus americanus) (n = 35) and raccoon (Procyon lotor) (n = 37), with each species detected at more than 40% of sample units. The least frequently detected species were bobcat (Lynx rufus) (n = 2 sites), weasels (Mustela spp.) (n = 2) and spotted skunk (Spilogale putorius) (n = 3).
Native species richness ranged from zero to four per site (average = 1.7, s.d. = 0.95), and it declined significantly with development (adj. R2 = 0.062, P = 0.016) (fig. 2). Even when detection data were limited to the center point (such as within native forest), richness declined with development (adj. R2 = 0.055, P = 0.016). Marten (Martes americana), small weasels, bobcat and both skunk species (S. putorius and Mephitis mephitis) appeared to be the most sensitive to development, with the few detections located at sites with 15% or less development. Black bear was intermediate in its response to development, with frequency of detection greatest at sites with 30% or less development and detections peaking at sites with limited development (1% to 15%). Coyote and raccoon are both commonly considered amenable to human development, and they each had a fairly consistent frequency of detection across sites with more than 1% development. As expected, domestic dog and cat detection frequencies increased with development. Domestic cats were only detected at sites with more than 15% development. Domestic dogs, however, were the most frequently detected species across sample units; they were detected at 64% of sites, and at 87.8% of sites with development greater than 15%. At one sample site, at least 13 distinct individual dogs were recorded during one 10-day survey period.
Ants
A total of 32,023 ants representing 46 species were detected; subfamilies with the greatest species richness were Formicinae (30 species) and Myrmicinae (13 species). The most frequently detected species were Formica sibylla (16% of sites), F. obscuripes (11%) and Camponotus modoc (9%). Species richness ranged from 3 to 20 (average = 10.1, s.d. = 3.19), and was greatest at intermediate levels of development (40% to 50%) (fig. 2). A quadratic regression showed a significant relationship between ant species richness and development (adj. R2 = 0.128, P = 0.002).
Ant abundance across all species was not significantly associated with development (P = 0.193), but a general decline in maximum abundance with development was apparent. Responses were also observed in the two specialist functional groups of ants that we examined (ground nesters [n = 9 species] and log nesters [n = 5]). Although the maximum richness of log nesters declined with development, overall richness did not decline significantly (P = 0.899), and ground nester abundance reached its peak at intermediate levels of development and had a significant quadratic relationship with development (adj. R2 = 0.131, P = 0.001).
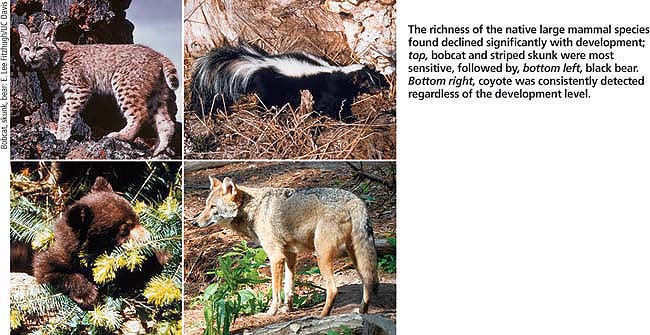
The richness of the native large mammal species found declined significantly with development; top, bobcat and striped skunk were most sensitive, followed by, bottom left, black bear. Bottom right, coyote was consistently detected regardless of the development level.
Plants
No significant relationship was observed between development and the richness of all 209 native plant species we detected (average = 28.3, s.d. = 14.47, range = 7 to 66) (fig. 2) or for four of five life-form groupings: shrubs, trees, annual herbs and perennial herbs. The exception was native perennial grass richness, which increased significantly with development (adj. R2 = 0.14, P < 0.001). The richness of exotic plant species (n = 41), not surprisingly, also increased significantly with development (adj. R2 = 0.251, P < 0.001) (fig. 3). Sites with 40% or less development had three or fewer exotic species (with one exception) and averaged 0.5 exotic species (s.d. = 0.97) per site, whereas sites with more than 40% development had as many as 15 exotic species and averaged 3.7 exotic species (s.d. = 3.95) per site. The five most frequently occurring exotic species were cheatgrass (Bromus tectorum) (15.3% of sites), orchard grass (Dactylis glomerata) (14.4%), dandelion (Taraxicum officinale) (12.7%), wheatgrass (Elytrigia pontica) (9.3%) and knotweed (Polygonum arenastrum) (6.8%).
Elements of vegetation structure were affected by development. The average percentage cover of native shrubs, perennial herbs and annual herbs did not change with development; however, the average percentage cover of native trees declined with development (adj. R2 = 0.070, P < 0.001), and the average percentage cover of native perennial grasses increased with development (adj. R2 = 0.131, P < 0.001). Tree density did not change significantly with development based on each of three diameter classes: 5 to 11 or fewer inches, 11 to less than 24 inches, and 24 or more inches diameter at breast height. These results suggest that although tree densities were not significantly altered, canopies were reduced by development. Snag density and log volume also declined with development (adj. R2 = 0.170, P < 0.001, and adj. R2 = 0.127, P < 0.001, respectively). In addition, less developed sites had older, more decayed snags (based on average decay classes) than more developed sites (adj. R2 = 0.080, P = 0.005).

Ant species richness peaked at intermediate levels of development.
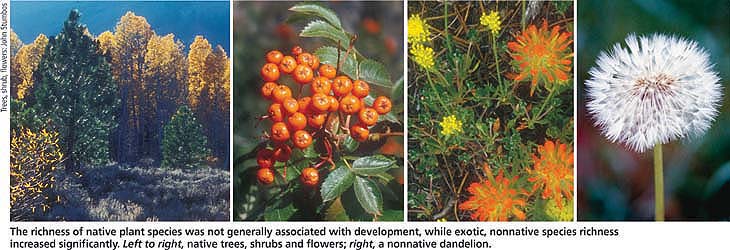
The richness of native plant species was not generally associated with development, while exotic, nonnative species richness increased significantly. Left to right, native trees, shrubs and flowers; right, a nonnative dandelion.
Urban forests and biotic diversity
The effects of development on biotic diversity in the Lake Tahoe Basin, as in rural environments in general, have not been well documented (Hansen et al. 2005). It is generally accepted that lands converted to residential and commercial uses exhibit more compromised ecological processes than do less intensively developed lands (Marzluff and Ewing 2001); however, even in less urbanized areas, such as the Tahoe Basin, the spatial and temporal progression of development can significantly alter species composition and distributions (Hansen et al. 2005).
We observed changes in plant community composition and structure in every taxonomic category, but responses varied among species groups and individual species. In some groups we observed changes in species richness, while others showed responses in individual species abundances. Species losses are typically preceded by reductions in species abundances through a myriad of causal factors; thus, patterns of abundance within and among species can foretell pending local attrition of species. In our study, many responses showed a high level of variance, indicating that development is one of many factors affecting species composition and abundance in these remnant forests. Native land birds and mammalian carnivores appeared to be affected most by development, exhibiting reductions in species richness, even in native forests. While reductions in native land bird species richness have been observed in response to development in a variety of ecosystems (Germaine et al. 1998; Fernández-Juricic 2000), species richness of native carnivore assemblages is rarely evaluated; rather, carnivore species responses have been evaluated individually. In our study, declines in bird and carnivore richness were concomitant with both increases and decreases in the frequency of occurrence and abundance of individual species.
Most of the bird species that showed a strong negative response to development were associated with older forests and/or forest understories, suggesting that vertical complexity and understory conditions are important factors that determine the diversity of land bird communities; human disturbance and increased predation may also be contributing factors. As we observed, many native carnivores, even opportunistic species such as the black bear, can be less prevalent or absent in areas where development has replaced and fragmented habitat (Odell and Knight 2001; Crooks 2002). Larger mammals require specific conditions for den and rest sites that are less likely to be present in more developed and disturbed forested areas; however, urban forests may provide valuable foraging habitat for larger mammals. Conversely and not surprisingly, domestic dogs and cats were consistently more prevalent in areas with human development, and their impacts on native species occurrence and abundance can be significant (Miller et al. 2001; Odell and Knight 2001).
Impacts to largely ground-dwelling animal species were observed across multiple taxonomic groups, including changes in small mammal and ant communities with greater landscape development. Positive responses to development were most common among species most closely associated with forest canopy (such as tree squirrels), whereas specialized ground associates (such as shrews) were not observed in areas with higher levels of development. Ants and small mammals showed peaks in richness or abundance at intermediate levels of development; others have observed such peaks in small mammals (Racey and Euler 1982) and ants (Nuhn and Wright 1979), as well as other taxonomic groups (McKinney 2002).
We did not see major changes in plant species composition and vegetation structure with development; for example, plant species richness within forest fragments was not substantially different along the development gradient. At a glance, this is surprising given that native plant species richness is usually thought to be reduced by urbanization (Whitney 1985); however, in the lower montane forests of the Lake Tahoe Basin, many plants are dispersed and pollinated by wind, and are capable of dispersing over large distances and across unsuitable terrain. For plants, therefore, it may be the condition of the greater landscape that is the primary determinant of the composition of species at any individual site.
Development within the Tahoe Basin still takes up a limited proportion of the landscape, but responses to development occurred within every taxonomic group studied.
It is possible that the responses we observed in plants (and to lesser degrees in other taxonomic groups) may reflect the fact that development within the basin still occupies a relatively limited proportion of the landscape, even within the lower montane zone where we conducted our study. (In fact, we sampled nearly all of the forest fragments that had over 60% development within 1,000 feet and were at least 2.5 acres.) Even the most-developed sites were usually in close proximity to areas with lower levels of development. Through that lens, native plant species richness in forest fragments within the basin may reflect larger-scale changes in landscape condition. Certainly it is not surprising that sites with higher levels of development appear more vulnerable to invasion by exotic plants, and they are likely to serve as staging areas for the dispersal of non-natives into less fragmented and less disturbed lower montane forests (Luken 1997). Understanding the conditions and thresholds associated with invasions by non-natives could help inform urban forest management to improve conditions for native species, while reducing the risks of invasion by exotic plant species.
The Tahoe Basin is not greatly developed — certainly when compared to many truly urban locations in the West — but our results showed responses to even limited development at species and community levels in every taxonomic group. This is the first study that has attempted to quantify the effects of development on biotic diversity and the contribution that urban forests make to supporting biotic diversity in the Lake Tahoe Basin. It only begins to build an understanding of how development is affecting ecological communities and species both common and rare, and what mechanisms are determining the observed changes. Our observations suggest that the effects of development on biotic diversity may not be linear, but rather that certain significant shifts in species composition and abundances occur at lower levels of development. Accordingly, this may be an opportune time to evaluate the risks, opportunities and consequences of various land-use planning options to the conservation of biotic diversity in the Lake Tahoe Basin.
Biotic diversity interfaces with urbanization in the Lake Tahoe Basin

