


All Issues
Site-specific herbicide applications based on weed maps provide effective control
Publication Information
California Agriculture 59(3):182-187. https://doi.org/10.3733/ca.v059n03p182
Published July 01, 2005
PDF | Citation | Permissions
Abstract
More-effective weed control in agricultural fields can be achieved by utilizing information about the spatial distribution of the previous year's mature weeds. In our study, variable-rate herbicide applications based on weed infestation maps developed just before the previous year's harvest provided effective weed control. The results showed that when information about the spatial distribution of the previous year's weed seedlings or mature weeds was used, weed control was comparable to uniform, one-rate, herbicide applications, while the total amount of herbicide applied decreased. Herbicide use was reduced an estimated 39% for the seedling map and 24% for the mature map approach. However, incorporating the weed-seed redistribution from harvest to application time into the treatment maps could further improve weed control.
Full text
Site-specific weed control matches site-specific conditions (such as soil properties and weed infestation densities) with the proper herbicide and application rate. Spatially variable herbicide-rate applications can achieve the most effective application, because each part of the field receives a precise amount of herbicide based on its need. The benefits of this technology include a reduction in spray volume and consequently lower herbicide costs, time savings because of fewer stops to refill, and less nontarget spraying, which reduces potential environmental risks (Felton 1995).
Reductions in herbicide use achieved with site-specific applications depend on the level of weeds in the field, but can be as high as 40% to 50% (Gerhards et al. 1997). In an evaluation of site-specific, postemergence weed control of broadleaf and grass weeds in corn, Williams et al. (2000) showed a 51% reduction in rimsulfuron and an 11.5% reduction in bromoxynil plus terbuthylazine use, compared with conventional herbicide spraying. In a preliminary trial of postemergence weed-patch spraying in spring barley, a nonsignificant yield increase was observed when weeds were controlled in patches, but 41% less herbicide was used compared with whole-field spraying (Heisel et al. 1997).
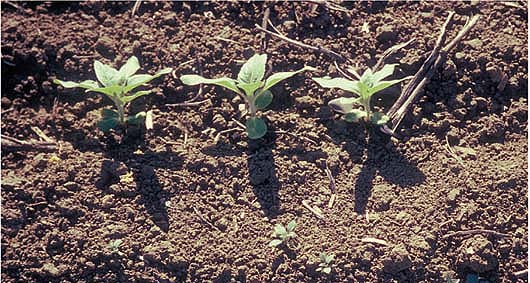
Weed maps were developed to guide variable-rate herbicide treatments in sunflower. When herbicides were applied based on the weed-seedling and mature-weed maps, 15% and 19% of the respective plots did not receive any treatment. Above, the nightshade density was low in parts of the sunflower field where no herbicide was used, indicating a good relationship with the previous year's weed population.
We tested the hypothesis that weed patches present in specific locations of a field before the previous year's harvest indicate where weeds will be present during the following growing season. Mapping these weed patches indicates where herbicides should be applied, and conversely, the absence of weeds indicates where little or no herbicide is required. Although sampling is often performed on a larger grid than the grid used for pesticide application, geostatistics allows the estimation of weed populations between sample points, and thus the application map can be made to correspond with the width of the sprayer. Our objective was to evaluate site-specific herbicide applications of a pre-emergent herbicide using two types of weed maps developed from weed counts made the previous year, and to calculate the herbicide savings.
Field test on sunflower
We conducted a variable-rate experiment on an 11-acre portion of a 79-acre field located in Yolo County. The crops were processing tomato in 1999 and sunflower in 2000. We developed weed maps from the tomato crop and used them to develop variable-rate applications the following year to sunflower. In sunflower, a pre-emergent herbicide is applied either before planting and mechanically incorporated, or after planting but before crop or weed emergence and incorporated mechanically or by irrigation. We studied the effectiveness of variable-rate application of a pre-emergent herbicide, although this technology can be used for postemergent herbicides as well.
Processing-tomato seeds were planted from May 4 to 8, 1999. A pre-emergent herbicide, napropaminde (Devrinol), was applied in an 8-inch band, centered on the crop row before tomato planting. The field was hand-weeded on May 26 and cultivated on June 3. A layby postemergent herbicide, trifluralin (Treflan), was applied on the sides of the bed and in furrows on June 20. Another hand-weeding followed on June 27. Furrows and sides of beds were again cultivated on July 26. The crop was harvested from Sept. 10 to 14, 1999.
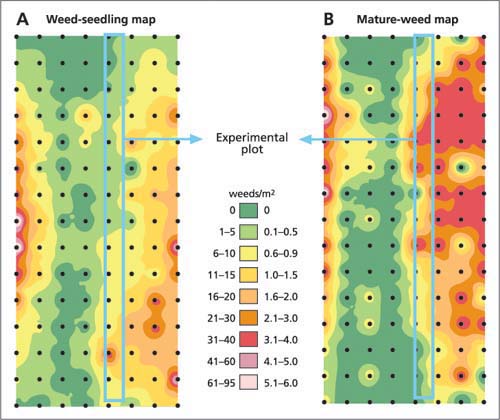
Fig. 1. Interpolated weed maps developed in 1999, based on (A) cumulative weed-seedling counts and (B) mature-weed counts.
Using weed maps developed from the 1999 tomato crop, we developed variable-rate application maps for the following year. In 2000, sunflower was planted on March 4 (male plants) and March 23 to 25 (female plants). Ethalfluralin (Sonalan) was applied postplant, pre-emergent on March 28, followed by two cultivations (May 2 and June 6). Sunflower male plants were destroyed on July 15, and female plants were harvested on July 21 to 22. Both crops were furrow-irrigated.
Weed distribution maps developed
Weed distribution was mapped in the tomato crop in 1999. The density of the weed population was assessed in two ways: (1) by cumulative weed-seedling counts throughout the crop season (May 25, June 19 and July 20, 1999)(fig. 1A) or (2) by mature-weed counts at the time of crop harvest (Sept. 9, 1999)(fig. 1B). Weed densities were estimated using a grid 165 feet wide (across beds) and 185 feet long (along the direction of beds). The measurement unit was a 20-inch-by-20-inch quadrat for seedling counts, and a 15-feet-by-17-feet grid cell for mature-plant counts. All data points were assigned north and east coordinates (georeferencing) to allow the weed maps to be spatially analyzed in a geographic information system (GIS)(ESRI, ArcView 3.1, 1996).
Weed population densities estimated by the different methods were used to create continuous weed-density maps, utilizing an interpolation method (ordinary kriging) to estimate weed densities between the sampled locations. The interpolated weed-density maps were used to create treatment maps based on weed infestation levels. The field map was divided into a matrix of cells, and the average weed infestation level was estimated for each cell.
Infestation levels were defined as weed-free (less than 10 seedlings per square yard or less than one mature plant per square yard), medium (11 to 30 seedlings per square yard or one to three mature plants per square yard) or high (more than 30 seedlings per square yard or more than three mature plants per square yard). Levels were arbitrarily set to cover the range of observed densities. Herbicide treatment maps were created by assigning varying herbicide rates to each location according to infestation levels, and dividing the field into zones receiving the same herbicide rate. Zones were marked with colored flags. (Typically, colored flags would not be needed because the GIS map information is downloaded directly into the sprayer controller; however, the sprayer we used did not have a spray controller and we used colored flags.) The three herbicide rates were 0, 0.75 and 1.50 pounds active ingredient per acre (Ib. a.i./acre) of ethalfluralin (Sonalan, 3 lb. a.i./gallon).
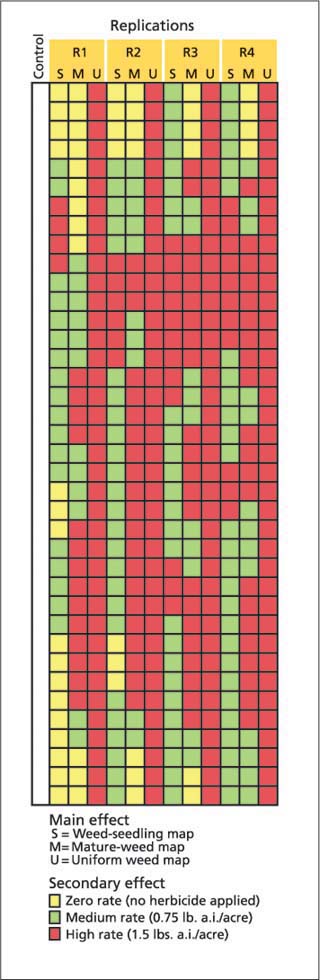
Fig. 2. Treatment map and layout of the experimental plot (split-plot design). Replications were 135 feet by 2,508 feet each; the untreated control plot was 5 feet by 2,508 feet.
A portion of the field with the steepest gradient in weed infestation was selected for a split-plot experiment. The main effect was the treatment map source (seedling counts or mature weeds), and the secondary effect was ethalfluralin rate at three levels (0.00, 0.75 and 1.50 lb. a.i./acre)(fig. 2). The main plots were 15 feet (three beds) wide and 2,508 feet long, and replicated four times. Each plot was split into 38 subplots of 15 feet wide and 66 feet long. One of the three herbicide rates was applied to each subplot based on the weed map. Each replication included a three-bed strip, which received a constant, full herbicide rate (1.50 lb. a.i./acre). One bed strip (5 feet by 2,508 feet) did not receive any herbicide application and served as an untreated control.
All plots except the control were treated on March 28, 2000. Ethalfluralin was applied to the soil surface and cultivated immediately after application to incorporate the herbicide and remove any emerged weeds. The entire study area was cultivated at that time, including plots where no herbicides were applied. The variable-rate herbicide application was evaluated by density measurements of weeds that survived the treatment. Weed density measurements were made 2, 4 and 6 weeks after the herbicide application or cultivation. Measurements consisted of visual estimates of total weed cover for each subplot and counts of weed seedlings in 100-square-inch quadrats placed randomly 10 times per herbicide level in each replication.
A prototype variable-rate applicator (VRA) developed by the UC Davis Department of Biological and Agricultural Engineering was used in the experiment (Giles and Slaughter 1997). Zones corresponding to the same treatment were marked with colored flags and rate changes were done manually. The VRA changes the application rate in about 0.1 second. The VRA traveled at a speed of 5 miles per hour (mph), resulting in 1 to 2 feet of travel before the desired application rate was reached. A 3-foot buffer area around each change in herbicide rate was delineated and excluded from measurement after the variable-rate herbicide application.
Weed surveys
The 1999 weed surveys revealed that weeds from the Solanaceae family—black nightshade (Solanum nigrum L.), hairy nightshade (Solanum sarrachoides Sendt.) and lanceleaf groundcherry (Physalis lancifolia Nees)—were the dominant weeds in this field, making up about 95% of the total weed counts. The most common grass weed was barnyardgrass (Echinochloa crus-galli [L] P. Beauv.), and yellow nutsedge (Cyperus esculentus L.) was also present, although together they covered less than 5% of the field. The other weed species present, which together covered less than 1% of the field, were: redroot pigweed (Amaranthus retroflexus L.), tumble pigweed (Amaranthus albus L.), lambsquarters (Chenopodium album L.), nettleleaf goosefoot (Chenopodium murale L.), purslane (Portulaca oleracea L.), annual sowthistle (Sonchus oleraceus L.) and prostrate knotweed (Polygonum aviculare L.).
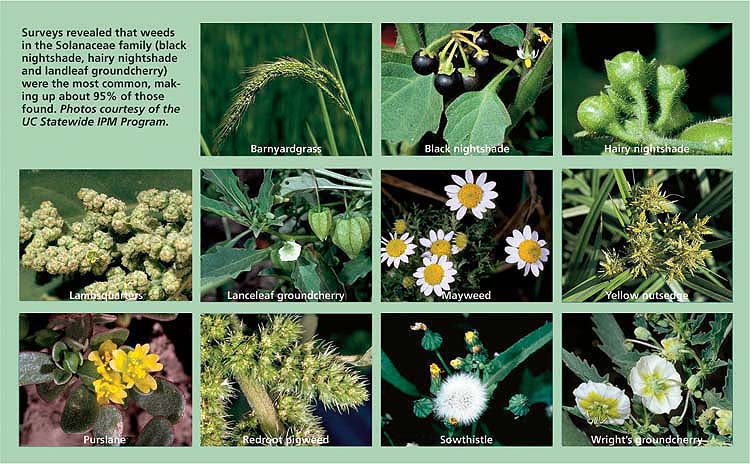
Surveys revealed that weeds in the Solanaceae family (black nightshade, hairy nightshade and landleaf groundcherry) were the most common, making up about 95% of those found. Photos courtesy of the UC Statewide IPM Program.
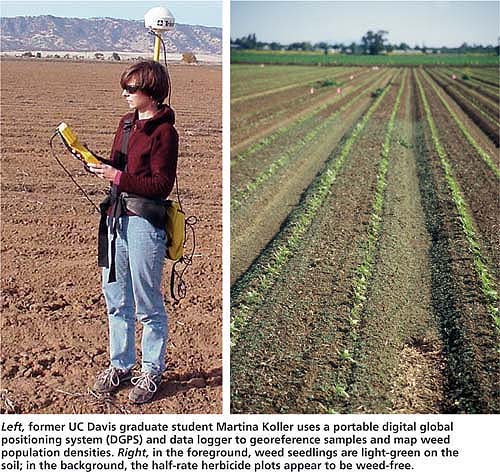
Left, former UC Davis graduate student Martina Koller uses a portable digital global positioning system (DGPS) and data logger to georeference samples and map weed population densities. Right, in the foreground, weed seedlings are light-green on the soil; in the background, the half-rate herbicide plots appear to be weed-free.
The cumulative weed-seedling density throughout the growing season was 35.6 plants per square yard, and average mature-plant density was 1.2 plants per square yard. Eighty-five percent of all weeds were from the Solanaceae family (seedlings averaged 28.8 plants per square yard; mature plants, 0.8 plants per square yard) and therefore, these were used for the subsequent development of weed density maps. The dominance of a few weed species in arable fields is characteristic of different cropping systems (Forcella et al. 1992). Since tomato was the crop in 1999, it was reasonable to expect that weeds escaping control would be from the same family (Solanaceae). Members of the same family of plants have similar physiology, which would make them less susceptible to herbicides used in that crop. The combination of hand-weeding, cultivation and herbicide treatment reduced the number of weeds reaching maturity. As a result, mature-weed density in the 1999 tomato field was much less than the seedling density.
Two weed-density maps were used for the variable-rate herbicide experiment: one created from seedling counts and another based on mature-weed counts. The weed-seedling map was based on cumulative counts of the seedlings. For example, three field surveys were conducted during the 1999 season. Weed densities and distribution measured from the three surveys had a high degree of spatial correlation, indicating that highly infested areas of the field had high densities of nightshade weeds throughout the season. For the tomato crop, it was observed that the weed-seedling density was highest in June, 1.5 to 2 months after planting (fig. 3). Conditions were ideal for nightshade emergence in June given the warm temperatures and a tomato canopy that was still open enough for light to reach the soil surface. Cultivation occurred after the May seedling counts and may have moved seed into the ideal position for germination and subsequent irrigation.
Impact of map source
Where no herbicides were applied, weed cover was significantly less when using the mature-weed map, because it better-estimated weed cover the following year (fig. 4). There was no significant difference between map source for the 0.75 and 1.5 lb. a.i./acre herbicide rates. Based on seedling emergence 2 weeks after application, overall weed control was significantly better when the treatment maps were based on mature weeds with 58 weeds per square yard than on seedlings, which had 142 weeds per square yard. Weed cover was significantly less at 2 and 4 weeks after herbicide application when treatments were based on mature-weed maps compared with seedling maps, but did not differ at 6 weeks after treatment (fig. 5).
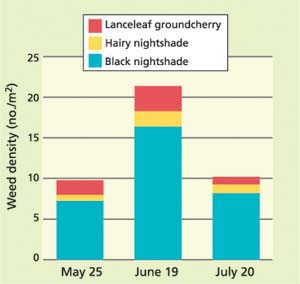
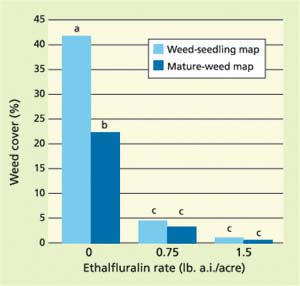
Fig. 4. Weed cover 2 weeks after experiment was initiated, as visually assessed in each subplot. Same letters indicate no significance; different letters indicate significant difference between treatments at the 0.05 significance level based on LSD multiple pairwise comparison test.

Fig. 5. Weed cover at 2, 4 and 6 weeks after variable-rate application, averaged over the three herbicide rates. Weed cover was visually estimated in each subplot. 0 = no weeds present. Different letters indicate significant difference between treatments at the 0.05 significance level based on LSD multiple pairwise comparison test.
Weed cover when no herbicide was applied ranged from 15% to 55%, 2 weeks after the experiment was initiated. High weed cover on some no-herbicide plots points to a major pitfall of map-based, variable-rate applications of pre-emergent herbicides: Locations where no weeds were predicted to grow received no herbicide. This prediction was based on the presence or absence of weeds the previous year. The treatment map shows the no-herbicide plots in the middle of the field surrounded by plots receiving medium and high rates. Although this location was predicted to have weeds below the treatment threshold, weed seedlings emerged here the following year. Redistribution of seeds during harvest is probably the main reason for poor estimates in the no-herbicide areas, although other factors, such as seed dormancy and movement of seed by water or animals may also be a factor.
Reduced rates of herbicide
There was a significant difference in weed control among herbicide rates. The no-herbicide plots had the highest number of seedlings, averaging 86 plants per square yard, 2 weeks after the experiment was initiated. The average number of surviving seedlings in the medium-rate plots was significantly lower, nine plants per square yard. The plot with ethalfluralin at the full rate had the least number of weeds (four plants per square yard), but there was no statistically significant dif ference between the half rate and full rate. All plots receiving the medium or full herbicide rate had weed cover below 10%, 2 and 4 weeks after application.
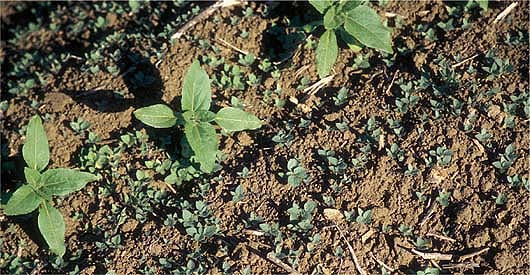
In some parts of the field where no herbicide was used, nightshade density was high, probably due to the redistribution of seeds during harvest.
Black nightshade and hairy nightshade were the only weed species surviving the high-rate treatment in relatively higher numbers. Occasionally, mayweed (Anthemis cotula L.), Wright's groundcherry (Physalis wrightii Gray) and volunteer tomato (Lycopersicon esculentum L.) survived the 1.5 lb. a.i./acre rate of ethalfluralin. Weed species composition after the 0.75 lb. a.i./acre treatment of ethalfluralin was similar, but also included a few surviving seedlings of lambs-quarters. Weed composition on plots that received no herbicide resembled the 1999 weed survey and included barnyardgrass, black nightshade, hairy nightshade, redroot pigweed, annual sowthistle, Wright's groundcherry, cheeseweed (Malva neglecta Wallr.), purslane and lambsquarters.
Generally, higher weed-seedling survival after reduced herbicide-application rates is typical. Griffin et al. (1992) reported lower weed control with reduced rates of soil herbicides in soybean fields. Preplant incorporated application of imazaquin at the full rate (0.125 lb. a.i./acre) gave 95% control, whereas the half rate (0.062 lb. a.i./acre) gave 88% control. Greater seedling survival after reduced herbicide rates may be due to the density thresholds used in this study.
For example, Williams et al. (2000) used a reduced rate at or below one seedling per square yard of Polygonum aviculare in corn. Norris et al. (2001) recommended economic thresholds of one barnyardgrass plant per 50 feet of tomato crop row. A relatively high weed-density threshold used for the no-herbicide plots was probably responsible for the low success of the no-herbicide approach in this experiment. The threshold for the zero rate was defined as a seedling density below 10 plants per square yard and for mature plants, as less than one weed plant per square yard. Since treatment maps were based on counts of emerged plants, the threshold for the no-herbicide rate should be set to zero weed plants per square yard.
In this experiment, areas treated with the medium rate had about 5% weed cover at 2 and 4 weeks after application and about 12% at 6 weeks; whereas, the high-rate plots had about 2% weed cover at 2 weeks, 5% at 4 weeks and 8% at 6 weeks. Increases in weed cover over time are due to herbicide decomposition in the soil, although ethalfluralin persists for a long time, with an average field half-life of 60 days (WSSA 2002).
High or full herbicide rates should only be applied to high-density weed patches. However, even the full herbicide rate was not able to control weeds in highly infested areas. Other researchers have also observed that weed clumps persist despite uniform full-rate treatment (Dieleman and Mortensen 1999). High weed-density areas may require a slightly higher rate than what is currently considered full rate, assuming crop tolerance is sufficient. Variable-rate herbicide applications could allow higher rates to be applied in high weed-density areas, while still applying less herbicide to the field as a whole.
Herbicide savings
When the herbicide application was based on the seedling map, 15% of the experimental area did not receive any herbicide and 63% received a medium rate. The treatment map indicated that 2.18 acres of the site were treated with 0.75 lb. a.i./acre, 0.75 acre with 1.5 lb. a.i./acre, and 0.52 acre with no herbicide. A 47% reduction in herbicide use was achieved with the seedling-map approach when compared with a uniform full-rate application. Reduced rates were applied to 78% of the experimental area.
The treatment map that we developed based on mature plants recommended that 1.02 acres of the site be treated with 0.75 lb. a.i./acre, 1.77 acres with 1.5 lb. a.i./acre, and 0.66 acre with no herbicide. Nineteen percent of the experimental area did not receive any herbicide and 30% received the 0.75 lb. a.i./acre rate. A 34% reduction in herbicide use was achieved with the variable-rate application based on a mature-plant weed map when compared with a uniform full-rate application, and 49% of the experimental site received a reduced herbicide treatment.
Since using no herbicide may present too much risk for many growers — particularly in the early stages of adoption for precision weed management — rates may be limited to medium and high applications, in which case the herbicide reduction would have been 39% for the seedling-map and 24% for the maturemap approach.
Time-cost analysis
It took approximately 20 seconds to count mature weeds in each 32-square-yard measurement area. Depending on the level of experience, it would take 2.2 to 6.6 hours to count the weeds in 100 acres (approximately 400 cells). In the variable-rate experiment, a 34% herbicide reduction was achieved with the mature-weed map approach. At a commercial price of $50 per gallon for the herbicide Sonalan, savings were $17. It would take $22 to produce a detailed weed map (at a cost of $10 per hour of labor skilled in weed surveying). In this scenario — based on a mature-weed map — no financial benefits would be achieved. In the case of the weed-seedling map approach, where a 49% herbicide reduction and $24 herbicide cost savings was achieved, plus the approximate $22 cost of a weed map, variable-rate application brings some modest financial benefits of about $2 per acre.
However, we did not account for the conversion of a weed map into an herbicide treatment map in this estimation of economic returns. Our economic analysis should be verified in another study before a firm decision is formed about the economic value of variable-rate technology. The economic efficiency of site-specific herbicide application depends on the cost of herbicide, cost of producing the weed map and treatment map, and the spatial characteristics of the weed population. Since weed distribution within a field is slow to change, maps created in one year may be useful for several years. Additionally, there are research efforts currently examining the use of camera systems to mechanically map weeds, which will likely decrease the cost of weed mapping and improve its accuracy, since a greater portion of the field will be sampled.
Maps reduce application rates
The results from this experiment show that when information about the spatial distribution of the previous year's mature weeds is used, weed control in terms of subsequent weed cover is comparable to uniform one-rate herbicide application, while simultaneously the total amount of herbicide applied decreases.
We conclude that variable-rate spraying based on maps created from estimating weed population density and levels of infestation just before harvest gave the best weed control. However, further improvement is likely when the prediction and modeling of weed-seed redistribution from harvest to application time is incorporated into treatment maps. The simulation of seed movement from the measurement event to herbicide application should be incorporated in any preemergent treatment map.
Site-specific herbicide applications based on weed maps provide effective control

