


All Issues
Monitoring helps reduce water-quality impacts in flood-irrigated pasture
Publication Information
California Agriculture 59(3):168-175. https://doi.org/10.3733/ca.v059n03p168
Published July 01, 2005
PDF | Citation | Permissions
Abstract
Northern California has extensive areas of irrigated pasture, which provide critical summer forage for livestock. In many of these systems, water is diverted directly from a stream into ditches or pipes and transported to individual pastures, where it is applied as flood surface irrigation. Our case study of discharges from irrigated pastures on Willow and Lassen creeks in Modoc County illustrates an assessment and monitoring approach for land managers and natural-resources professionals working to resolve water-quality impairments related to agricultural discharges from similar systems. We report correlations between four indicator variables measured in the field and the variables determined in the laboratory, to evaluate the potential for employing a strategic combination of the two.
Full text
Northern California has extensive areas of irrigated pasture, which provide critical summer forage for livestock. The irrigation season on these pastures can last from April through September, depending upon factors such as elevation, annual precipitation and site-specific water rights. In many of these irrigated-pasture systems, water is diverted directly from a stream into ditches or pipes and transported to individual pastures, where it is applied as flood surface irrigation. Irrigation frequency varies from continuous to regularly scheduled applications.
It is common for a significant amount of runoff to be generated from pastures during flood irrigation. In previous research, 40% to 70% of irrigation water applied to pastures in the Sierra Nevada foothills became runoff (Bedard-Haughn et al. 2004; Tate et al. 2001). Irrigation runoff can transport non-point-source pollutants such as nutrients, sediment and pathogens into downstream waters as well as increase stream temperatures.
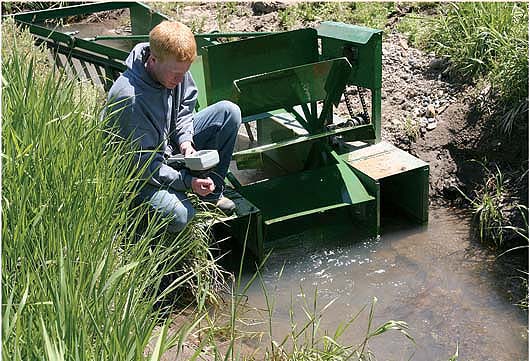
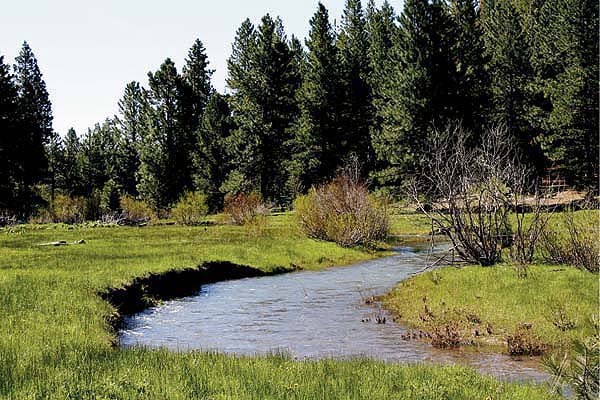
Irrigated pasture provides critical summer forage for California livestock, but the environmental impacts on fish of diverting streams to pastures are coming under increasing regulatory scrutiny. Above, Shannon Cler, UC Davis postgraduate researcher, measures dissolved oxygen in a delivery ditch in lower Lassen Creek.
In the past, such agricultural discharges within the boundaries of the Central Valley Regional Water Quality Control Board (CVRWQCB) were allowed under a conditional waiver granted by the CVRWQCB (2005). The CVRWQCB includes the Sacramento and San Joaquin river systems and tributaries, as well as terminal basins such as the Tulare Basin in the southern Central Valley and Goose Lake in extreme northeastern California. Recent review of this waiver by CVRWQCB — following a petition by concerned stakeholder groups to rescind the waiver — has resulted in a new compliance process for coalitions of agricultural operators, as well as individual operators who discharge irrigation runoff into water bodies within the boundaries of CVRWQCB.
This compliance process has increased the need for efficient methods by which irrigators can (1) assess the quality of irrigation water discharged from their fields, (2) improve the quality of discharges that degrade downstream waters, and (3) monitor to ensure that downstream water-quality degradation is eliminated. Agricultural operators are concerned about the potential costs and management constraints associated with this compliance process. We present the results of an irrigated-pasture case study to illustrate an assessment and monitoring approach for land managers and natural-resources professionals working to resolve water-quality impairments related to agricultural discharges from similar systems.
Modoc County study site
This study was conducted on the lower reaches of Lassen and Willow creeks in northeastern Modoc County (in the northeastern-most corner of California). Stream flow in both streams is generated by snowmelt in the higher elevations of each watershed, with flows peaking in early spring (April until mid-May) and diminishing significantly by the end of July. Stream flow from both creeks is diverted into open irrigation delivery ditches starting in May and ending in June or July, depending upon annual snowpack and stream-flow levels.
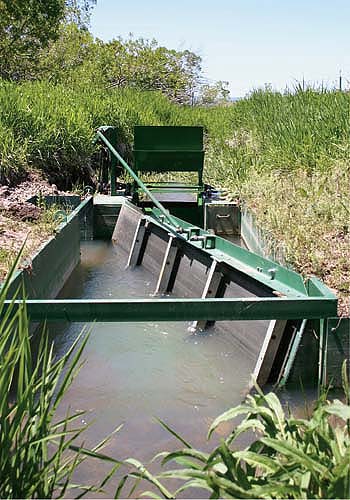
A self-cleaning fish screen at a stream-flow diversion on lower Lassen Creek prevents fish from entering irrigation delivery ditches and becoming stranded.
During the 2003 irrigation season, when we conducted our study, flow was diverted through July from Lassen Creek and through June from Willow Creek. Diverted water is applied as flood irrigation continuously to pastures grazed by beef cattle, and during June and the first week of July to hay meadows. A substantial volume of this irrigation water returns to the creek it originally came from both as surface runoff in ditches and shallow swales, and as subsurface flow. There are four pastures in the Lassen and Willow creek systems ranging from 34 to 95 acres, with irrigation application rates (cubic feet per second [cfs] per acre) varying between and within pastures from 0.01 to 0.13 cfs per acre. Total applied water (acre-feet per irrigation event or season) is quite variable, with some pastures receiving 2 to 3 daylong irrigation events and others irrigated continuously.
Monitoring scheme
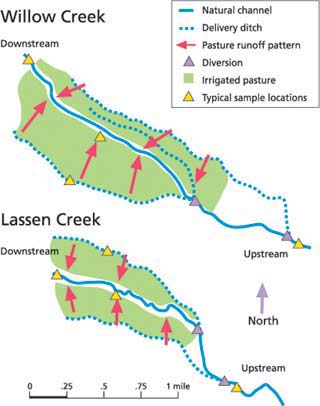
In late May 2003, 30 permanent sampling locations were established across the Lassen (n = 15) and Willow (n = 15) creek irrigation systems. Sample locations were selected to provide water-quality and flow-volume data from (1) each creek above the irrigation diversion, (2) along all irrigation-water delivery ditches, (3) all pasture surface-runoff ditches and swales immediately above the return of pasture runoff to the natural stream channel, and (4) each creek below all pasture runoff (fig. 1). We did not attempt to sample or measure subsurface return flow, and each site was monitored in June and July.
Flow volume (cfs), electrical conductivity (deciSiemens per meter [dS/m]), turbidity (nephelometric turbidity units [ntu]) and dissolved oxygen (milligrams per liter [mg/L]) were measured weekly at each sampling location using standard field-sampling equipment. In addition, approximately half of all the water samples were analyzed for total suspended solids (TSS), nitrate (NO3), ammonium (NH4), phosphate (PO4), sulfate (SO4), potassium (K) and dissolved organic carbon (DOC) using standard laboratory techniques. Water temperature was monitored every half hour at each sampling location in June and July using commercially available automatic recorders.
This sampling strategy allowed us to: (1) examine above and below in-stream water-quality changes due to irrigation; (2) examine changes in water quality as irrigation water passed through delivery ditches and across pastures; (3) account for differences in flow volume for each water source (in-stream/ above, delivery ditch, pasture runoff and in-stream/below); and (4) account for changes in water quality and flow over the course of the 2-month irrigation season. Due to the availability of relatively inexpensive and accurate field meters, four water-quality variables (electrical conductivity, turbidity, water temperature and dissolved oxygen) can serve as “indicators,” which can be monitored frequently in the field with appropriate training and quality-control procedures. In contrast, laboratory-based water-quality analysis (such as of nitrate and phosphate) is relatively expensive and time-sensitive, while sample analysis for other water-quality constituents (such as ammonium or bacteria) must be done within 24 hours of collection.
Delivery ditches transport water from stream diversions and deliver it to irrigated pastures. The authors collected water-quality data from streams above and below such pastures, as well as from pasture runoff and delivery ditches.
Irrigators need field-based, rapid, inexpensive and defensible monitoring tools to use across many acres of pasture, providing real-time data to facilitate daily operational decisions and adaptive management to minimize water-quality impairment. We report correlations between the four indicator variables measured in the field and the variables determined in the laboratory, to evaluate the potential for employing a strategic combination of the two.
Impact on in-stream flow volume
Excessive irrigation diversion can reduce in-stream flow levels, which in turn can result in the reduction of available aquatic habitat, elevated stream temperatures ( see pages 153 and 161 ) and increased pollutant concentrations. Managers can determine the impacts that irrigation practices are having on stream flow by measuring the diversion volume and in-stream flow volumes above and below the system.
Our pasture-runoff estimates are only for surface runoff, because we had no means to estimate subsurface returns to either creek. Stream-flow volumes were lower in Willow Creek than in Lassen Creek (fig. 2). A larger percentage of Willow Creek was diverted for irrigation, with a peak of 78% on July 1, and during the next week irrigation diversion ceased due to dropping water levels. A lower percentage of Lassen Creek was diverted for irrigation, with a peak of about 68% on July 9, and after this, less water was diverted because irrigation was discontinued on about half of the adjacent pasture area due to dropping water levels.

TABLE 1. Statistics for laboratory-determined water-quality variables across Lassen and Willow creek study sites, June-July 2003 irrigation season
This data reveals that the diversion of water to irrigate pastures adjacent to these streams is reducing in-stream flow by 0.5 to 6.0 cfs over the course of the summer, and that stream-flow reductions are more pronounced on Willow Creek than on Lassen Creek. This implies that water quality is more likely to be degraded in Willow Creek due to greater in-stream flow reductions and its reduced ability to buffer against contaminants in return flow.
Water-quality effects
To assess the cumulative impact of runoff and reduced stream flows on water quality, above and below in-stream monitoring is also needed. Measuring these indicator water-quality variables in the field can provide managers with realtime information on the potential impacts of their irrigation practices (fig. 3).
Electrical conductivity and dissolved nutrients
Electrical conductivity is a measure of the ability of water to conduct electricity (dS/m). It can serve as an inexpensive surrogate for laboratory-based chemical analysis. This is because the electrical conductivity of the water generally increases as the levels of dissolved pollutants (such as nitrate, ammonium, phosphate, sulfate and potassium) increases.
However, laboratory-based chemical analysis on a subset of samples is also necessary to appropriately interpret conductivity data from individual systems. Stream-flow diversions can increase conductivity by concentrating the existing dissolved pollutants within the stream and transporting new pollutants from pastures in runoff. In-stream conductivity was significantly higher (P = 0.005) below the irrigation systems on both Lassen and Willow creeks, indicating that at least some dissolved constituent concentrations did increase as a result of irrigation diversion and return (fig. 3).
Laboratory analysis indicated that the increase in electrical conductivity observed below the irrigation systems was at least in part due to increases in the concentrations of potassium and sulfate (tables 1 and 2). While these increases do not represent a significant water-quality problem, they indicate the loss of important plant nutrients from the pastures (table 1). In addition, mineral nitrogen levels appeared to be low in these streams and pastures, with nitrate and ammonium levels only slightly above detection limits (0.001 ppm), and well below those of water-quality concern (for example: the nitrate drinking-water standard is 10 ppm, and mineral nitrogen [nitrate plus ammonium] stream-eutrophication levels of concern are greater than 0.1 ppm) (table 1). While phosphate concentrations in pasture runoff were above levels of concern for stream eutrophication (> 0.01 ppm), they did not appear to increase below the irrigation system.
When considering water-quality parameters such as nutrients and sediments, it is important to examine both concentration and load (concentration times flow volume). For instance, given that flow volume is reduced below the irrigation system, there is no likely increase in the phosphate load due to this particular irrigation system. In addition, it is also prudent to examine total nitrogen and phosphorus levels in runoff in a complete evaluation for water-quality impacts.
Turbidity, total suspended solids and dissolved organic carbon
Turbidity is a measure of the cloudiness or opaqueness of a water sample, and it increases with the level of suspended solids (such as particulate organic matter and sediments ≫ 0.45 micrometer [μm] in size) and dissolved solids (such as dissolved organic carbon < 0.45 μm in size)(table 1). The transport of organic matter and sediment in pasture runoff can increase in-stream turbidity levels; however, well-vegetated pastures can also serve as sinks, or filters, for suspended solids. Furthermore, when stream water used for municipal drinking water has high levels of certain types of dissolved organic carbon (DOC), the chlorination process can generate carcinogenic byproducts (Krasner et al. 1989).
![In-stream flow volumes, pasture runoff volumes (cubic feet per second [cfs]) and stream-flow diversion for pasture flood irrigation from Willow and Lassen creeks, June and July 2003.](http://ucanr.edu/sites/calagjournal/archive/?image=fig5903p171a.jpg)
Fig. 2. In-stream flow volumes, pasture runoff volumes (cubic feet per second [cfs]) and stream-flow diversion for pasture flood irrigation from Willow and Lassen creeks, June and July 2003.
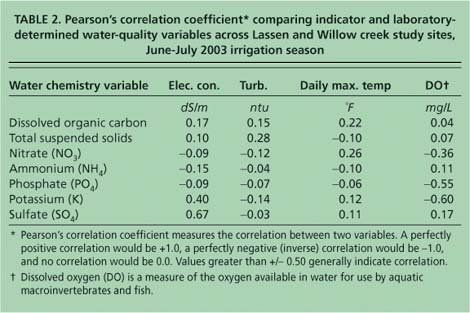
TABLE 2. Pearson's correlation coefficient* comparing indicator and laboratory-determined water-quality variables across Lassen and Willow creek study sites, June-July 2003 irrigation season
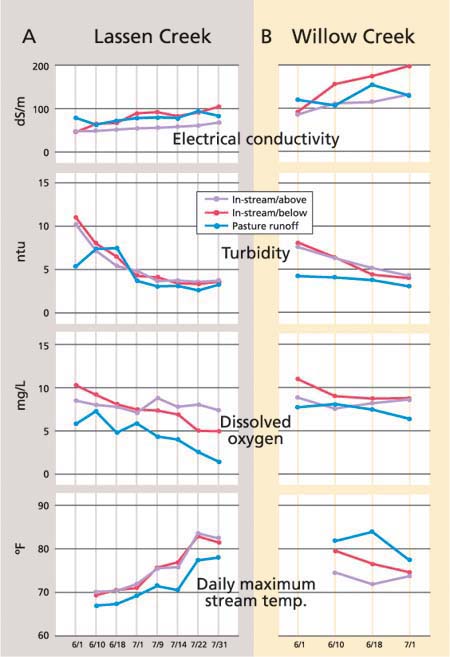
Fig. 3. Indicator water-quality levels in (A) Lassen and (B) Willow creek irrigated-pasture systems, June and July 2003.
The levels of turbidity and total suspended solids were not significantly higher below than above the irrigation systems on Lassen and Willow creeks (P = 0.35)(fig. 3, table 1). However, during the first 3 weeks of irrigation on Lassen Creek, the turbidity of the runoff was elevated. This is likely due to an initial flushing of suspended and dissolved solids from the pastures (Tate et al. 2001). The turbidity of irrigation water increases as it travels through delivery ditches, which are bare earth and add suspended solids via erosion (table 1). As the irrigation water travels across these well-vegetated pastures, total suspended solids and turbidity are reduced due to filtration, as demonstrated by the relatively low levels in pasture runoff. However, as water moves through the system, DOC increases slowly but steadily and is slightly higher in the creeks below the pastures.
Dissolved oxygen and temperature
Dissolved oxygen and stream temperature are critical variables in determining habitat quality for cold-water fisheries and stream mac-roinvertebrates. The concern is that irrigation systems can reduce dissolved oxygen below critical levels (4 to 6 mg/L) and raise stream temperatures to levels suboptimal (67°F to 76°F) and lethal (> 77°F) for cold-water fisheries. Dissolved oxygen in a stream has a natural diurnal pattern: levels are highest in mid- to late afternoon due to oxygen production by photosynthe-sizing aquatic plants, and are lowest before dawn due to the plants' nighttime respiration (oxygen consumption). Dissolved oxygen can be decreased by adding nutrients (which can stimulate aquatic plant growth and so oxygen consumption due to respiration), by reduced stream flow (which decreases water mixing and, in turn, reoxygenation) and by increased stream temperature. Water temperature can be increased by reduced stream flow and as well as by flow in shallow sheets across pastures ( see page 161 ). In some instances, water temperatures are lower in irrigation discharge that returns to streams beneath the soil surface (Stringham et al. 1998); however, these subsurface water returns often also have low dissolved-oxygen levels.
Minimum and mean dissolved-oxygen levels were reduced in pasture runoff from Willow and Lassen creeks, but within a significantly variable range (fig. 3). This variability was due to the amount of turbulence (mixing) in each runoff ditch and swale sampled, with turbulent pasture runoff having the highest dissolved-oxygen levels. Since dissolved oxygen is dependent upon the time of day, a direct comparison of readings from different times is difficult. All of our reported readings were made between 10 a.m. and 3 p.m. Linear regression analysis indicated that there was no significant effect of time of reading on dissolved-oxygen levels under our sample strategy (P > 0.1). If dissolved-oxygen levels are of significant concern, managers should take readings at predawn or dawn, when levels are at their lowest.
The effect of these irrigation systems on daily maximum stream temperature varied (fig. 3). In Willow Creek, stream temperatures were increased as much as 5°F below the pastures. This could be due to the observed warming of pasture runoff, in-stream flow reductions, or most likely a combination of both processes. In contrast, in Lassen Creek, stream temperatures were the same above and below the pastures. Pasture runoff was actually cooler by several degrees than the original stream temperature. Additional monitoring and observation are needed to determine why return flows are cooler in Lassen Creek, but identifying the reason could lead to the development of management strategies to reduce the temperature of agricultural discharges from these systems.
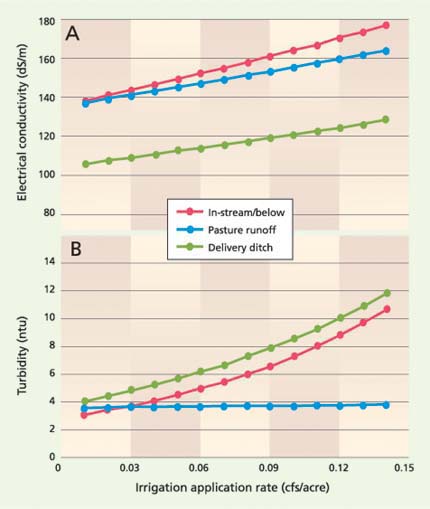
Fig. 4. Relationship between irrigation application rate and (A) electrical conductivity and (B) turbidity, developed from linear mixed-effects analysis of data collected from Willow and Lassen creeks, June and July 2003.
It is important to note that stream temperatures in Willow Creek are inherently 5°F to 10°F warmer than in Lassen Creek ( see page 161 ). In addition, the percentage of stream flow diverted from Willow Creek is much greater (30% to 40%) than from Lassen Creek (fig. 2), resulting in lower remaining in-stream flow levels, which we have shown can increase stream temperatures ( see page 161 ). Moreover, pasture-surface runoff volumes are approximately the same in the two creek systems, but pasture runoff is a larger component of in-stream flow below the pastures on Willow Creek. Thus, the temperature of pasture runoff is more likely to influence in-stream temperatures on Willow Creek. It is possible that there is more subsurface return of pasture runoff on Lassen Creek, which could be cooler than surface returns (Stringham et al. 1998). Cooler surface return flows from Lassen Creek could be the result of the re-emergence of infiltrated water at the bottom of fields.
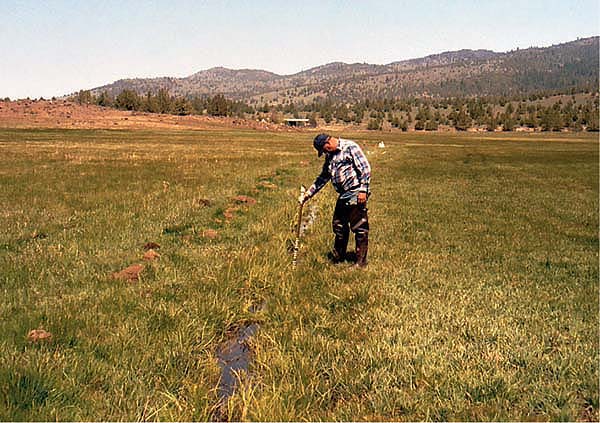
Managers can use site-specific information to alter variables such as irrigation timing and frequency, in order to mitigate water-quality impacts. Don Lancaster, UCCE Modoc County natural resources advisor, monitors the delivery ditch in an irrigated pasture.
Irrigation rates and water quality
Site-specific information on how irrigation decisions affect agricultural discharge and stream water quality is of particular value to managers, who control practices such as the application rate and frequency of irrigation. If runoff water quality is a problem, opportunities to reduce those impacts via alternative irrigation practices should always be investigated. While the graphical analysis shown allows one to observe and evaluate pollutant levels in discharge above and below the management system, this approach provides limited guidance on opportunities to improve discharge quality. If variables (such as irrigation-water application rate, irrigation frequency and fertilization levels) are monitored and quantified simultaneously with the water-quality and flow data, all the data can be analyzed to identify the relationships between management decisions and resulting water quality.
To illustrate, we examined this data set for relationships between irrigation-water application rate (cfs/acre), flow volume (cfs) and water source (in-stream/above, delivery ditch, pasture runoff and in-stream/below), electrical conductivity, turbidity and dissolved oxygen. We used a linear mixed-effects analysis. The fixed effects were irrigation application rate, flow volume and water source. Day (June 1 = 1, July 31 = 61) was included as a fixed effect to account for seasonal trends in variables such as stream flow. Sample location was treated as a group effect to account for codependence due to repeated measurements (Pinheiro and Bates 2000). Electrical conductivity and turbidity data were natural log transformed to normalize residuals. This analysis provides a robust determination of differences in water quality above and below the pasture systems, with statistical control of flow-volume differences (fig. 4)( see page 161 ). The full results of this analysis are not shown, rather plots depicting significant (P ≪ 0.05) relationships between irrigation management and water quality in delivery ditches, pasture runoff and in-stream/below are presented and discussed; the full analysis is available upon request from the lead author.
Electrical conductivity
Electrical conductivity for delivery ditch, pasture runoff and in-stream/below increased significantly as irrigation application rate increased, responding to the potential for increasing pollutant transport. Conductivity was also positively correlated to day, indicating that levels increased as the season progressed (fig. 3).
A significant, negative, irrigation-rate-by-day interaction indicates that the increase in electrical conductivity realized with increased irrigation application rate became less pronounced as the season progressed, due to the flushing and loss of available soluble pollutants for transport from the pasture. It is possible that this conductivity increase became less pronounced over time because the longer a pasture is irrigated, the fewer available soluble pollutants remain to be flushed out and transported from the pasture. This tapering conductivity increase may also be due to the uptake of available soluble nutrients by pasture grasses as plant growth rates increase in the summer. A significant negative relationship between flow volume and electrical conductivity accounts for the potential dilution of additional volume, given a relatively limited soluble pollutant supply. This further illustrates the importance of measuring flow simultaneously when collecting water-quality samples. Reductions in irrigation application rates will result in lowered levels of dissolved pollutant transport from pastures and higher downstream flow volumes, which can dilute solutes returned as pasture runoff.
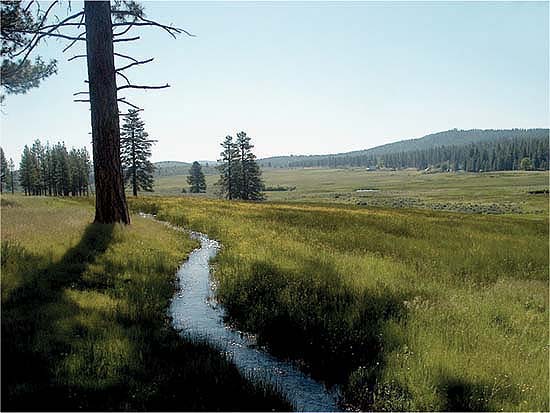
Water-quality variables such as dissolved oxygen and stream temperature are dependent upon factors such as stream flow and shade. Lassen Creek flows through a meadow reach with a naturally low vegetative canopy.
Turbidity
There was a positive, significant relationship between irrigation rate and turbidity, reflecting an increasing flushing and transportation potential for total suspended solids with increasing irrigation application rate. However, there was a significant irrigation-rate-by-water-source interaction, indicating that the positive relationship was only valid for in-stream/below and delivery ditches (fig. 4B). Pasture runoff turbidity was not dependent upon irrigation rate, indicating the capacity of the pasture to act as a filter and remove suspended solids contributed by source water and bare delivery ditches. As with electrical conductivity, there was a negative interaction between irrigation rate and day, indicating that the increase in turbidity realized with increased irrigation application rate becomes less pronounced as the season progresses.
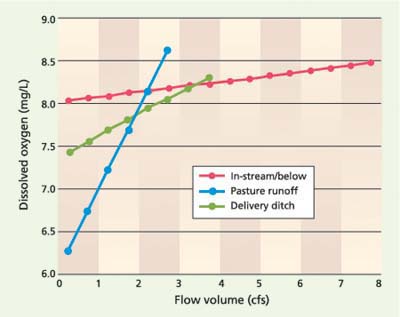
Fig. 5. Relationship between dissolved oxygen and flow volume developed from linear mixed-effects analysis of data collected from Willow and Lassen creeks, June and July 2003.
These results indicate that, as with soluble nutrients, reductions in irrigation application rate will reduce turbidity levels in pasture runoff. These pastures appear to have the capacity to serve as sinks for solids (sediment and particulate organic matter) in source water and contributed by delivery ditches, but when the irrigation rate exceeds about 0.09 cfs per acre (in this instance, given these pasture sizes), this filtering capacity is exceeded and in-stream turbidity levels below the pasture become higher than above.
Dissolved oxygen
Dissolved-oxygen levels in delivery ditches, pasture run-off and in-stream/below were directly related to flow volume (fig. 5). In this system, flow volume in delivery ditches, pasture return and in-stream/below were determined by irrigation application rate, so that dissolved oxygen was indeed affected by irrigation management. Flow velocity and turbulence increased as flow volume increased, resulting in greater oxygenation and thus dissolved-oxygen levels at higher flow volumes. Pasture return had the greatest correlation to flow volume, indicating that low dissolved-oxygen levels in return flow were offset at high runoff volumes. In-stream/below dissolved-oxygen levels were also positively related to flow volumne.
These results indicate that maintaining in-stream flow volumes by reducing diversion volumes will reduce the impact that these irrigated-pasture systems have on in-stream dissolved-oxygen levels. In addition, increasing pasture runoff volume will increase dissolved-oxygen levels in return flow. However, this will also increase the potential for the transport of pollutants from pastures (fig. 5). Water managers should identify and implement opportunities to reduce return flow volume, but also allow for the mixing of return flow, such as weirs, plunge-pools and cobbled return ditches.
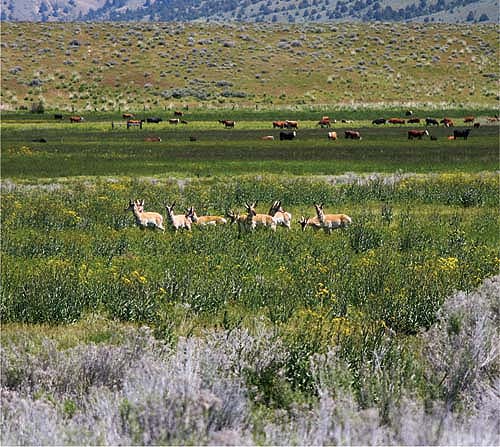
While some water-quality variables in the studied streams were impaired by stream diversions and flood irrigation, the impacts were relatively low and measures to mitigate them are available. Irrigated pasture on Willow Creek provides forage to livestock and sometimes pronghorn antelope.
Management and monitoring
Compliance with water-quality standards and targets will continue to be a major challenge for California agriculturalists who discharge water from irrigated fields and pastures. This case study is an example of how to employ water-quality monitoring techniques and logic to address specific information needs to aid or facilitate compliance with water-quality standards. The information gathered under this approach indicates that while some water-quality impairment is associated with stream diversion and flood irrigation on these particular streams, these impacts are relatively small and there are clear measures available to mitigate them. Similar techniques and logic can be applied to other agricultural systems to address similar concerns (such as pesticides and pathogens) and to provide management solutions.
Indicator water-quality variables such as electrical conductivity, turbidity, water temperature and dissolved oxygen should be considered to supplement laboratory-based water-quality analyses. Electrical conductivity can be a valuable real-time indicator of increased dissolved pollutant concentrations in runoff or receiving bodies of water. Some conductivity and dissolved pollutant data must be collected simultaneously to establish site-specific correlations and to ensure the proper interpretation of the conductivity data.
Critical components of waterquality compliance include farm-scale assessments of agricultural discharges, potential water-resource impairments, and the implementation of management measures and effectiveness monitoring. In developing such on-farm programs, agriculturalists should establish specific monitoring objectives as well as a framework of sample-site location and collection frequency that is synchronous with agricultural discharge patterns. Farm-scale monitoring programs should target the specific pollutants of concern in receiving waters (such as a stream with high nitrogen levels) and on-site agricultural practices that could generate the pollutant (such as nitrogen fertilization of a pasture). For instance, we would have included indicator bacteria (such as fecal coliforms, Escherichia coli) in our monitoring if Lassen and Willow creeks were sources of municipal drinking-water supplies. Opportunities to use monitoring data to quantify relationships between specific agricultural management practices and resulting water quality should be capitalized upon to increase both site-specific knowledge and the return on financial investments in monitoring.
Monitoring helps reduce water-quality impacts in flood-irrigated pasture

