


All Issues
Deep vadose zone hydrology demonstrates fate of nitrate in eastern San Joaquin Valley
Publication Information
California Agriculture 59(2):124-132. https://doi.org/10.3733/ca.v059n02p124
Published April 01, 2005
PDF | Citation | Permissions
Abstract
The sustainability of water resources is key to continued prosperity in the San Joaquin Valley and California. The vadose zone is an often-ignored layer of wet but unsaturated sediments between the land surface and the water table. It plays an important role in groundwater recharge and in controlling the flux and attenuation of nitrate and other potential groundwater contaminants. In a former orchard at the UC Kearney Research and Extension Center, we investigated the processes that control the movement of water, nitrate and other contaminants through the deep vadose zone. These processes were found to be controlled by the alluvial sedimentary geology of the vadose zone, which is highly heterogeneous. This heterogeneity should be considered when interpreting soil and deep vadose zone monitoring data and assessing of the leaching potential of agricultural chemicals. The transport of contaminants through the vadose zone may be significantly faster than previously assumed, while denitrification is likely limited or insignificant in the oxic, alluvial vadose zone of the eastern San Joaquin Valley.
Full text
For decades, the leaching of agricultural chemicals (fertilizer, especially nitrate, and pesticides) has been a concern of agronomists, soil scientists and hydrologists. Federal legislation first recognized the potential impacts to water resources in the early 1970s, when the Clean Water Act, the Safe Drinking Water Act, the Federal Insecticide, Fungicide, and Rodenticide Act and other legislation related to water pollution were enacted. Since then, countless efforts have been mounted by both the scientific-technical community and the agricultural industry to better understand the role of agricultural practices in determining the fate of fertilizer and pesticides in watersheds (including groundwater) and to improve agricultural management accordingly.
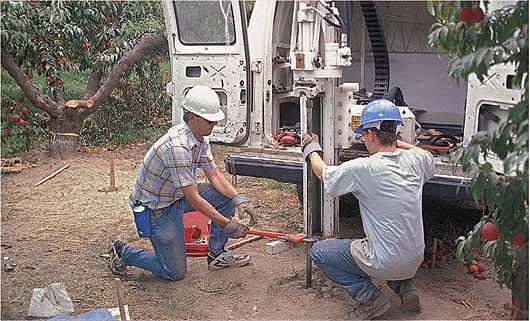
Nearly 3,000 feet of continuous soil cores were obtained between July and October 1997 using the Geoprobe direct-push drilling method. This method allowed for complete recovery of undisturbed cores throughout the 52-foot deep vadose zone. Above, UC Davis vadose zone hydrology professor Jan Hopmans (left) and Fresno State geology undergraduate Anthony Cole operate the coring equipment.
Much of the scientific work related to subsurface nitrate and pesticide leaching has focused on two areas: documenting the extent of contamination in groundwater; and investigating the fate of these chemicals in the soil root zone (including the potential for groundwater leaching) as it relates to particular agricultural crops and management practices. Rarely are these two research areas linked within a single study.
In California's valleys and basins, particularly in Central and Southern California, groundwater levels are frequently much deeper than 10 feet (3 meters) and sometimes as deep as 150 feet (45 meters) or more. Hydrologists refer to the unsaturated zone above the water table as the vadose zone. In general, only the uppermost 4 to 6 feet (1 to 2 meters) is described in soil surveys and investigated in soil studies; the deep vadose zone below the root zone remains largely outside the area of research and regulatory activity.
Yet, the vadose zone below the root zone stores significant moisture. All water and contaminant transport from the land surface to groundwater passes downward through the vadose zone. Few studies have investigated the fate or potential fate of, for example, nitrate and other contaminants in such deep vadose zones. Key questions include, What is the time of travel through the deep vadose zone? And, is there significant denitrification (natural attenuation) of nitrate in the deep vadose zone?
Pioneering work on nitrate in deep soil profiles was presented by Pratt et al. (1972) who investigated nitrate profiles in a Southern California citrus orchard to depths of 100 feet (30 meters); they estimated that it would take between 10 and 50 years for nitrate to leach to that depth. Average nitrate-nitrogen levels below the root zone varied from 15 to 35 milligrams per liter (mg/L) under a 50 pounds per acre (lb/ac) treatment and from 35 to 55 mg/L under an excessive 350 lb/ac treatment. Based on gross mass-balance estimates, denitrification at that site was estimated to account for up to 50% of nitrate losses in the thick unsaturated zone profile where application rates were high.
Lund et al. (1974), supported later by Gilliam et al. (1978), Klein and Bradford (1979) and Rees et al. (1995), argued that nitrate losses in the deep vadose zone (due to denitrification) were strongly correlated with the textural properties of the soil. High losses were found in soils with pans or textural discontinuities, while losses were limited in relatively homogeneous, well-draining soils in other areas of Southern California. In contrast, Rolston et al. (1996), using isotope analysis at sites in the southern Sacramento Valley and the Salinas Valley, found little evidence of significant denitrification, even in thick unsaturated zones.
To study deep unsaturated zone hydrology, we established a research site in a former ‘Fantasia’ nectarine orchard at the UC Kearney Research and Extension Center (KREC) in Fresno County. The objective of our work is to provide a comprehensive assessment of the fate of nitrate in a 52-foot (16-meter) deep alluvial vadose zone that is typical of many agricultural areas in California. The assessment included detailed geologic, hydraulic and geochemical characterization, using nitrate as an example.
Field sampling
A 12-year fertilizer management experiment (from 1982 to 1995) was implemented in a ‘Fantasia’ nectarine orchard (Johnson et al. 1995). The fertilization experiment consisted of five application treatments in a random block design with triple replicates. Treatments included annual nitrogen application rates ranging from 0 to 325 pounds per acre (0 to 365 kilograms per hectare [kg/ha])(fig. 1). For the vadose zone characterization, three treatment subplots (0, 100 and 325 pounds per acre) were selected in 1997 (2 years after termination of the experiment), which we refer to as the control, standard and high subplot, respectively.
To start, we conducted a conventional root-zone nitrogen (N) mass-balance analysis from application and harvest records for the 12-year experiment in the three subplots. The analysis showed that the annual nitrogen leaching of excess nitrogen fertilizer from the root zone into the deep vadose zone was 51 (± 19), 83 (± 30) and 245 (± 42) pounds per acre. Water losses from the root zone to the deep vadose zone in the flood-irrigated orchard amounted to 1,100 (± 180) millimeters per year (Onsoy et al. 2005). Assuming uniform flow conditions throughout the deep vadose zone at an average soil moisture content of 25%, the travel time through the deep vadose zone was projected to be 3.2 (± 0.5) years. Based on the leaching rate and travel time, and taking into account that the experiment ended 1 year prior to drilling, we estimate that the deep vadose zone nitrogen storage at the time of drilling would be on the order of 195, 233 and 426 pounds nitrogen per acre in the control, standard and high subplot, respectively.
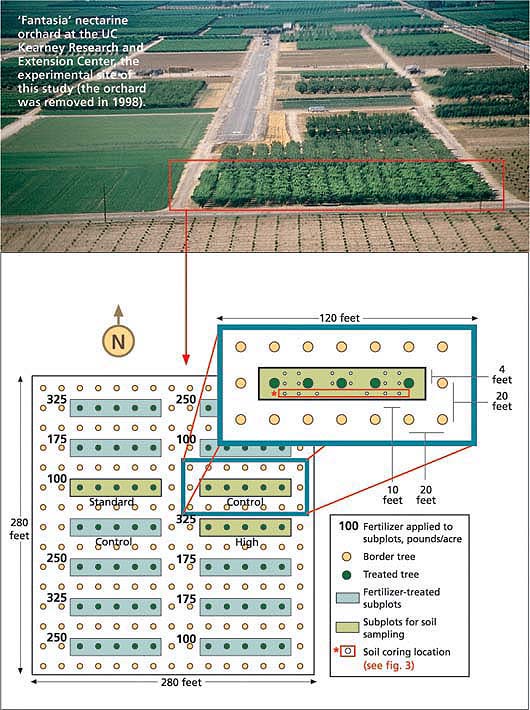
Fig. 1. In 1997, extensive core drilling was conducted, 2 years after the completion of three orchard nitrate-management trials at KREC with annual fertilizer rates of 0, 100 and 325 pounds nitrogen per acre. The complete random block design of the management trial and the three subplots selected for the deep vadose zone drilling are shown.
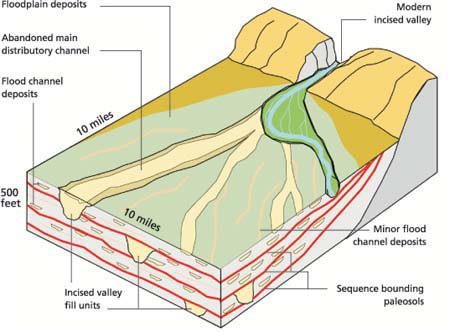
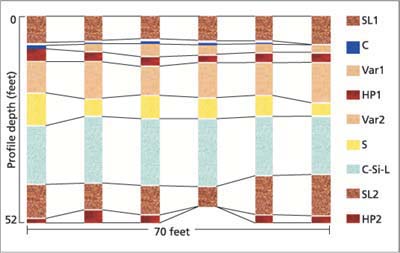
Fig. 3. The 10 major lithofacies identified at the two east-west cross sections, 140 and 144 feet from the southern edge of the orchard. The lithofacies, classified in the field according to color, texture and cementation, exhibit vertically varying thicknesses, yet are laterally continuous over the experimental site. Sandy loam is the most frequent textural unit, while clay is the least.
To confirm this estimate and to determine the applicability of the uniform flow concept, 60 undisturbed sediment cores were obtained in 1997 by drilling to the water table at a depth of 52 feet (16 meters) using a Geoprobe direct-push drilling technique. After geologic characterization of the complete core sections, 1,200 samples were collected (approximately one every 2.5 feet [0.8 meters]). Samples were collected for each sedimentologic stratum or substratum. The soil samples were preserved and stored for later analysis of their texture, hydraulic properties (water content, unsaturated hydraulic conductivity and water retention functions) and biochemical properties (pH, dissolved organic carbon, nitrate-nitrogen, 15N isotope analysis).
Geologic framework
The site is located on the Kings River alluvial fan, approximately 2 miles (3.2 kilometers) west of the current river channel. The quaternary alluvial sediments (that is, sediments deposited by a stream) are derived exclusively from the hard, crystalline Sierran bedrock. Stratigraphically, the quaternary deposits in this part of the valley can be divided into five units (Marchand and Allwardt 1981): the post-Modesto (youngest), Modesto, Riverbank, Upper and Lower Turlock Lake deposits. Except for the post-Modesto, which is less than 10,000 years old (Holocene), these deposits are of Pleistocene age (2 million to 10,000 years old).
Most of the stratigraphic units (sediment facies) found at the site are believed to represent separate alluvial episodes related to several Sierran glaciations. In cores from the study site, these deposits appear as intercalated, thick and thin lenses of clayey silt, silt, sand and gravel from fluvial deposition. Channel sediments consist of moderately to well-sorted, subangular to subrounded sand and gravel. These channel deposits are surrounded by muddy sand and silts of floodplain deposits (fig. 2) (Page and LeBlanc 1969; Huntington 1980; Weissmann et al. 2002). Deposits from the various periods of Sierran glaciations are vertically separated by paleosols. Paleosols are buried soil horizons that were formed on stable upper-fan or terrace surfaces during interglacial periods, when no sediment deposition took place (fig. 3).
The vadose zone sediments are most easily classified by their texture, which ranges from clay to small gravel and includes a wide spectrum of predominantly silty to sandy sediments. The colors of the sediments range from grayish brown to yellowish brown, and more randomly to strong brown (no significant reduction zones). The thickness of individual beds varies from less than 0.4 inch (1 centimeter) for some finely layered clayey floodplain deposits to more than 8 feet (2.5 meters) for sandy streambed deposits. Sharp as well as gradual vertical transitions are present between texturally different units. The relative proportion of the five major textural categories found in the sediment cores was 17.2% sand, 47.8% sandy loam, 13.8% silt loam/loam, 8.3% clay loam/clay and 12.9% paleosol ( and ; fig. 4).
KEY (figs. 3, 4): The major lithofacies are:
SL1 — recent Hanford sandy loam
C — clay, very thin
Var1 — variable sedimentary structures, predominantly sand
HP1 — shallow paleosol (hardpan), red
Var2 — various textures, sandy loam to clay loam
S — medium sand
C-Si-L — clay/clayey silt/clay loam, fine-textured floodplain deposits
SL2 — sandy loam and
HP2 — deep clayey paleosol (hardpan), red
Hydraulic properties variability
Hydraulic properties of the unsaturated zone, such as the hydraulic conductivity/moisture curve and the water retention curve — and the spatial distribution of these properties — strongly control the flow of water and the transport of nitrate and other solutes in the deep vadose zone. (Hydraulic conductivity is a measure of how fast water can percolate through the sediments; the higher the moisture and the coarser the sediments, the higher the hydraulic conductivity.) Hydraulic properties were determined in the laboratory on more than 100 undisturbed sediment core samples (3.5 inches [9 centimeters] long by 1.5 inches [3.8 centimeters] diameter) taken from various locations and depths at the orchard site. The laboratory tests involved measuring the water percolation rates in each core at six to 10 different moisture conditions, then determining the hydraulic properties by computer analysis.
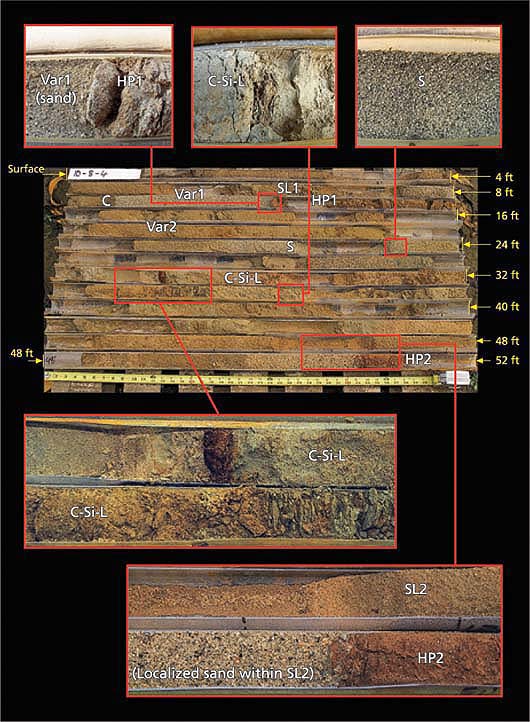
Fig. 4. Individual core sections were collected in 4-foot (1.2 meter) plastic tubes (see fig. 1). This image shows all 13 sections of a 52-foot (15.6-meter) core, lined up from the ground surface (upper left) to the bottom of the core (lower right). Missing subsections represent soil sampling locations for hydraulic and chemical analysis.
Given the large amount of textural variability observed in the cores, it was not surprising that we found the hydraulic properties to also vary significantly, both with depth and laterally across the site (Minasny et al. 2003). The saturated hydraulic conductivity, for example, varied over nearly four orders of magnitude. Within some sedimentary layers (facies) we observed nearly as much hydraulic variability within individual facies as between facies. By far the highest conductivity was observed in sandy facies (“S” and “Var1” in figs. 3 and 4).
Heterogeneity of water flow
Traditionally, water flow between the root zone (at depths of 6.6 feet ([0 to 2 meters]) and the water table (here a depth of 52.8 feet [16 meters]) has been considered essentially a uniform, vertically downward flow process in a more or less homogeneous vadose zone. Within this conceptual framework, water from individual rainfall or irrigation events is thought to be initially stored in the root zone. There, it is available for uptake by the roots. Surplus water then gradually drains into the deeper vadose zone. Individual rainfall or irrigation events create pulses of moisture that penetrate the root zone profile. Through root water uptake and vertical spreading, the moisture pulse dampens out as it travels downward. In the deeper portions of the vadose zone, the downward flow rate has therefore been thought to be equal to the annual recharge rate.
However, the highly heterogeneous geology of the alluvial sediments observed at the orchard site, coupled with the associated heterogeneity of the hydraulic properties, suggest that this traditional conceptual framework is inadequate to describe how water and chemicals are transported through the vadose zone to the water table. Using our field data and computer simulation, we reconstructed two-dimensional cross-sections of the vadose zone that reasonably reflect the spatial variability of the hydraulic properties observed in the field, then we simulated water flow through this reconstructed vadose zone. Figure 5 illustrates the spatial distribution of the water flux through a hypothetical cross-section at 40 feet, similar to that observed at the orchard site. It captures important features that are characteristic of water flow in heterogeneous vadose zones (Russo et al. 1998; Harter and Yeh 1996). Understanding that flow occurs in this highly irregular pattern is important for interpreting the field data.
Major facies in the study-site vadose zone
The sand (“S” and “Var1”) is quartz-rich, and contains feldspar, muscovite, biotite, hornblende and lithic fragments consistent with the granitic Sierran source (see figs. 3 and 4). Cross-bedding at the scale of few inches (centimeters) could be observed in some fine-grained sand samples. The dominant color of the sand is a light gray to light brown, the brown hue increasing with increasing loam content. The thickness of the sand beds is as much as 8 feet (2.4 meters), though thickness varies across the study site. Very coarse sand and particles up to pebble grain-size (up to 0.4 inch or 1 centimeter) could occasionally be observed at the bottom of the sand units, but were not present in all the cores. The sand units typically show a subtle fining-upward succession. The basal contact is typically sharp. The texture and distribution of these sandy deposits are consistent with deposition in a fluvial distributary channel on the Kings River fluvial fan. One ancient river channel was observed in cores collected from the orchard site, and it appears to have had a northeast-southwest orientation. The mean thickness of this channel deposit is nearly 6 feet (1.7 meters). The basal coarse sand and pebbles probably represent channel lag deposits that were laid down in deeper parts of the channels.
Sandy loam (“SL1,” “SL2”) is the most frequent lithofacies within the profile. The color is usually light olive to yellowish brown. Some of the sandy loam sediments are considered to be weakly developed paleosols because of their stronger brownish color, root traces and presence of aggregates. Mean bed thickness is 20 inches (50 centimeters), though individual beds can be as much as 7 feet (2 meters) thick. The sorting is moderate to good. Clay flasers and thin (fractions of an inch, 0.5 to 1 centimeter) clay laminae occur in some sandy loam units. Sandy loam sediments are assumed to have developed at the edge of channels, as levee or as proximal floodplain deposits near the channels.
Silt loam, loam and silty clay loam (portions of “C-Si-L” and “Var2”) are usually slight olive brown to brownish gray in color. The bed thickness is within a range of a few inches to a foot (centimeters to decimeters). Fine-grained sediments often show sharp contacts between the units. Changes from one unit to the next exist on small distances. Lamination can more frequently be observed within silty sediments than in fine sands. Root traces and rusty brown-colored mottles are quite common. The depositional environment was presumably the proximal to distal floodplain of the fluvial fan, an area dissected by distributary streams.
The finest sediments are grouped in the fourth category: silt, clay and clay loam (portions of “C,” “C-Si-L” and “Var2”). These are believed to have been deposited in the distal floodplain and in ponds that developed in abandoned channels. The main color is brownish gray to olive brown. Fine, less than 1-millimeter-diameter root traces and rusty brown mottles are common in the clay sediments. Statistics for the thickness of clay layers in the unit between 27 and 43 feet (8 and 13 meters) depth show a mean thickness of 5 inches (12.8 centimeters), but the mode is about 2.2 inches (3 centimeters). A 20-inch (50-centimeters) thick clay bed was observed at approximately 8 feet (2.5 meters) depth in most of the cores.
Paleosols (“HP1,” “HP2”) were recognized in different stages of maturity. They show a brown to strong brown, slightly reddish color, exhibit aggregates, ferric nodules and concretions, few calcareous nodules and hard, cemented layers. They also display a sharp upper and a gradual lower boundary as is typical for paleosols (Retallack 1990). Clay content decreases downward in the paleosols. Another feature is fine root traces, though these are typically obliterated in the more mature paleosols. Paleosols formed in periods of stasis marked by nonerosion and nonde-position, during the interglacials (Weissmann et al. 2002). The thickness of the paleosol horizons ranges from 20 inches (50 centimeters) to about 7 feet (2 meters).
In particular, figure 5 shows that even though the simulated water application at the surface was uniform, the heterogeneity of the vadose zone forces water into distinct preferential flow paths (warm colors), separated by large areas of relatively stagnant flow (cooler colors). The preferential flow paths have highly irregular shapes, but are continuous and extend to the water table. The preferential flow paths occupy only a small portion of the vadose zone. In contrast, areas with relatively stagnant water flow occupy most of the vadose zone. Soil moisture differences between these two zones are small. Soil moisture is therefore not a particularly sensitive indicator and may not be useful for identifying the presence and location of these preferential flow paths.
In our study, further field work and computer simulations indicate that the location of these preferential flow paths does not change over time, even though they may partially or completely dry out between infiltration events. A new event will recreate the same set of preferential flow paths.
Preferential flow paths are not only created by the sediment heterogeneity. Other conditions may also trigger and support preferential flow paths: macropores in the root zone; flow instability during infiltration into sand or loamy sand soils (Wang et al. 2003); flow through or above embedded clay or sand lenses (“funneling”)(Kung 1990); and “fingering” as a result of a sharp textural boundary within the vadose zone where the finer-textured (silt/clay) layer is located above a coarse-textured (sand) layer (Glass and Yarrington 2003).
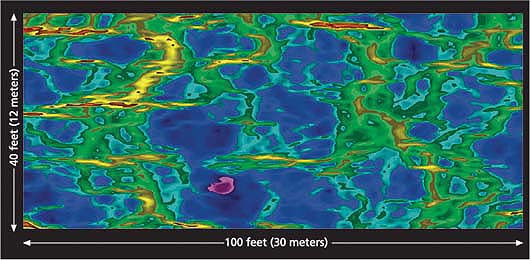
Fig. 5. Hypothetical, computer-simulated, unsaturated water flow rates through a heterogeneous vadose zone, illustrating how heterogeneity in the unsaturated zone generates preferential flow paths: Warmer colors (red, orange, yellow) represent high flow rates, and cooler colors (blue, violet, black) represent lower flow rates. The unsaturated hydraulic properties used for the simulation are similar to those found at the KREC research site.
Since much of the annual recharge occurs through these preferential flow paths, the actual downward flow rate is locally much higher than that estimated when assuming that the entire vadose zone uniformly participated in the downward water flow. Hence, solute travel times through deep vadose zones are likely shorter than if flow were indeed uniform. Because of the shorter travel time, nitrogen storage in the deep vadose zone should be significantly lower than estimated based on the uniform flow concept. On the other hand, under heterogeneous conditions, relatively old water may be trapped in the more stagnant portions of the vadose zone for extended periods. Do the measured nitrate distribution and water chemistry in the deep vadose zone at the Kearney site support this alternative conceptual framework of water and solute flow through the vadose zone?
Nitrogen distribution
To address this question, nitrate-nitrogen (NO3-N) concentrations were measured in 809 subsamples of our cores. We found that the data were indeed highly variable and log-normally distributed (the logarithms of the data were normally distributed). Nitrate-nitrogen concentrations ranged from less than the detection limit of 0.05 milligram per liter (mg/L)(224 samples or 28% of the sample population) to more than 100 mg/L (two samples). Approximately 10% of the samples exceeded the maximum contamination level for drinking water (10 mg/L), set by the U.S. Environmental Protection Agency under the Safe Drinking Water Act. More than half of those occurred in the subplot with the highest nitrogen application. Mean nitrate-nitrogen concentrations (not including nondetects) in the control, standard and high subplot vadose zone were estimated to be 5.2, 3.3 and 7.4 mg/L, respectively (Onsoy et al. 2005). The nitrate-nitrogen coefficient of variation (CV) ranged from 1.6 to 2.4 within each subplot. The difference between the control and standard subplots was statistically not significant due to the large variability. But the high subplot yielded significantly larger mean nitrate-nitrogen concentrations throughout the profile, consistent with the overapplication of fertilizer.
Within all three subplots, slightly higher nitrate-nitrogen levels were observed in the root zone than in the deep vadose zone below the root zone, possibly due to the last fertilizer application in fall 1996, prior to our drilling. Other than that, we observed no significant vertical nitrate-nitrogen trend in the deep vadose zone.
The highest number of nondetects occurred in the coarse-textured, sandy lithofacies and in the sand lithofacies (above historic water level). There, approximately half of the samples had non-detectable nitrate-nitrogen levels. This is consistent with findings that fingering or preferential flow is particularly dominant in sandy unsaturated sediments. In other words, much of the sand facies does not participate in the flow (stagnant moisture) and would see little or none of the nitrate-nitrogen that is passing through the preferential flow paths.
Study-site geologic profile
A number of distinct sedimentologic units are recognized in the vadose zone profile throughout the orchard and are used to construct a field-scale geologic framework for the research site (see figs. 3 and 4).
The deepest parts of the cores (between 50 and 52 feet [15 and 15.8 meters]) display a strong brownish-colored, clay-rich paleosol. This paleosol marks the top of the upper Turlock Lake deposits (Weissmann 2002). Directly above this paleosol, from depths between 40 and 50 feet (12 to 15 meters) below the surface, the main textural units are sandy loam to fine sandy loam, with some coarse sand and gravel or fine-grained sediments. In the cores with fine sediment at the bottom of this unit, a coarsening-upward succession was observed in this zone; in the other cores a fining-upward cycle was observed.
Between 27 and 40 feet (8 and 12 meters) depth, the sediments are vertically and laterally quite heterogeneous with relatively thin bedding (thickness of a few inches [centimeters] to a couple of feet [few decimeters]), consisting mainly of clayey, silty and loamy material. Another strong brownish paleosol occurs at a depth of 30 to 33 feet (9 to 10 meters). Between 20 and 30 feet (6 and 9 meters) below the surface, a distinct sand layer, representing a former stream channel bed, is found. This unit has laterally varying thickness averaging nearly 6 feet (1.7 meters). A weak, mostly eroded paleosol was developed on top of the sand unit.
From about 10 to 13 feet (3 to 4 meters) to 20 feet (6 meters) below the surface, sandy loam with intercalated sand, clayey and silty material is found. Different trends of upward-fining and upward-coarsening are found on top of each other and laterally next to each other within this unit.
Immediately above the unit, at a depth of about 10 to 13 feet (3 to 4 meters), a nearly foot thick (0.2 meter) to more than 10 feet (1 meter) thick paleosol hardpan occurs. This paleosol marks the top of the Riverbank formation. Recent ground-penetrating radar surveys indicate that this paleosol is laterally extensive across the orchard site.
Sandy loam and subordinated loamy sand and loam are present from the top of the paleosol to the surface, and represent the Modesto deposits at the site. About 8 feet (2.5 meters) below the surface, a laterally continuous clay horizon with a thickness of few inches (centimeters) is found in most of the cores.
Most importantly, the total nitrogen mass estimated directly from the measured nitrate-nitrogen distribution in the deep vadose zone was only 46 (± 9), 37 (± 6) and 83 (± 12) pounds per acre annually for the control, standard and high subplots, respectively. This is less than one-quarter of the total nitrogen mass in the deep vadose zone that was indirectly estimated from the mass balance described above, which is based on the conventional uniform flow concept.
Role of denitrification
Traditionally, such low nitrate-nitrogen mass in the deep vadose zone has been attributed to denitrification (the microbial breakdown process of nitrate by soil microbes). However, the lack of a significant vertical trend in the average nitrate-nitrogen concentration does not support that hypothesis (denitrification in the deep vadose zone would create a nitrate-nitrogen profile that shows decreasing concentration with depth). To further evaluate whether denitrification played a significant role in the deep vadose zone, we measured the amount of soluble organic carbon (a microbial food source) and the amount of δ15N (a rare nitrogen isotope that increases in relative abundance when denitrification occurs) in the nitrate-nitrogen of samples from four cores (three from the high subplot and one from the standard subplot). (The concentration of isotopes is not reported in absolute values, but rather as a relative concentration, hence the notation “delta” or “δ” 15N. A value of δ15N = 5%o indicates that the 15N concentration is 5 permil above normal [1 permil = 0.1 percent].)
Soluble carbon was found to be very low, not favoring high rates of microbial degradation anywhere in the vadose zone profile. The δ15N values varied from 0%o to 12%o and averaged 6%o (fig. 6). Without denitrification, δ15N levels are expected to be in the range of -5%o to 5%o (Rolston et al. 1996). Denitrification decreases nitrate-nitrogen concentrations, but increases the relative amount of isotopically heavy NO3- δ15N. Indeed, there was a very weak trend (R2 < 0.1) to support the hypothesis that a limited amount of denitrification may occur in the vadose zone: samples with 2 mg/L to 10 mg/L nitrate-nitrogen had relative δ15N levels of 5%o to 12%o, while samples with higher nitrate-nitrogen contained from 0%o to 6%o of δ15N. (No δ15N measurements could be made on samples with less than 2 mg/L nitrate-nitrogen.)
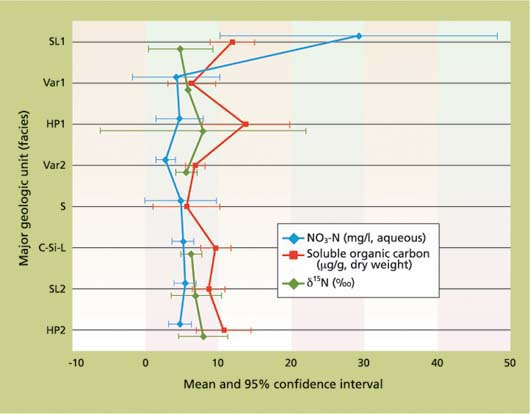
Fig. 6. Composite nitrate-nitrogen, dissolved organic carbon (DOC) and δ15N profiles from borings at the orchard study site. Higher DOC indicates a higher potential for denitrification. Higher δ15N levels (above 10) indicate the occurrence of partial denitrification.
There was significant scatter in these data, corroborating the concept of highly heterogeneous transport. Furthermore, just as there was no significant decrease in nitrate-nitrogen with depth, there was no significant increase in δ15N with depth, similar to isotopic results at geologically similar Yolo County and Salinas Valley sites (Rolston et al. 1996). Then why was the total nitrogen storage in the deep vadose zone so low?
The nitrate distribution pattern that we found (fig. 7) was similar to that postulated in other experimental studies specifically designed to assess transport in heterogeneous soils as well as that predicted by numerical models of flow and transport in highly heterogeneous vadose zones (Harter and Yeh 1996). Hence, the proposed conceptual framework of preferential flow in the deep vadose zone may provide the answer: preferential flow paths, which are responsible for most of the water and solute transport from the root zone to the water table, quickly flushed nitrate-nitrogen to deeper portions of the vadose zone and to the water table, allowing for little or no denitrification. This would explain the occurrence of high nitrate-nitrogen levels and low δ15N levels throughout the depth of the vadose zone profile.
Lower nitrate-nitrogen would occur in stagnant water zones outside preferential flow paths. Due to their longer residence time, nitrate-nitrogen in these zones was apparently subject to a small amount of denitrification, which would explain the higher levels of δ15N that were also found, scattered throughout most of the profile.
The importance of this finding is that while limited denitrification took place in the stagnant water areas of the vadose zone, the majority of the nitrate-nitrogen transport occurred in preferential flow paths, where no significant denitrification appears to have taken place. Hence, the low average nitrate-nitrogen concentration in the vadose zone pore water should not be interpreted as an indicator for high denitrification and low nitrate impact on groundwater. Rather, it may be the result of swift, unattenuated nitrate-nitrogen transport to the water table (the same may apply to the root zone).
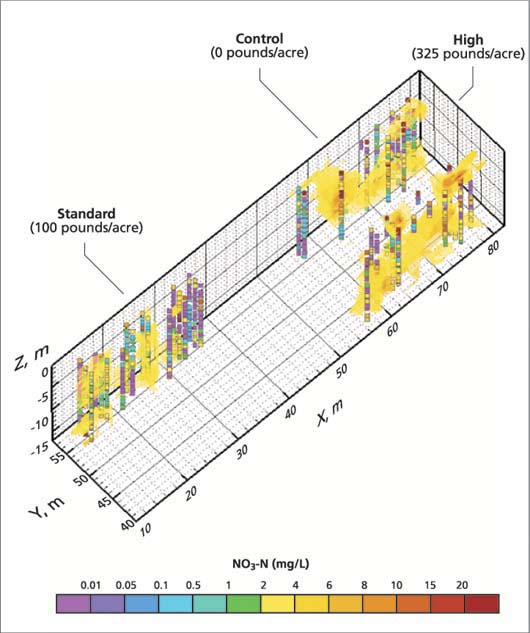
Fig. 7. Measured core nitrate-nitrogen data (squares) and three-dimensional, kriged (yellow) contours of nitrate-nitrogen data. The kriged isosurfaces (only for NO3-N > 1 mg/L) are obtained from geostatistical analyses of the water content and nitrate measurements at the sampling locations. The standard subplot yielded the largest areas of negligible nitrate concentrations (NO3-N < 1 mg/L) among the three subplots. High concentrations are seen in the upper profile and near the water table.
Analysis shows variability
Our detailed geologic, hydraulic and geochemical analysis of a typical deep vadose zone in the eastern San Joaquin Valley demonstrated that alluvial vadose zones are subject to significant geologic variability, which in turn causes the hydraulic properties and water flow in the vadose zone to exhibit strong spatial variability. While such variability is expressed to only a limited degree in the variability of the observed moisture content, it leads to highly variable concentrations of chemicals, such as nitrate. Our research presents new evidence indicating that unsaturated water flow and transport of nitrate and other agro-chemicals (such as pesticides) in the deep vadose zone below the root zone may be subject to significant preferential flow patterns with significantly faster travel times than would be estimated under uniform flow assumptions. Faster travel times not only decrease the potential for denitrification, but also decrease the potential for natural attenuation of pesticides.
Our work suggests that the traditional interpretation of deep vadose zone measurements should be reconsidered. The assumption of uniform flow is not applicable to many alluvial vadose zone sites. The common practice of compositing soil samples taken from immediately below the root zone provides an estimate of the average nitrate-nitrogen concentration at that depth. However, our work indicates that recharge water may constitute only a minor portion of that vadose zone water and is not effectively represented by composite soil samples. It appears that the average or composite nitrate-nitrogen concentrations are also not appropriate for estimating the amount of denitrification as a closure term to the nitrogen mass balance. We are currently implementing detailed heterogeneous flow and transport simulations to further support these findings and to develop guidelines for sampling the deep vadose zone.
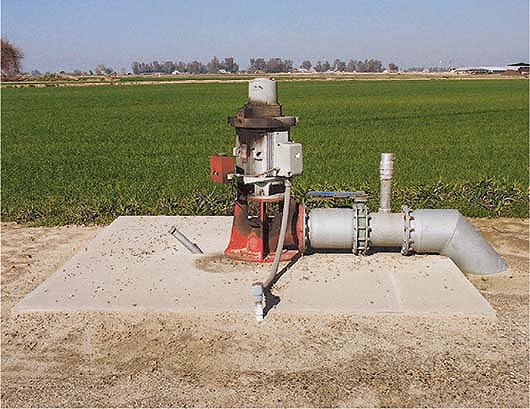
Before it is pumped to the surface for agricultural or other uses, groundwater percolates through the geologically variable vadose zone. Based on this study, current assumptions about transport of nitrate from fertilizers and other agricultural chemicals need to be reexamined.
Deep vadose zone hydrology demonstrates fate of nitrate in eastern San Joaquin Valley

