


All Issues
Drip irrigation increases tomato yields in salt-affected soil of San Joaquin Valley
Publication Information
California Agriculture 57(4):132-137. https://doi.org/10.3733/ca.v057n04p132
Published October 01, 2003
PDF | Citation | Permissions
Abstract
This study evaluated the potential for subsurface drip irrigation in processing tomato to reduce subsurface drainage, control soil salinity and increase farm profits in areas affected by saline, shallow groundwater. Subsurface drip irrigation systems were installed in three fields of fine-textured, salt-affected soil along the West Side of the San Joaquin Valley. No subsurface drainage systems were installed in these fields. Yield and quality of processing tomato were compared with sprinkler irrigation systems. Yields increased 5.4 tons per acre to 10.1 tons per acre in the drip systems with similar amounts of applied water. The solids content of drip-irrigated processing tomato was acceptable. Water-table levels showed that properly managed drip systems could reduce percolation below the root zone, reducing subsurface drainage. Yields of the drip systems were also similar over a range of soil salinity levels.
Full text
AN economically, technically and environmentally feasible drain-water disposal method does not exist for the San Joaquin Valley. Therefore, the drainage problem must be addressed through options such as better management of irrigation water to reduce percolation below the root zone, increased use by crops of the shallow groundwater without any yield reductions, and reuse of drainage water for irrigation. One option for improving irrigation water management is to convert from furrow or sprinkler irrigation to drip irrigation. Drip irrigation can apply water more precisely and uniformly, potentially reducing subsurface drainage, controlling soil salinity and increasing yields. The main disadvantage is installation costs up to about $1,000 per acre. For drip irrigation to be at least as profitable as other irrigation methods, growers must receive more revenue from higher yields and lower irrigation and cultivation costs. Yet, several large-scale comparisons of furrow and drip irrigation in cotton revealed uncertainty as to the economic benefits of drip irrigation (Hanson and Trout 2001). As a result, growers converting to drip irrigation face uncertainty about the economic risks involved.
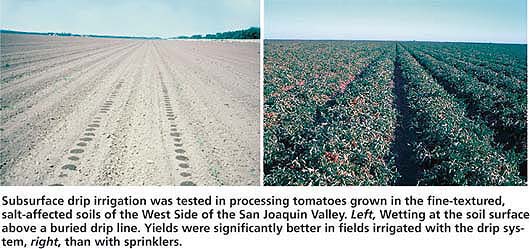
Subsurface drip irrigation was tested in processing tomatoes grown in the fine-textured, salt-affected soils of the West Side of the San Joaquin Valley. Left, Wetting at the soil surface above a buried drip line. Yields were significantly better in fields irrigated with the drip system, right, than with sprinklers.
From 1999 to 2001, we evaluated subsurface drip irrigation in processing tomato to determine its effect on crop yield and quality, soil salinity and water-table depth in salt-affected, fine-textured soil underlain by saline, shallow groundwater on the West Side of the San Joaquin Valley. Processing tomato is a major crop on the valley's west side; acreage in the Westlands Water District is about 90,000 acres, about 16% of the district's irrigated acreage (Westlands Water District 2002). Because processing tomato is a high cash-value crop, the need for increased profitability with drip irrigation is greater than in cotton. However, tomato is much more sensitive to soil salinity, raising concerns about possible reductions in crop yields in salt-affected soil.
Subsurface drip irrigation
Subsurface drip irrigation systems were installed in three fields (about 160 acres each) of processing tomatoes located in the Westlands Water District. Sites DI (80 acres of drip irrigation) and BR (40 acres) were installed in 1999, while DE (40 acres) was installed in 2000. (DI, BR and DE are site identifications.) Sprinkler irrigation was used for the rest of each field, the normal irrigation method of tomatoes in these soils. Westlands irrigation water was used at DI and BR, and well water at DE. Measurements made at all sites were field-wide red fruit yield (machine harvested), yield quality, depth to the water table, irrigation water salinity, ground-water salinity and applied water.
The irrigator determined irrigation scheduling at each site using appropriate crop coefficients and reference crop evapotranspiration from the California Irrigation Management Information System (CIMIS). There were no subsurface drainage systems at the drip-irrigated sites. Low-flow drip tape (0.2 gallons per minute [gpm]/100 feet), 7/8-inch diameter, was buried about 8 inches deep with one drip line per bed, although two drip lines per bed were used for BR2001 (site/year). Emitter spacing ranged from 12 inches to 18 inches depending on the type of tape. Drip-line lengths were about 1,300 feet at all sites. Irrigations were twice per week during the period of maximum canopy size.
Small plot experiment
In addition, a second experiment consisted of applying different amounts of irrigation water to small plots in the drip-irrigated area of each site to determine the minimum amount of water that can be applied under saline, shallow groundwater conditions without reducing crop yield. The DI1999 experiment used processing tomato varieties H9557, H9665 and H8892, while the DE2000 experiment used the varieties Halley 3155, H9665 and H8892. Otherwise, the growers' variety was used (table 1).
Data collected in the small-scale, drip-irrigated plots included: total red fruit yield (machine harvested), soluble solids and color; percent red, green and nonmarketable fruit; applied water; weekly measurements of canopy coverage; and soil moisture content and salinity. Sampling locations for soil moisture content and soil salinity were 10 inches from the drip line at 6-inch depth intervals down to 30 inches to 36 inches deep at the head, middle and end of the field. A digital infrared camera and appropriate software were used to measure canopy coverage. A neutron moisture meter was used for soil moisture measurements. In addition to the these measurements, patterns of soil moisture content and soil salinity around the drip line were determined by a one-time sampling with depth at various distances from the drip line. Seasonal crop evapotranspiration (ET) was estimated using a computer model (Hsiao and Henderson 1985) and reference crop (grass) evapotranspiration. The model was calibrated for processing tomato with data from an unrelated project. Differences between measured seasonal ET and that estimated by the model were 5% or less.
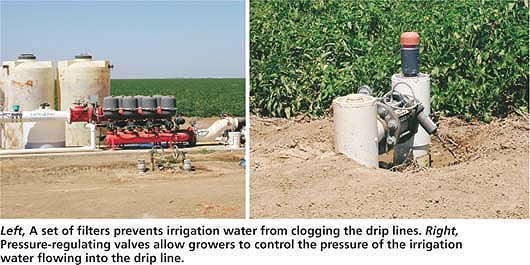
Left, A set of filters prevents irrigation water from clogging the drip lines. Right, Pressure-regulating valves allow growers to control the pressure of the irrigation water flowing into the drip line.
Fieldwide yield characteristics
At each site, only 1 year of comparing drip-versus-sprinkler irrigation was possible (1999 for DI and BR; 2000 for DE). After the first year at each site, the rest of the BR and DE fields were converted to drip irrigation, while at DI a different crop was planted. Yields of the drip-irrigated fields were monitored for several additional years.
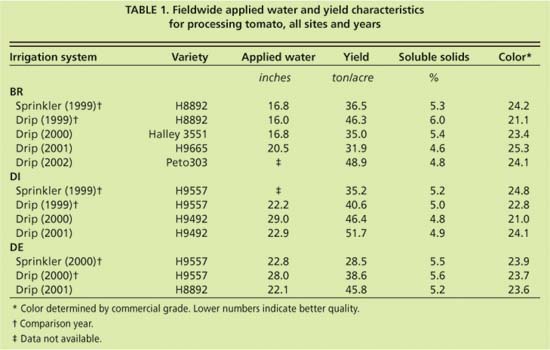
TABLE 1. Fieldwide applied water and yield characteristics for processing tomato, all sites and years
Fieldwide yields under drip irrigation were 5.4 tons per acre to 10.1 tons per acre greater than under sprinkler irrigation, an increase of about 15% to 35% (table 1). Average yields were 41.8 tons per acre and 33.4 tons per acre for drip and sprinkler irrigation, respectively. The average yield difference was statistically significant using the t-test with a 5% significance level. Drip yields were considered high for these fine-textured, salt-affected soils. After the first year, yields at DI and DE continued to be high (table 1). Yields at BR for 2000 and 2001 were relatively low, albeit higher than normally experienced for late plantings. However, a high yield occurred at BR in 2002.
Soluble solids, a measure of the solid material of tomatoes, were acceptable for all years, averaging 5.3% and 5.5% for sprinkler and drip irrigation, respectively. Soluble solids increased with increasing soil salinity, averaging 4.9%, 5.3% and 5.4% for DI (lowest salinity level), BR and DE (highest salinity level), respectively. The average color — determined by commercial graders — was 24.3 and 22.5 for sprinkler and drip irrigation, respectively. (Lower color numbers indicate better quality.) Differences in soluble solids and color between drip and sprinkler irrigation were not statistically significant.
Applied water at BR1999 was similar for drip and sprinkler irrigation. About 6 inches more water was applied to the drip field compared with the sprinkler field for DE2000, partly because the drip field was irrigated for about 2 weeks longer. Applied water data for the sprinkler field at DI was not available.
Differential irrigation results
Results of the differential irrigation experiments showed that plot yield decreased with decreasing irrigation water applications for all sites and all years, although differences in behavior occurred among the sites and years. For example, at DI the overall average yield for all tomato varieties (no yield differences between varieties) decreased from 47 tons per acre to 42 tons per acre as applied water decreased from 23.0 inches to 14.8 inches in 1999; and in 2001, it decreased from 50.5 tons per acre to 46.4 tons per acre as applied water decreased from 20.0 inches to 13.5 inches.
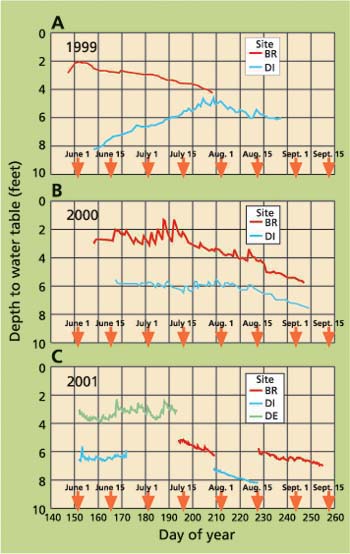
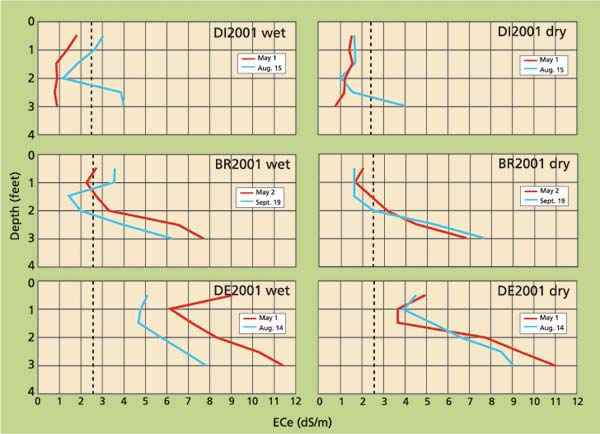
Fig. 2. Electrical conductivity of saturated extracts (ECe) with depth for wet (receiving the most irrigation water) and dry (receiving the least irrigation water) differential drip-irrigated treatment in 2001. Dashed line is the reference salinity threshold value for tomato.
Soluble solids increased with decreasing applied water for all sites and all years, but different magnitudes of changes occurred each year. For example, the overall average soluble solids at DI1999 increased from 4.6% to 5.0% as applied water decreased from 20.0 inches to 16.4 inches. Applied water had little effect on color and percent red fruit (data not shown).
Linear regression equations relating yield characteristics with applied water were tested for their statistical significance and for statistical similarity among the sites. Results of the statistical tests were mixed, preventing any conclusions from being developed about differences between sites and years. There were no statistical differences in yield, solids and color between varieties at DI in 1999 and DE in 2000.
Water quality and levels
The irrigation water and groundwater quality was assessed using measurements of electrical conductivity (EC). Higher ECs reflect higher salt content of the water and lower quality. The EC of the Westlands Water District irrigation water at BR and DI normally was about 0.34 deciSiemens/meter (dS/m) (data not shown). At DE, the electrical conductivity of the well water was about 1.06 (dS/m) to 1.2 dS/m. The EC of the shallow groundwater at BR1999 ranged from 4.7 dS/m to 7.4 dS/m. The ground-water EC at DI ranged from 7.9 dS/m to 11.1 dS/m for 1999 and 2000, but was 4.0 dS/m to 4.7 dS/m in 2001. Reasons for the small 2001 values are unknown even though sampling locations were within 30 feet of each other. EC values at DE were 13.6 dS/m to 16.4 dS/m in 2000 and 9.0 dS/m to 9.5 dS/m in 2001. These differences may reflect different sampling locations due to using different areas of the field each year.
Measurements of water-table depth were used as an indicator of subsurface drainage (or lack of) below the root zone. The water-table depth at DI1999 decreased with time until about July 20 and then increased to about 6 feet deep, while the water table at DI remained below 6 feet deep in 2000 and 2002 (fig. 1). No response of water-table depth to drip irrigation was evident. At BR1999, the water-table depth increased from about 2 feet to 4.3 feet. But in 2000, drip irrigations caused it to rise to nearly 1.6 feet deep before July 15, the result of applying about 10% more water than the estimated crop evapotranspiration. After mid-July, the water-table depth increased to 5 feet to 6 feet deep due to reduced water applications. Water-table levels were not measured at DE in 2000 because of problems with installing observation wells. In 2001, water-table depth at DE fluctuated between about 2 feet and 4 feet with a definite response to drip irrigation. The gaps in the 2001 data were caused by the water level in the observation wells dropping below the pressure transducers.
Soil salinity
Soil salinity, as measured by the electrical conductivity of the saturated extract (ECe), differed considerably among the three sites (fig. 2 for 2001 data). (In the differential drip-irrigated experiment, the “wet” treatment received the most and the “dry” treatment received the least irrigation water.) ECe values at DI were generally less than 2.5 dS/m, the threshold value for tomato. The threshold ECe value is the maximum average root-zone ECe at which no yield reduction should occur (Maas 1990). The actual root-zone salinity under drip irrigation is unknown because of spatially varying patterns of soil salinity, soil moisture and root density around drip lines. The threshold value is provided as a reference only to indicate a potential for yield reduction. At BR2001, ECe increased considerably with depth and exceeded the threshold value except for depths less than about 1.5 feet. ECe values at DE2001 increased with depth, with values exceeding the threshold value throughout the soil profile. At all sites, differences between wet and dry irrigation treatments were slight.
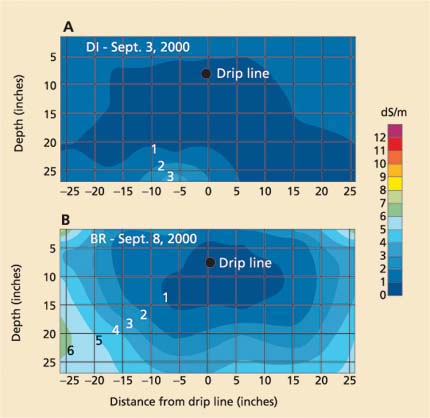
Fig. 3. Patterns of electrical conductivity of saturated extracts (ECe) around the drip line for (A) DI2000 and (B) BR2000.
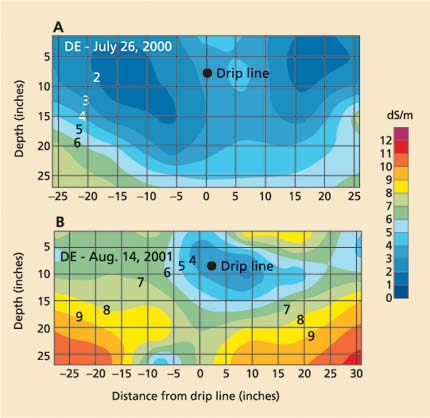
Fig. 4. Patterns of electrical conductivity of saturated extracts (ECe) around the drip line for (A) DE2000 and (B) DE2001.
The pattern of ECe around the drip line showed values less than the threshold value of about 2.5 dS/m throughout the soil profile at DI (fig. 3A). At BR2000, salinity was least near the drip line with values less than about 1 dS/m, but increased with horizontal distance from the drip line and depth to values of about 7 dS/m (fig. 3B). The zone of ECe values less than the threshold value extended about 16 inches horizontally from the drip line and 8 inches deep below. Salt accumulated above the drip line. While the actual root distribution around the drip line is unknown at these sites, it is likely that most of the roots are near the drip line. Therefore, the soil salinity near the drip line will affect crop yield more than the salinity elsewhere in the soil profile. These results show that the levels of soil salinity near the drip line should not adversely affect crop yield.
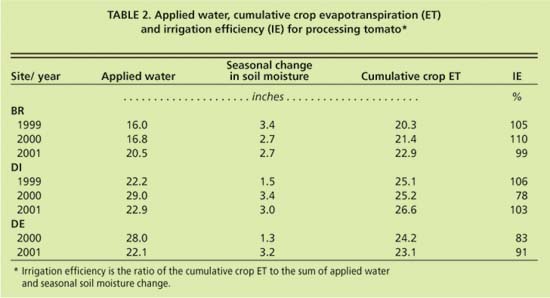
TABLE 2. Applied water, cumulative crop evapotranspiration (ET) and irrigation efficiency (IE) for processing tomato*
At DE2000, ECe was highest near the drip line with values of 3 dS/m to 4 dS/m and decreased with horizontal distance to values less than 2.5 dS/m beyond about 8 inches to 16 inches (fig. 4A). The high salinity near the drip line reflected the well water EC. The low levels of salinity near the edge of the pattern probably reflected leaching of salts due to ponding from a severe late spring rain. The next year, ECe levels ranged between 5 dS/m and 7 dS/m throughout most of the soil profile except near the drip line, where ECe values were between 3 dS/m and 4 dS/m (fig. 4B). For both years, soil salinity near the drip line exceeded the threshold salinity value, suggesting a potential for yield reductions. However, crop yield data (table 1) indicates that these levels of salinity had little effect on crop yield.
The main source of salt in these fields is the upward flow of saline groundwater into the root zone. However, we found a weak correlation between soil salinity near the bottom of the sampled soil profile and ground-water salinity. At DI, soil salinity at the deeper depths was generally less than 2 dS/m, but groundwater salinity was much higher. At BR, soil salinity levels at the deeper sampled depths were similar to groundwater salinity; however, at DE, soil salinity was less than groundwater salinity. The reasons for the behavior at DI and DE are not clear, but the deeper water-table depth at DI (generally 6 feet or deeper) may have contributed to the smaller soil salinity values, whereas at the other sites much smaller water-table depths occurred. The deeper depth at DI may have greatly reduced the upward flow of shallow groundwater.
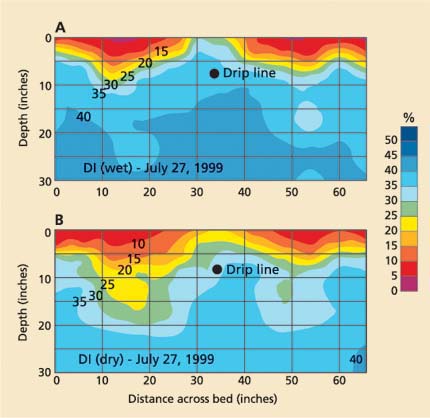
Fig. 5. Patterns of volumetric soil moisture content (%) around drip lines for (A) wet and (B) dry differential drip-irrigation treatments in DI1999.
Soil moisture, evapotranspiration
Soil moisture was monitored over time to determine the adequacy of irrigation. Soil moisture content decreased slightly with time throughout the irrigation season for all treatments (data not shown). Average moisture contents of the wet differential-drip treatments were slightly higher than those of the dry. Wetting patterns around the drip line showed water moving laterally to about 16 inches from the drip line at DI (fig. 5) and BR (not shown) for both irrigation treatments. At about that distance, soil moisture content was the least for a given depth. Soil moisture content increased with depth, but such changes were small below the drip line. At about 20 inches from the drip line (in the furrow), slightly higher soil moisture occurred compared to 16 inches for both irrigation treatments, suggesting less moisture extraction near the furrow. Soil moisture contents above about 15 inches to 20 inches deep were less for the dry treatment (fig. 5B) compared with the wet treatment (fig. 5A). Similar behavior occurred at BR. Wetting patterns at DE were not measured, but based on the salinity pattern in figure 4A, lateral flow was between 8 inches and 16 inches from the drip line. At BR2001, where two drip lines per bed were used, wetting across the bed was more uniform compared to the single drip-line configuration (not shown).
Seasonal cumulative ET for all years (calculated using the computer model and canopy growth curves) showed ET values ranging from 20.3 inches to 26.6 inches (table 2). Seasonal irrigation efficiency, defined as the ratio of cumulative ET to the sum of cumulative applied water and seasonal change in soil moisture, ranged from 78% to 110%. Values near or exceeding 100% indicate deficit irrigation and possible use of the shallow groundwater, both of which may be undesirable in processing tomato. The seasonal change in soil moisture content was estimated from measurements taken 10 inches from the drip line. The actual seasonal change may vary because of the spatially varying soil moisture content around the drip line.
Economics of processing tomato
The economics of converting to subsurface drip irrigation from sprinkler irrigation were determined using cost data provided by one of the grower participants. Assumptions used in this analysis were:
-
The existing sprinkler irrigation system was used elsewhere on the farm.
-
The economic life of the drip system was 20 years.
-
Replacement of the drip tape occurred every 5 years.
-
Filters and pumps were replaced every 10 years.
-
Yield increases ranged from 5.4 tons per acre to 10.1 tons per acre (table 1).
-
Equivalent annual capital cost of the drip irrigation system was determined for interest rates of 5% and 10%.
-
The same amount of irrigation water was applied by both irrigation methods.
-
Area irrigated was 80 acres.
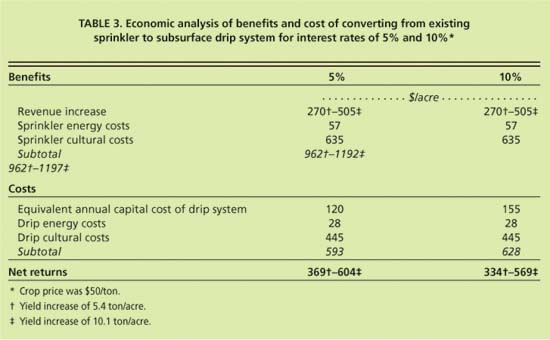
The benefits of converting to drip irrigation were increased revenue from higher yields and annual savings in cultural costs and energy. The conversion costs were the equivalent annualized capital cost of the drip system and its annual cultivation and energy costs. Annual net return ranged from $369 per acre to $604 per acre for a 5% interest rate and from $334 per acre to $569 per acre for a 10% rate (table 3). Returns to land, farm management costs, taxes and insurance costs were not available. The capital cost of the drip system was $809 per acre. The equivalent annual capital cost of the drip system was $120 per acre and $155 per acre for the 5% and 10% interest rates, respectively.
Irrigation and water management
Subsurface drip irrigation in the fine-textured, salt-affected soils on the West Side of the San Joaquin Valley can increase the yield and profitability of processing tomato compared to sprinkler irrigation, with acceptable levels of soluble solids (mainly due to the soil salinity at these locations). Properly managed drip irrigation can also control subsurface drainage to the shallow groundwater, as indicated by the water table data, potentially reducing problems caused by excessive subsurface drainage. Little correlation was found between soil salinity and crop yield, even though ECe values higher than the threshold ECe were found around the drip line at one site, suggesting that soil salinity under drip irrigation may affect crop yield less than other irrigation methods. Subsurface drip irrigation also provided better water management late in the growing season, when careful management is needed to prevent excessive deficit irrigation and phytophthora due to overly wet soil.
Little, if any, water savings on a per acre basis are likely when converting to drip irrigation from sprinkler irrigation for processing tomato. The higher yields with drip irrigation suggest that percolation and evaporation losses under sprinkler irrigation became transpiration losses under subsurface drip irrigation. However, because of higher yields the same total tons can be grown on fewer acres, saving water.
Subsurface drip irrigation must be carefully managed to prevent yield reductions and excessive percolation to the groundwater. Recommended irrigation amounts are about 100% of the potential crop ET in processing tomato as a compromise between reducing drainage and leaching of salts in the root zone. Crops should be irrigated two to three times per week.
In summary, the long-term sustain-ability of processing tomato yield under subsurface drip irrigation in these salt-affected soils will require:
Subsurface drip irrigation in the marginal soils we tested was very profitable, which has encouraged growers to convert additional acreage in this area. However, where high tomato yields are obtained under furrow and sprinkler irrigation, converting to drip irrigation may not be as profitable because the potential for large yield increases may be reduced; any increase in revenue under drip irrigation may be insufficient to offset the capital, energy, maintenance and management costs of subsurface drip irrigation. Also, using drip irrigation on lower-valued crops may be unprofitable even if yields increase.
Drip irrigation increases tomato yields in salt-affected soil of San Joaquin Valley

