


All Issues
Rice is more sensitive to salinity than previously thought
Publication Information
California Agriculture 56(6):189-198. https://doi.org/10.3733/ca.v056n06p189
Published November 01, 2002
PDF | Citation | Permissions
Abstract
Field studies conducted by UC and under controlled greenhouse conditions by the U.S. Department of Agriculture's Agricultural Research Service indicate that rice is more sensitive to salinity than current guidelines suggest. This information is particularly important to rice growers who have experienced salinity problems after holding water on fields for longer time periods to reduce pesticide loading into the Sacramento River. Our field experiments show that an average seasonal salinity of the field water in excess of 1.9 deciSiemens per meter (dS/m) can reduce grain yields; current guidelines indicate that salinity affects rice yield at or above 3.0 dS/m. Salinity had a negative impact on a number of yield components including stand establishment; panicles, tillers and spikelets per plant; floret sterility; individual grain size; and even delayed heading. The emergence and early seedling growth stages were most sensitive to salinity, as was the three-leaf to panicle-initiation stages. Irrigation management practices should be adopted to minimize salinity during these critical growth stages.
Full text
Research by UC and the U.S. Department of Agriculture's Agricultural Research Service (USDA-ARS) suggests that salinity has reduced rice yields on several farms in Colusa and Glenn counties over the past decade. Scardaci et al. ( see p. 184 ) found that salinity monitoring in various fields indicated that the electrical conductivity (EC) of the soil and field water in bottom basins was significantly higher than in top basins. An indicator of the salinity hazard, EC increases in direct proportion to the salt concentration in the water. (EC units are reported in deciSiemens per meter [dS/m] or millimhos per centimeter [mmhos/cm]; both units are numerically equivalent.) Salinity reduced crop yields in the lower basins of a number of fields.

Salinity has reduced rice yields on some farms in Colusa and Glenn counties. Research using large metallic rings, above, indicates that current salinity guidelines for rice may need updating.
The literature indicates that rice is sensitive to salinity, particularly during the seedling stage (Maas and Hoffman 1977). Current guidelines (Maas and Grattan 1999; Hanson et al. 1999) indicate that rice yields decrease 12% for every unit (dS/m) increase in ECe (average root-zone EC of saturated soil extract) above 3.0 dS/m.
Salinity guidelines were first developed by Maas and Hoffman (1977), who suggested that the salt tolerance of a crop is best described by plotting relative yield as a continuous function of soil salinity. Their guidelines for rice were based largely on laboratory research conducted between 1959 and 1972 on obsolete cultivars. The guidelines have since been used internationally (Ayers and Westcot 1985) and appear as the standard in current literature (Maas and Grattan 1999) and current grower manuals (Hanson et al. 1999). Newer revisions include guidelines for new crops and adjustments to old guidelines where new research has since emerged However, until now no new research has been conducted on field-grown rice to verify or modify these guidelines.
Scardaci et al. (p. 184) suggest that the salinity problems observed in grower fields over the past decade were aggravated by water management practices designed to reduce pesticide concentrations in the Sacramento River. The water quality of the river has been improved substantially since the early 1990s by holding water in pesticide-treated fields for extended periods of up to 30 days and using closed irrigation systems, such as static basins or those that recirculate the water through a series of basins. However, these practices, while decreasing pesticide concentrations in the receiving river, increased the potential for field salinization. While salinity of the soil and field water in top basins was about the same as the irrigation water source, the salinity of lower basins was substantially higher. This difference indicates that salt concentrations in the lower basins are increasing by evapoconcentration.

UC scientists install the rings into a grower's field to the depth of the plow pan, about 4 to 6 inches. Rice was then sown and cultivated in the fields as usual by growers, while researchers flooded the rings with water at various salinity levels.
In light of these findings, we conducted controlled salinity studies at the USDA-ARS George E. Brown, Jr. Salinity Laboratory in Riverside and in a Colusa County rice field. The objective was to quantify the relationship between salinity, seedling survival, stress timing, crop growth, grain yield, and how yield is partitioned into these components. This research was also used to verify or modify current salinity guidelines for California-grown rice.
Field study with metallic rings
A controlled field study was conducted in 1996 and 1997 in the Colusa County grower's field using metallic rings. In 1996, the field was planted to an early rice variety, M-103, while in 1997 it was planted to M-202. In 1996 aluminum-ring basins (8-foot diameter) were used, and in 1997 galvanized rings were made by cutting a 5-foot-diameter culvert pipe into 2-foot sections. The rings were-installed in the soil to the depth of the plow pan (the high-density layer below the plowed zone) — about 4 to 6 inches. Each ring was flooded using irrigation waters that varied in salinity.
Rice growth and plant development within the rings were fairly uniform and there were no visual border effects. That is, plants directly next to the ring walls were stunted as much as others within the ring. Those directly outside the ring were no different from plants in the field, suggesting that the effective rooting system of rice is shallow, reportedly in the surface 4 inches of soil (Pearson 1959).
In 1997, but not 1996, plots were presalinized prior to seeding. This was done to test the influence of salinity on seedling emergence and overall stand establishment.
Rice is grown in flooded fields, at levels that can vary throughout the season. Saline irrigation water was prepared in 1,000-gallon tanks. Ring-plots were flooded using prepared irrigation waters that varied in salinity, with targeted EC values of 0.4 (control/grower water), 1.0, 2.0, 4.0, 6.0, 8.0 and 10.0 dS/m. Saline irrigation water was prepared by adding known quantities of various salts in proportions that produced water close to the same ionic composition as that in rice-growing areas currently affected by salinity. Sodium chloride (NaCl), calcium chloride (CaCl2), magnesium sulfate (MgSO4) and sodium sulfate (Na2SO4) were added in a molar ratio of 10:1:2:1. These seven salinity treatments were replicated four times (three times in 1996) in a randomized block design. Plots were monitored two to three times weekly for EC and water depth. The water depth within the rings was close to that of the field water. Water of either an equal or lower salinity was added several times each week to the plots to maintain water levels and EC values as close as possible to the targeted level.
Seeds were sown directly into the rings and surrounding fields by airplane as is standard practice in the region. Plant growth and development were measured at various times throughout the season. Among parameters measured were seedling and tiller density (number per area), tillers per plant, timing of panicle initiation, heading date, floret sterility, plant biomass and grain yield at the end of the season. As rice develops, it produces tillers (grasslike sprouts) from the main stem. Panicles (reproductive organs bearing seeds) begin to develop on the tillers and the main stem about 25 days before heading, when 50% of plants have at least one visible panicle. The rice plant is at the booting stage when the panicles begin to swell and are visible at the base of the leaf sheath. Next the flowering stage occurs with the formation of spikelets, which, if fertile, produce seeds.
The data is presented based on the seasonal, time-weighted average EC of field water (ECfw) in each ring (0.4 to 12.0 dS/m). Soil samples were also collected at different times throughout the season. In 1997, there was a linear relationship between salinity in the top 3 inches of soil taken at the end of the season and average field water salinity (ECe = 1.17 x ECfw + 1.2, r2 = 0.88). Samples from the standing water and underlying mud or soil all produced high correlation coefficients with plant variables where standing water in relation to biomass gave the highest correlation (r = -0.86)(Shannon et al. 1998).
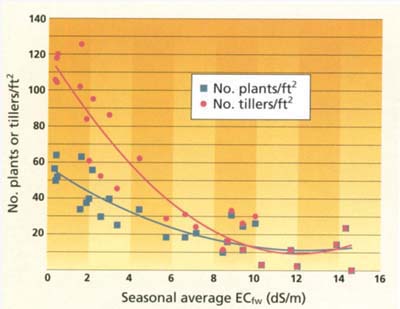

Fig. 2. Effect of salinity on rice heading in Colusa County field study. Weighted average is based on 62 days after seeding.
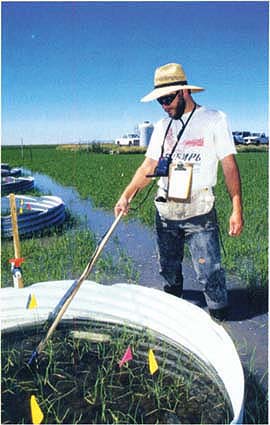
Salinity levels were measured by monitoring the electrical conductivity of the irrigation water; conductivity increases with salinity. Former UC Davis post-graduate researcher Bill Thomas takes measurements in the field.
Effects of salt stress in field
At 28 days after seeding, visual observations showed severely salt-stressed seedlings that were smaller, had fewer tillers, less root mass, and shorter, thinner, chlorotic leaves compared to nonsalinized control plants. Moreover, the data indicate salinity had a profound influence on plant and tiller density (number per area) (fig. 1). Reductions in plant and tiller density followed a quadratic function (r2 = 0.76 and 0.89, respectively). At an EC of 3.0 dS/m, the currently published salinity threshold for rice yield, plant and tiller densities were reduced by one-third and 40%, respectively, compared to nonsalinized controls (EC = 0.4 dS/m). This data supports the claim that rice is very sensitive during the seedling and early development stages.
At 28 days after seeding, salinity reduced the number of tillers per plant in a linear fashion (r2 = 0.72) with increasing salinity (Grattan et al., unpublished data). We also found a relatively good second-order relationship (r2 = 0.75) between salinity and days after seeding to 50% heading (fig. 2). At 10 dS/m salinity, it took plants roughly 6 additional days to reach 50% heading compared to nonsaline controls. Data collected in 1996 also showed delayec panicle initiation by salinity.
Biomass data collected at harvest indicated that salinity had profound effects on shoot and root growth as well as panicle yield. As with nearly all crops, salinity reduced shoot growth more than root growth. In 1997, salinity reduced straw yield in direct proportion to grain yield (data not shown), therefore at no effect on the harvest index (the fraction of total shoot biomass comprised of grain). This was not the case in 1996 when salinity reduced the harvest index.
The discrepancy in harvest index between years can be partly explained by salinity's differential response to sterility. In 1996, salinity increased the percentage of sterile florets in a given panicle such that percent sterility increased with increasing salinity. The number of filled grains per panicle equaled -3.41 EC plus 52.3 (r2 = 0.74). Results in 1996 agreed well with results from greenhouse studies conducted in the United Kingdom. While salinity increases sterility in rice, little is known about the underlying cause (Khatun and Flowers 1995). Greenhouse studies from the United Kingdom showed that salinity delayed flowering, and reduced productive tiller number, fertile florets per panicle, weight per grain and overall grain yield (Khatun et al. 1995). In our 1997 study, however, salinity had little influence on percent sterility (data not shown).
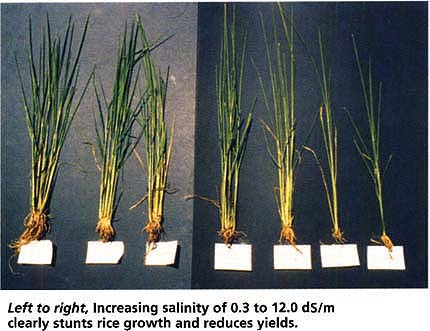
Left to right, Increasing salinity of 0.3 to 12.0 dS/m clearly stunts rice growth and reduces yields.
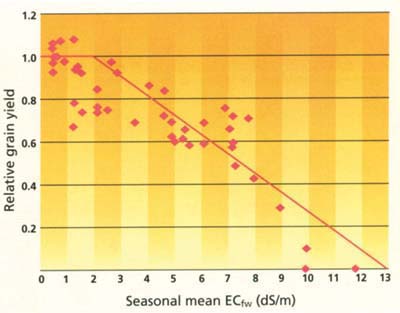
Fig. 3. Based on field study results from 1996 and 1997, rice grain yield decreased as salinity in field water increased above 1.9 dS/m.
The grain yield reduction in 1997 by salinity was attributed to both the reduction of panicles per area and individual seed size. In 1996, reduction in grain size and perhaps an increase in the number of sterile florets were the primary causes for yield reduction under saline conditions. In both years, strong linear relationships were found between increasing salinity and decreasing seed size. For example, with decreasing 1,000-kernel weight (the weight of a thousand kernels of rice), r2 was 0.94 and 0.79 for 1996 and 1997, respectively, even though this effect was small.
New salinity coefficients for rice
In order to determine the appropriate salt-tolerance guidelines for Sacramento Valley–grown rice, grain yield data for 1996 and 1997 was converted to a relative basis, combined and plotted (fig. 3). A piecewise linear model (Maas and Hoffman 1977) was used to calculate the salinity threshold and percent slope of the regression. This method uses a number of least-squares iterations until the best-fit threshold and slope are found. A threshold of 1.9 dS/m and slope of 9.1% best fit the combined data set. Yield data at salinities less than 1.9 dS/m was considered insignificantly different and the yield maximum was determined as the average. The yield potential of rice based on salinity of the field water can be estimated using the following formula:
% yield = 100 - 9.1 (ECfw - 1.9)where ECfw is the seasonal, time-weighted average salinity in the field water.
These data indicate that the actual salinity threshold (1.9 dS/m) for rice grown in the Sacramento Valley is less than current guidelines indicate (3.0 dS/m), suggesting that rice is adversely affected by salinity at a lower level. (Because rice is grown under flooded conditions and the majority of active roots are within the top 4 to 6 inches of the soil profile, much of which is uncon-solidated mud, we assumed that ECe is equivalent to ECfw.) However, percent slope is not as large (steep) as in the current guidelines. This indicates that the reduction in yield with increasing salinity above the threshold does not drop off as rapidly as current guidelines suggest. Nevertheless, C50 values are comparable between our findings and those using the current guidelines. The C50 value is the average salinity level (EC) resulting in a 50% yield reduction. The C50 value for our data is 7.4 dS/m; the value from the Maas and Grattan (1999) guidelines is 7.2 dS/m.
There are obvious advantages to conducting salinity experiments in the field, but not all variables (such as climate) can be readily controlled. More-over, it is difficult to create transient salinity conditions in order to identify growth stages of rice that are particularly sensitive. These, however, can be readily controlled in the greenhouse.
Greenhouse studies in sand tanks
A series of follow-up greenhouse studies was conducted at the USDA-ARS George E. Brown, Jr. Salinity Laboratory in Riverside from 1997 through 1999. These studies were designed to investigate the influence of salinity on rice seedling growth, plant stand and grain yield under controlled conditions, as well as to determine salinity sensitivity at different growth stages.
The experiments were conducted in sand tanks (48-by-24-by-18-inches deep). Seeds were presoaked, sown directly in the sand and established with a nutrient solution. The water level was controlled between 0.4 to 0.8 inches (1 to 2 centimeters) the first week, and 2.0 to 3.1 inches (5 to 8 centimeters) thereafter. Salts (mixtures of sodium chloride and calcium chloride at 2:1 or 5:1 on a molar ratio) were added to the solutions either 5 days after seeding or at a later growth stage, depending upon the particular experiment. Final treatment salinities varied between 0.9 to 1.1 dS/m (nonsalinized control) up to 12.0 dS/m for the highest treatment.
In one series of experiments, seven salinity treatments were tested in a randomized block design with five or six replicates. Rice seedlings (M-202) were harvested at incremental times ranging from 11 to 25 days after seeding. Harvested shoots were separated into various components and dried. Data in reiation to duration of salinity exposure was expressed as cumulative thermal time (degree-days) or days after seeding.
Another study was conducted to test the sensitivity of rice (M-103 and M-202) to salinity at different growth stages. In these experiments, three salinity treatments (1.8, 3.2 and 4.6 dS/m) were tested along with five salt-stress-timing treatments: salinized on the day of seeding, one-leaf, three-leaf, panicle-initiation and booting stages. Salt stress was relieved after 20 days in each timing treatment.
Seedling survival and growth
In the first series of experiments, salinity dramatically reduced seedling survival (Zeng and Shannon 2000a, data not shown). The relationship between seedling survival and salinity in the greenhouse study was similar to seedling density per area versus salinity in the field-ring study, although the impact was not as great. In the greenhouse study, seedling survival was reduced about 20% at 3.0 dS/m, whereas plant density was reduced by one-third in the ring study at a similar salinity level.
In controlled laboratory studies conducted at the USDA George E. Brown, Jr. Salinity Laboratory in Riverside, salinity-stressed rice developed white tips.
Salinity also significantly reduced seedling growth (Zeng and Shannon 2000a, data not shown). Seedling growth of rice is dependent on both salt concentration and time of exposure. At lower salinities, longer exposure times were needed to produce measurable effects. For example, in one experiment, 3.2 dS/m significantly reduced seedling biomass at 17 days after seeding or 788°F degree-days (420°C degree-days) whereas 1.9 dS/m significantly reduced seedling biomass at 20 days after seeding or 923°F degree-days (495°C degree-days). Both the greenhouse and field studies confirm that rice is very sensitive to salinity during early seedling growth and that EC levels in standing water as low as 1.9 dS/m may affect growth and development.

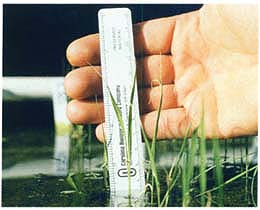
Researchers studied the impacts of salinity on yield, in conjunction with other factors such as seeding rates, salinity timing and water depths. In this study, the control was compared with a low-salt treatment.
Yield components and stress timing
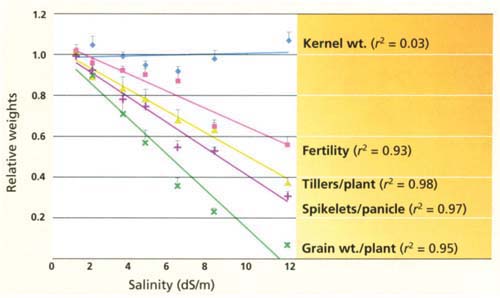
Rice grain weight per plant decreased linearly with increased salinity, but salinity affected the various yield components differently (fig. 4). Seed size was relatively unaffected (1,000-kernel weight) at any of the salinity levels tested, but there was a profound reduction in fertility (such as, increased sterility), tillers per plant and spikelets per panicle.
Grain yield data (grain weight per plant) from the greenhouse experiment conducted in 1997 using M-202 was used to calculate the C50 value by the model developed by van Genuchten and Hoffman (1984). The C50 value from our data is over one-third less than that calculated with the original data and model used to develop the current guidelines. Statistical analyses of our greenhouse data confirmed those finding from the field, again suggesting that the salinity threshold value for rice is lower than current guidelines indicate.
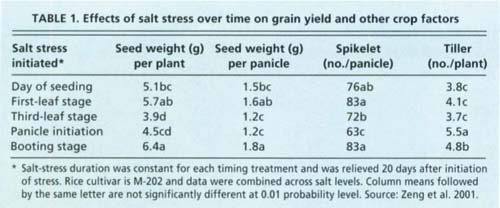
Stress timing had a large influence on the overall sensitivity of rice to salinity (table 1) (Zeng et al. 2001). The reductions in spikelets per panicle, seed weight per panicle and tillers per plant were greatest when plants were stressed between the three-leaf and panicle-initiation stages. An approximate 20-day interval between these developmental stages was the most sensitive. Spikelet number per panicle was also significantly reduced by salinity imposed between panicle-initiation and early booting stages. However, tillering was not sensitive to salinity imposed during this period and, therefore, the overall impact on grain yield was less.
Seeding rates and water depth
Changes in certain management practices such as seeding rates (number of seeds per area) and depth of standing water may affect the salt sensitivity of rice plants. Understanding the influence of such changes is necessary to develop management strategies for ameliorating yield losses in salt-stressed rice. Another series of greenhouse studies was conducted at the USDA-ARS Salinity Laboratory during 1998 and 1999 to investigate these possibilities.
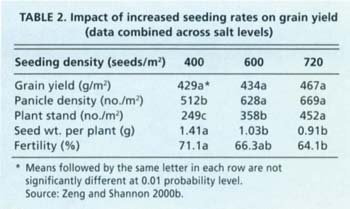
One study was conducted at three seeding densities — 400, 600 and 720 seeds per square meter (equivalent to 100,150 and 130 kilograms per hectare, respectively), and three salt levels — 1.0 (control), 3.9 and 6.5 dS/m. Plants were grown in sand cultures as described above. The results indicate that salinity sensitivity increased with increasing seeding density (Zeng and Shannon 2000b). Grain weight per plant decreased and sterility increased with increasing seeding density (table 2). Although high seeding density also increased plant stand and panicle density, these increases were offset by reduced seed weight per plant and increased sterility. As a result, final grain yield was not significantly increased at high seeding density. Therefore, there is no evidence to suggest the economic feasibility of increasing seeding rates to overcome yield losses under salt-stressed conditions.
Another study was performed to determine the responses of rice growth and yield to different water depths using saline irrigation water. Plants were grown at seven water depths ranging from 1.7 to 7.9 inches (4 to 20 centimeters) under different salinities (0.9 to 6.0 dS/m). The results indicated a negative correlation between water depth and plant growth under salt stress (data not shown). Rice seedling establishment and grain yield decreased with increasing water depth during irrigation with saline water. Under moderate salinity, and without competition from weeds, plants grew better in shallow water (approximately 4 inches) than deep water (more than 4 inches).
Implications for rice growing
The field and greenhouse research reported here indicates that rice production in the Sacramento Valley is more sensitive to salinity than current guidelines indicate. Data suggests that California rice varieties M-103 and M-202, grown under Sacramento Valley conditions, have a salinity threshold of 1.9 dS/m rather than 3.0 dS/m, and that the yield-decline slope is 9.1% rather than 12%. These findings are important for policy decisions regarding water quality standards and water allocation requirements. These quantitative studies suggest that rice will not be affected by salinity provided that the seasonal mean EC of the field water is maintained below 1.9 dS/m. Care should also be taken to ensure that fields do not have inherently high soil-salinity levels.
Identification of salt-sensitive growth stages is important for managing irrigation water and controlling salinity. The field studies indicate that rice stand establishment is very sensitive to salinity. In addition, the greenhouse stress-timing studies indicate that a 20-day period between the three-leaf and panicle-initiation stage was most sensitive to salinity in terms of seed yield. This suggests salinity levels can increase in rice fields to moderate levels above the threshold without compromising grain yield, provided this occurs only for short periods after the booting stage.
The development of appropriate management practices is critical for optimizing rice performance under saline or potentially saline conditions. Our studies demonstrate that yields cannot be improved under salt-stressed conditions by increasing the seeding rate. Moreover, high field-water levels are more growth limiting than shallow water levels. Therefore, rice growers facing salinity problems should adopt irrigation management strategies that maintain low levels of salinity stress during early seedling development and between the three-leaf and panicle-initiation stages, while minimizing high field water levels. Growers should also be aware, however, that salinity levels could increase in shallow water (such as, with a large surface area and small volume of water) quite rapidly under highly evaporative conditions.
At the same time, such water management practices must ensure that sufficient times are allowed for the pesticides to break down naturally, such as recirculating the water among basins before discharging into public waterways. There may be some cases where it is impossible to hold water for extended periods (to promote pesticide degradation) and avoid salinity problems at the same time. In such cases it is possible state agencies may issue permits for fields where water salinity levels exceed a certain salinity (such as 2 dS/m), allowing the emergency release of field water.
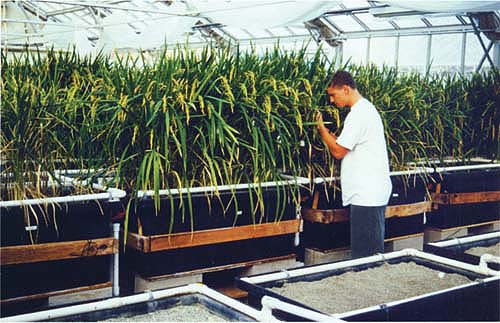
In both the greenhouse, above, and in the field, rice was more sensitive to salinity than has been previously observed. The combined data from both series of studies indicates a rice salinity threshold of 1.9 dS/m rather than 3.0 dS/m. Timing is important: Rice growers should attempt to reduce salinity stress during the early seedling stage and between the three-leaf and panicle-initiation stages.
Rice is more sensitive to salinity than previously thought

