


All Issues
Potential economic impacts of irrigation-water reductions estimated for Sacramento Valley
Publication Information
California Agriculture 55(2):33-40. https://doi.org/10.3733/ca.v055n02p33
Published March 01, 2001
PDF | Citation | Permissions
Abstract
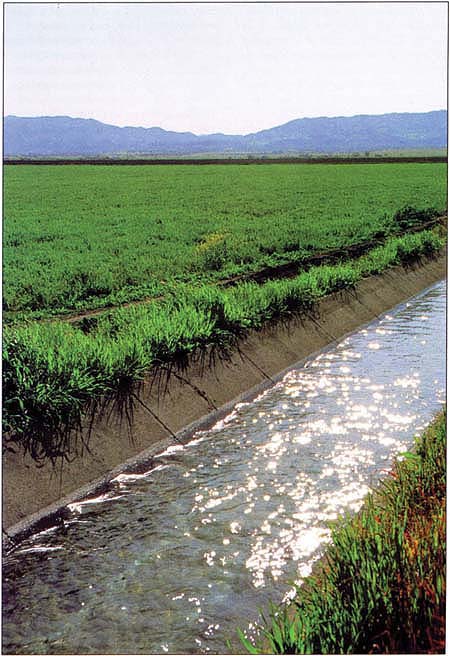
In the Sacramento Valley, irrigation water is vital to agriculture and agriculture is vital to local economies. This study investigates these relationships by asking: If surface irrigation water were cut by 25%, what would be the economic impacts on farmers and on communities? The study results indicate that the effects would not be uniform across crops and the eight counties in the Sacramento Valley. In most regions and for most crops, a cut in irrigation water would cause a modest acreage reduction of up to 3%. Overall crop-revenue losses for core regions would total $8 million while the loss for the entire Sacramento Valley would be $11 million. About 80% of those losses would take place in poorer counties that depend most heavily on agriculture, and particularly on rice. However, in response to surface-water reductions, farmers and others would mitigate their losses by making adjustments such as conserving water, changing cropping patterns or implementing new technologies.
Full text
We all know that water is important. In particular, water is an essential input for farm production, and California farmers have faced some severe shortages. As water becomes more scarce, farmers act to minimize their losses by adopting water-conserving technologies, shifting from more water-intensive crops to less water-intensive crops, or increasing their reliance on ground-water. These agricultural effects translate through the rest of the economy.
This article is drawn from a longer Agricultural Issues Center report, “Economic Impacts of Irrigation Water Cuts in the Sacramento Valley.” The full report may be ordered for $12 from A1C by calling (530) 752-2320.
The authors constructed a model to estimate the economic impacts of a 25% cut in surface irrigation water in the Sacramento Valley.
This paper analyzes the effects of reduced irrigation water supply on the economies of the Sacramento Valley region. The specific economic variables examined are changes in acre allocations, farm revenues and general economic health of the county, including personal income and employment. The study area includes Butte, Colusa, Glenn, Sacramento, Sutter, Tehama, Yolo and Yuba counties. All these counties have large farming industries and, except for Sacramento and Yolo counties, agriculture is a dominant industry. The importance of agriculture throughout the region underscores the importance of irrigation water supply.
Reducing the supply of irrigation water will be felt first at the farm. In response to less available and probably more costly water, farmers alter their production patterns by adjusting their input use and output production. Fewer acres cropped and lower farm revenue reduce the region's commercial activities and overall county personal income. By calculating these “multiplier effects,” we trace the impact of potential irrigation water reductions through to the broader regional economy. Although some calculated impacts, such as on crop acreage and county revenue, are in the single-digit percentages, such declines can have broad economic implications for an entire region.
Our analysis of a hypothetical surface-water reduction utilizes an economic simulation model based on past behavior and profit-seeking by farmers. We consider a scenario of an arbitrarily chosen 25% cut in surface irrigation water to which one response is a 10% increase in groundwater use. (Effects on groundwater recharge and quality were not considered.) Finally, the time period considered in our model to adjust from one equilibrium to another is regarded as an intermediate run with the length of 2 to 3 years.
Economy of Sacramento Valley
The eight Sacramento Valley counties contain almost 7% of the state's geographic area and 5% of its population. The population is denser in the two more urban counties, Yolo and Sacramento. These counties also dominate the region's economy. Personal income in Sacramento County accounts for 70% of the Sacramento Valley's total personal income, $31 billion, and together with 10% for Butte County and 9% for Yolo County, accounts for almost 90% of the Valley's total personal income. (All our descriptive statistics are, unless mentioned, in 1992 figures.) Colusa and Glenn counties account for only 1% each, the lowest share. (Personal income of a county is the sum of wages and salaries earned, and the value of products produced by county residents.)
Wide variations in per capita personal income also exist between counties. Although per capita personal incomes of all eight counties are below the state average of $21,348, Sacramento and Yolo counties closely follow the state level. The rest of the counties fall between 60% and 90% of the state's average. In fact, Tehama and Yuba counties are among the poorest in California with per capita personal incomes ranking 56th and 57th out of 58 counties.
From the perspective of our study it is useful to know each county's economic reliance on agriculture. For this measure, the sales value of farm products is calculated as a ratio of personal income in that county. Colusa and Glenn counties, with shares of 54% and 46%, show the largest relative scale of farm economy and Sacramento County, with 1%, the lowest share. The rest of the counties range between 6% and 17%. In general, the counties characterized by higher agricultural shares in their personal incomes are the lower per capita personal income counties. Therefore, any disruption of agricultural production may have relatively greater impacts on the economies of counties that rely heavily on agriculture.
Crop production and irrigation
The Sacramento Valley is endowed with natural water resources. The surrounding mountains and its five major rivers provide abundant water supplies. With these natural advantages, this area has developed major agricultural industries. The Sacramento Valley grows a wide variety of crops including the two most important, rice and orchard crops (almonds, walnuts, stone fruits and olives), as well as wheat, alfalfa hay and vegetables.

TABLE 1. Water use by source and overall water reduction under a 25% surface-water cut and 10% maximum groundwater increase

Rice.
Rice accounts for almost 30% of the crop acreage and provides 25% of total crop revenue in the Sacramento Valley. Except for Tehama and Sacramento counties, the Valley is one of the nation's major rice-producing areas with more than 90% of California's rice land. The rice crop is the single largest irrigation water user in the state, and also the most intense user on a per-acre basis. Rice uses 6.7 acre-feet while some crops such as grapes use as little as 1.3 acre-feet (DWR 1994).
Orchards.
Orchards account for 22% of all crop acreage in the Valley. The economic significance of orchard crops is substantial in all counties. The farm revenue share of orchard crops ranges from 91% in Tehama County to 16% in Yolo County, with an overall 44% share in the Sacramento Valley.
Vegetables.
Vegetables, which supply 18% of the Sacramento Valley's crop revenue, are economically important in Colusa, Yolo and Sutter counties. Yolo County, the most important vegetable producer in the Valley, receives more than 50% of county crop revenue from vegetable production, primarily from processing tomatoes.
Agriculture in the Sacramento Valley is relatively more irrigation-intensive compared with the rest of the state's farmland, accounting for about 30% of the state's entire agricultural water use over roughly 23% of its total irrigated crop area. Irrigation water is supplied to the Sacramento Valley mainly from five sources (listed in descending order, by volume):
-
Groundwater supplies almost half of the irrigation water in the Sacramento Valley.
-
Local surface supplies, including natural rainfall and captured runoff, are the second largest source.
-
CVP settlement and exchange water goes to those who hold pre-1914 water rights and have a project water supply arising from settlement agreements.
-
State Water Project water comes from California's state-owned and -operated water project.
-
Central Valley Project (CVP) water is delivered under federal contracts.
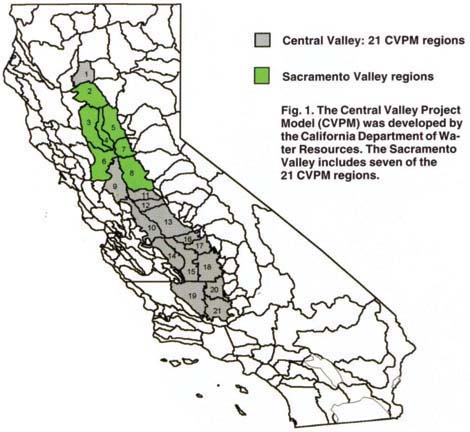
Fig. 1. The Central Valley Project Model (CVPM) was developed by the California Department of Water Resources. The Sacramento Valley includes seven of the 21 CVPM regions.
To identify the water sources in the Valley, we use seven hydrologic regions, as defined by the California Department of Water Resources (DWR) (fig. 1). (The water data are available only by region.) Groundwater and local supplies are the major sources for almost all regions. The CVP and state project deliveries are relatively less important, except for region 5, which receives all its water supply from this state source. These five supply sources are further combined into two broadly defined sources, surface water and groundwater (table 1). These sources supply 51% and 49%, respectively, of the Sacramento Valley's irrigation water.
Modeling water cuts
Our model of a 25% cut in surface water first alters the way farm resources are allocated among competing crops. Importantly, cropland is reallocated and irrigation water is redistributed in order to minimize the reduction in profits. To investigate these links, we adopted the Central Valley Project Model (CVPM) that was initially developed by DWR for such analyses (Bureau of Reclamation 1997; DWR 1994).
This model is based on an optimization technique known as positive mathematical programming (PMP). The most important aspect of the PMP technique is that it allows marginal conditions to vary while average conditions calibrate to the base-year data. In other words, PMP uses the observed acreage allocation to derive a net revenue relationship that has a decreasing return per acre as the crop acreage expands in a given region. This decreasing return calculation is based on what we know from experience to be actual returns in this region. Decreasing crop profitability is mostly caused by the decreasing availability of quality land. The model assumes that farmers are fully aware of land effects and that they allocate crops to maximize expected profits from a farm. This changing profitability is contrasted to other optimization models that assume a fixed profitability (Howitt 1995). The model used for our analysis consists of an objective function, resource constraints and an irrigation technology equation.
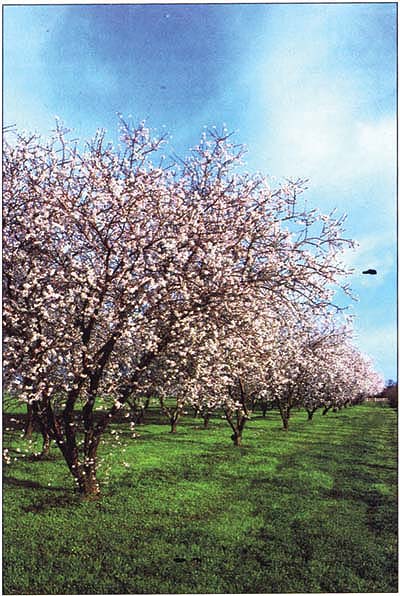
Orchards account for about one-fifth of the crop acreage in the Sacramento Valley, but are not expected to cause major revenue losses following an irrigation water cut.
The objective function maximizes the sum of net producer revenue and net consumer benefits. Net revenue is defined as total sales revenue minus irrigation costs and other variable costs. Resource constraints consist of two sets, constraints on total irrigation water available and constraints on total cropland available. A variety of crops are aggregated into 10 categories (table 2). Because of their dominance and economic importance, individual crops such as rice and tomatoes are separated out as individual categories.
Water transfers.
The model allows water transfers within a region, but allows no transfer across the region boundary. These regions are relatively homogeneous, but may include several water districts and parts of more than one county. In reality, water is in general not fully transferable within a local region and may be partly transferable across regional boundaries. While our two assumptions on transfer-ability may be offsetting, we think the economic impacts may be underestimated slightly due to our configuration of a region that encompasses many water districts. Water trading is also an important assumption. Zilberman et al. (1994) examined the economic impact of water cuts in the Central Valley under the scenario of water trading and showed that the economic loss due to a water cut can be reduced more than 50%.
Efficiency improvements.
The analysis allows for the fact that farmers can adjust to a water shortage by increasing efficiency of their irrigation systems but only at a significant cost. Irrigation systems in the Sacramento Valley have been steadily improved in recent years, and the model assumes that additional gains are possible and would be made if water were even more scarce. In our model, farmers respond to the water cut by adjusting irrigation-systems costs and associated applied water or irrigation efficiency. However, these two water-associated inputs are related through a technical constraint, a constant elasticity of substitution isoquant that governs the trade-offs between system costs and water efficiency. Subject to this constraint, farmers choose water-related inputs (along with other inputs) to maximize their profits.
Prices.
Output and input prices are treated as constants. Possible price effects of changes in crop output resulting from the 25% cut in water supply are not included (they are expected to be quite small). For example, even though the study area produces much of the national output of japonica rice, projected effects on global and local rice prices are expected to be small because supply shifts are limited to only 1% or 2%. The consequence of the constant price assumption in our application is that net consumer effects are quite small.
CVPM regions.
The CVPM is based on geographical units, called CVPM regions, that are configured by DWR in accordance with water distribution channels and the construction of DWR's water data. The Sacramento Valley includes:
-
Region 2, Far North (mostly Tehama County).
-
Region 3, Northwest (mostly Glenn and Colusa counties).
-
Region 4, Sacramento River (mostly the river areas of Colusa and Sutter counties).
-
Region 5, Northeast (Butte and Sutter counties and part of Yuba County).
-
Region 6, Yolo-Solano (Yolo and Solano counties).
-
Region 7, Southeast (northern Sacramento County and southwest Placer and Yuba counties).
-
Region 8: Sacramento-San Joaquin (most of Sacramento County and northern San Joaquin County).
Scenario.
In our model, we hypothesize the following water-reduction scenario. Surface water (including CVP, state and local water) is reduced by 25%, but this reduction is accompanied by an increase in groundwater use by a maximum of 10% from 1992 levels. We chose 1992 as a base year because (1) cuts in irrigation water represent policy options that may be more likely considered and adopted during the drought periods, and (2) 1992 represents the most recent drought year. One reaction to a surface-water cut may initially be increased use of groundwater. However, availability of groundwater for further pumping is limited. In order to reflect this situation, the scenario allows the additional supply of groundwater but is limited to a maximum of 10%. We believe our 10% assumption is reasonable, but it may exclude the situation that prevails under a severe extended drought (table 1). To reflect the sensitivity of the model results to the different reference periods, our original research (Lee et al. 1999) considers an alternative base period. Altering the base period causes no major changes in results.
Model responses to reductions
In our model, each region responds to the surface-water cut in an optimal way depending on its water situation and pattern of agriculture. In general, there are three ways that a farmer can respond. First, the farmer can alter the crop mix, toward a higher proportion of less water-intensive crops or higher value crops. Second, the farmer can apply less water. Third, the farmer can make an investment in technology that improves water efficiency (indicated by positive water-systems costs). These responses are all aimed at minimizing the reduction in farm net income resulting from the irrigation water cut. Our model allows all three options and finds a combination of responses that minimizes the net income loss (Bureau of Reclamation 1997).
Table 2 presents our model results on the changes in acreage under the 25% water-cut scenario. Some effects are dramatic. In the Northwest region, irrigated pastureland falls by 27%. There are also cases where acreage increases. In most regions and for most crops, a cut in irrigation water causes an acreage reduction of up to 3%. However, this rate of reduction seems to be relatively modest, given the 13.6% water cut (table 1). Farmers are, therefore, likely to respond to a water cut mainly by adjusting their cropping patterns, rather than retiring acreage. Among all crops, pastureland has the largest proportional acreage cut. Crops such as vegetables and orchard crops, with high value per unit of water, experience little acreage reduction. Furthermore, increases in area planted tend to occur more often with field crops and small grains that require relatively little water. These adjustments are consistent with profit maximization. When there is a constraint placed on input, in this case water, — production tends to shift from more water-intensive crops to less water-intensive crops.
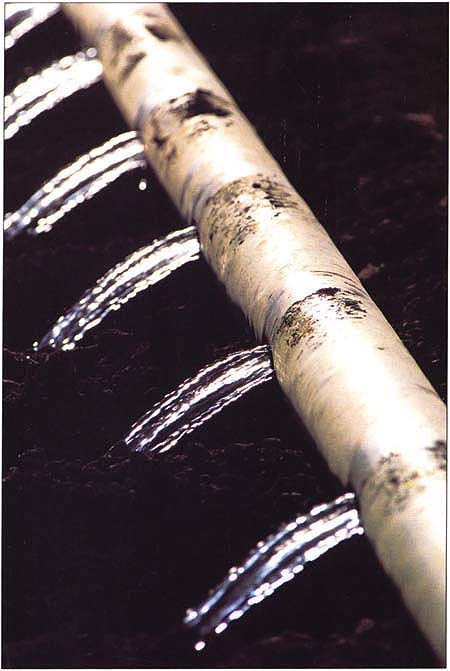
Our model also allows for an adjustment of irrigation systems. As surface water becomes scarce, farmers improve irrigation systems, increase water efficiency and apply less irrigation water (table 3).
For most crops, the optimal input mix is higher systems costs with lower water applications. Among all crops, rice shows the largest proportional increase in water-systems costs, simultaneously with the substantial cut in applied water per acre. The impact of the surface-water reduction depends on the region's groundwater availability. As expected, improvement in irrigation systems is more pronounced in regions 3, 4, 5 and 7 where surface water is a more important source than groundwater, while smaller adjustments are realized in regions that rely more heavily on groundwater. The Far North and Sacramento-San Joaquin regions rely heavily on groundwater in their irrigation water supplies (table 1). This implies that the effect of the 25% surface-water cut in these regions is relatively small and we may expect smaller impacts on agriculture than in other regions (table 3).
We do not present regional farm-revenue for effects by crop here, but the major revenue loss in most counties occurs with rice; the Northwest region loses $4.2 million of rice revenue, and regions 4, 5 and 6 also experience large losses. As expected, vegetable, fruit and nut revenues are harmed the least by the surface-water cut across regions, and in some cases revenues actually increased for these crops. Across our core area, regions 2 through 5, the major losses were seen in rice, field crops and pastureland.
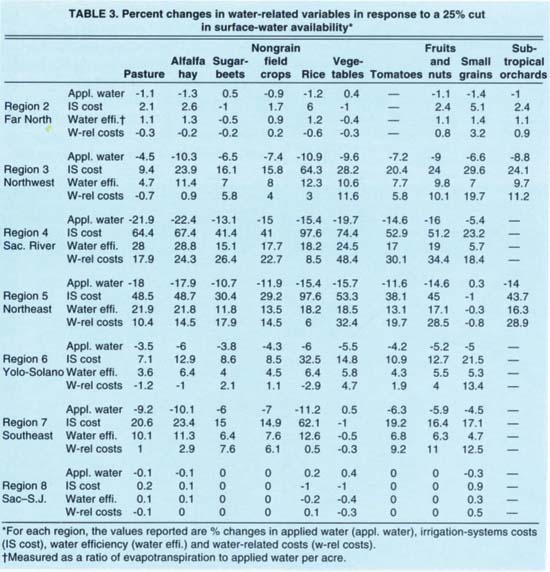
TABLE 3. Percent changes in water-related variables in response to a 25% cut in surface-water availability*
Overall crop-revenue losses for these core regions amount to $8 million while the loss for the entire Sacramento Valley is $11 million. More than three-quarters of total revenue losses occur in rice. The loss in farm revenue is mitigated by the adjustments farmers and others make in response to surface-water reductions. Importantly, water is moved to its highest valued use and water-use efficiency is improved to maximize net farm revenue. The result is a smaller percentage decline in farm revenue than the 25% cut in surface water. Finally, it is worth noting that farmland values are closely tied to net revenue changes from production. Even though further discussion on farmland value is beyond our scope, with relatively active land markets, land prices should move together in proportion to changes in the net income stream.
Economic impacts
We now broaden our focus from the agricultural sector to the overall economy by examining how the declines in farm revenue may trigger a further decline in revenue in the Sacramento Valley. We quantitatively evaluate the effects of a cut in irrigation water on the overall local (county) revenue as well as the effects on the local job market using income and job multipliers.
The economic assessment is made at the county level by first allocating regional agricultural effects across counties. The conversion from region to county is based on crop acreage, with a region's acreage being distributed among the counties of which it is comprised. We developed conversion acreage formulas from region to county based on acreage data collected by California Agricultural Statistics Service, other crop maps, and county agricultural commissioner reports. (Actual conversion formulas are provided in Lee et al. 1999.)
Revenue effects include revenue generated (or foregone) over the entire local economy due to agricultural revenue changes that are measured at the farm-gate level. This includes revenue from packing and shipping, brokerage, and retail activities as well as farm-input-industry activities. Multiplier effects differ across crops, depending on the extent of postharvest activities and whether or not the product is processed. For example, fresh produce such as fruits and vegetables has relatively large income multipliers compared to feed grains such as corn and wheat, because fresh produce requires additional local packing and shipping. Activities that take place outside the county are not included in our multiplier impacts. For example, economic activity generated from crop output in another county is not shown in the revenue totals used here. This suggests that the overall multiplier effect in the Sacramento Valley is likely to be larger than our estimates.

We used income multipliers developed by Goldman at UC Berkeley (Carter and Goldman 1992). The multipliers are specific to crops and counties, and take into account various off-farm activities for each crop category as well as the scale of other activities in each county. They range from 1.2 to 2.5, meaning that a $1.00 change in farm-gate revenue results in a $1.20 to $2.50 revenue change in the overall county economy. Fruits have the highest multiplier among all crop categories. Sacramento County tends to have the highest multipliers across almost all crop categories, which may be due to its large economy as compared to other counties and the fact that many farm-related activities occur there.
As expected, aggregate county revenue effects are generally negative (table 4). Under all scenarios, the smallest revenue loss occurs in Tehama County, and the largest occurs in Colusa County, which alone makes up almost 32% of the total revenue loss for the Sacramento Valley. Glenn and Yolo counties also experience substantial revenue losses. Revenues from water-intensive crops such as rice, pasture and alfalfa, are reduced by a substantial margin.
Revenue from rice decreases the most, accounting for almost 90% of total revenue losses. This occurs in part because rice tends to be particularly dependent on surface water and because it is the most important crop in most counties. Rice revenues have the largest share of revenue in Butte, Colusa, Glenn, Sutter and Yuba counties. However, the 90% share is a very high ratio given that rice contributes only 16% of total crop revenue in the Sacramento Valley. This implies that a reduction in surface irrigation water affects rice production much more severely than other crops, and the economic impact would be greater in counties that have more intense rice production (table 4).
The major rice-growing counties of Colusa and Glenn are the hardest hit. However, Yolo County is not among the major rice-producing counties but its total revenue losses are almost as high as in Glenn County. This is because Yolo County has high total crop revenue compared to other counties. Unlike other counties, Yolo County's losses are spread among various crops. Lee et al. (1999) demonstrate that effects are much larger where the percentage water cut is from a “normal” year base and when ground-water substitution does not occur. In the most extreme scenario, the water cut would cost $46 million in total revenue and more than 300 jobs across the eight counties. Again the losses are largest in Colusa and Glenn counties. The largest revenue loss in Colusa County among all scenarios is more than 5% of the county personal income.
To illustrate what the revenue losses mean more broadly, the total revenue effect for each county is calculated as a percentage of the county personal income (data not shown). Colusa County is the hardest hit, not only by losing the largest amount of revenue, but also by losing the largest percentage (1.6%) of personal income. The next hardest hit was Glenn County (1.08%). These two counties have the lowest personal income among all Sacramento Valley counties, as well as the highest economic reliance on agriculture. (The ratios of the value of agricultural production to county personal income are 0.54 for Colusa County and 0.46 for Glenn County.) For the remaining counties, total revenue effects are less than 1% of county personal income.
Agriculture, water and economies
Each of the counties we examined has a large agricultural industry. Except for Sacramento and Yolo counties, farming itself — primarily irrigated agriculture — is the dominant contributor to the local economy. The importance of agriculture as a primary industry in this region underscores the importance of irrigation water supply. Results of this study indicate at least three general conclusions.
Adjustments that occur within the agricultural production system in response to reduced water supply are crucial. These adjustments are generally found by (1) substituting away from intensive water use by adopting more efficient irrigation technologies, and (2) switching to crops that use less water or earn more dollars per unit of water. Our results show that farmers tend to switch away from water-intensive crops such as rice, pastureland or alfalfa to less water-intensive crops such as small grains.
A reduction in water supply results in relatively greater economic impacts on those counties that are more dependent on agriculture. As expected, revenue losses are highest in absolute and relative terms for those counties with more agricultural output. Colusa County is one of the most reliant on agriculture in its economy (and on irrigation from surface-water sources); therefore, its economy loses the largest overall amount of revenue as well as the largest percentage of personal income, exceeding $5 million per year, or about 1.6% The next hardest hit is Glenn County, at about 1% of county personal income; Glenn County is next to Colusa County in its reliance on agriculture in its economy.
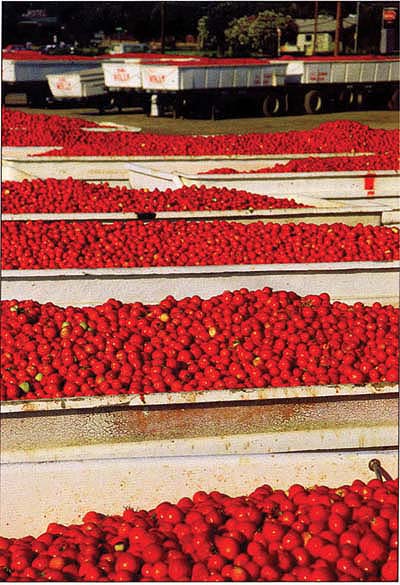
Yolo County receives more than half of its crop revenue from vegetables, primarily processing tomatoes, above. Orchard crops such as slone fruits, olives, walnuts and almonds, below, are among the most important crops in the Sacramento Valley.

Growers would adjust to a loss of irrigation water by adopting more efficient technologies and switching to less water-intensive crops.
Counties that depend heavily on agriculture for their economic livelihoods are also the poorest in the Sacramento Valley. All of the counties that have large agricultural industries tend to have lowest per capita personal incomes. This suggests that the counties with the least economic resources would be hardest hit if the water supply were reduced.
Potential economic impacts of irrigation-water reductions estimated for Sacramento Valley

