


All Issues
Peach trees perform similarly despite different irrigation scheduling methods
Publication Information
California Agriculture 55(1):25-29. https://doi.org/10.3733/ca.v055n01p25
Published January 01, 2001
PDF | Citation | Permissions
Abstract
There are numerous techniques for scientifically scheduling irrigations in tree fruit orchards. These approaches involve measuring soil, plant or atmospheric parameters, then using this information to determine when to irrigate and how much water to apply. We studied the effects of the different irrigation scheduling methods on peach trees in Tulare County. One of the key aspects of irrigation scheduling is being able to interpret the measurements so that the resulting water management decisions produce maximum grower profit with the minimum amount of water. Thus the measurements must not only be accurately taken, but protocols for their interpretation must be reliable in terms of achieving optimal tree performance without wasting water. This requires a marriage of the technology used to take the measurement and the science used to develop the interpretation guidelines. When this is successfully done, we found that the method of scheduling irrigations had no effect on the peach trees' performance.
Full text
Soil-based irrigation scheduling techniques involve measuring either soil water content or a soil property related to soil water content. In general, the objective is to irrigate in such a way that soil water status in the root zone of the tree remains within the ideal range for root extraction, thus ensuring maximum soil water uptake. Soil measurements are taken using instruments placed at various depths in the root zone, such as tensiometers, electrical resistance blocks, neutron probes, and time and frequency domain reflectometry probes. Major issues with soil water measurements are that they may not indicate actual conditions at the soil-root interface and may only indirectly reflect tree water status.
Plant-based irrigation scheduling became more feasible in the early 1960s with the development of pressure chambers that allowed leaf water potential to be measured. This involves placing an excised leaf in a metal vessel with the cut end of the petiole protruding through an air-tight seal. Compressed gas is injected into the vessel until xylem fluid appears at the end of the petiole. The gas pressure at this point is considered to be equivalent to the absolute value of the xylem pressure potential, which is nearly equivalent to leaf water potential. If irrigation is not adequate to meet the potential water use of the tree, the leaf water potential becomes more negative. Another tree water status indicator is stem water potential (SWP), which is measured by placing a foil-covered plastic bag over the leaf a few hours prior to taking the pressure chamber measurement.
Another plant-based approach to irrigation scheduling involves assessing the small changes in trunk diameter that occur over the day. Trunk-mounted linear variable displacement transducers (LVDTs) can measure trunk or scaffold diameter precisely (to the micron level), and various indicator parameters, such as maximum daily trunk shrinkage and daily trunk growth, can be gleaned from the data. These parameters can indicate the adequacy of irrigation.

Leaf conductance is measured by Mario Salinas and Alfonso Moriana.
The atmospheric-based technique of irrigation scheduling uses weather data and meteorological models to calculate a reference crop water use (ETo) value. That approach, also known as the water budget, is facilitated by the California Irrigation Management and Information System (CIMIS), a network of automated weather stations operated by the California Department of Water Resources. Crop water use — that is, evapotranspiration (Etc) — is estimated by multiplying ETo by crop coefficients (Kcs) that are tree-species specific. This technique is the only approach that supplies actual tree water use (gallons/tree/day) data, making it relatively easy, especially for growers with drip or microsprinkler irrigation, which have known application rates, to apply water to match the ETc throughout the season.
Four scheduling techniques
We conducted an experiment in 1999 on second-year peach trees (‘September Snow’) to evaluate what we considered to be optimized, state-of-the-art soil, plant and atmospheric-based irrigation scheduling techniques. This work took place at the Edison International AgTAC facility in Tulare County, where the soil is a sandy loam. To maximize the number of trees in our relatively small area, tree spacing was 12 × 6 feet, with a perpendicular V training system.
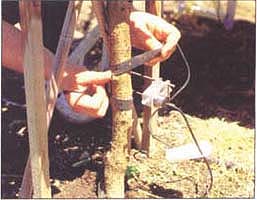
Attachment strap on mounting bracket of linear variable displacement transducer (LVDT) is affixed to the tree trunk.
Linear variable displacement transducer used to measure trunk diameter fluctuations. Aluminum foil protects sensor from sun and wind.
We evaluated one soil-based, two plant-based and one atmospheric-based irrigation scheduling techniques. We also maintained an irrigation treatment that applied water in excess of estimated ETc, ensuring that we had some trees that were fully irrigated and could provide baseline values of tree water status. Irrigation rates in this treatment, hereafter referred to as FULL, were 30% greater than the atmospheric-based treatment from late May through mid-July. At that time, symptoms of anoxia appeared in the trees and FULL rates were lowered to those in the atmospheric-based regime.
The five irrigation regimes were each replicated four times. Each replicate plot was three rows × five trees, and the interior three trees were monitored. Drip irrigation was applied daily, with two 1 gal/hr emitters per tree. Irrigation amounts were measured with water meters. Normal grower fertilization (through the irrigation system) and weed, disease and insect control were used.
The trees were thinned to 17 fruit per tree in March. During the season, calipers were used to measure fruit diameter on four tagged fruit on each of three trees per replicate. The fruit was harvested on Aug. 29, which also signaled the end of the differential irrigation treatments. All fruit was sized on a commercial sorter to assess industry size categories (fruit per box). In addition, diameters were measured with calipers. Fresh and dry fruit weights of six randomly collected fruit per replicate were determined.
Techniques evaluated
All trees were irrigated with the atmospheric-based approach through late April, when the following treatments were initiated.
Soil based.
The soil-based treatment, hereafter referred to as SOIL, employed EnviroScan probes (Sentek, Ltd.), which use frequency domain reflectometry to assess soil water status. Single probes were installed on one tree in each replicate of the SOIL treatment. Single probes were also installed in one replicate of each of the other four irrigation regimes. Each probe allows the actual sensors to be set at specific depths. In this study, sensors were set at 6, 12, 24 and 36 inches. This device provides frequent measurements (every 15 minutes) that indicate both trends in soil water status and total amounts in the monitored profile. Our management protocol was based primarily on maintaining 17 to 18 acre-inches of total soil water in the monitored depth (42 inches). This value was chosen based on soil water levels achieved at the end of the previous season, after rainfall and irrigation refilled the profile. We also adjusted irrigation in this treatment based on the rate of change in total soil water. If actual soil water was below or above the desired level, irrigation amounts for the following week were increased or decreased by 5% or 10%.
Plant based.
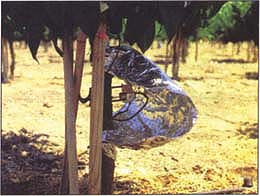
For the STEM treatment, stem water potential was measured weekly with a pressure chamber (Model 3005 Soil Moisture Equipment Co., Santa Barbara) on single leaves on each of three trees per replicate. Plastic foil-covered bags were placed on interior shaded leaves at about 10 a.m. and the measurements were taken between noon and 2 P.M.
Interpretation of SWP values for irrigation scheduling is complicated by the fact that SWP is influenced by weather conditions. Therefore SWP may decrease with time over the season regardless of the adequacy of irrigation simply because of increasing evaporative demand. There may also be tree-species-related differences in SWP for the same weather conditions. Although recent research by Ken Shackel has provided SWP guidelines for fully irrigated prune trees that are based on relative humidity and air temperature, we choose to interpret our SWP values in relation to the satisfied treatment. If mean weekly SWP in that treatment was more negative than the SWP in the well-watered treatment, then the following week's irrigation rate for the SWP treatment was increased by 5% or 10%. Conversely, if the SWP of that treatment and the well-watered treatment were nearly equal, then the following week's irrigation rate of the SWP treatment was lowered by 5% or 10%.
In the scheduling regime based on trunk diameter fluctuations (hereafter referred to as the LVDT treatment), sensors were placed 18 inches above the soil on each of three trees per replicate. Single trees in each replicate of the other scheduling approaches were also instrumented with LVDTs. Trunk diameter was recorded every 12 minutes.
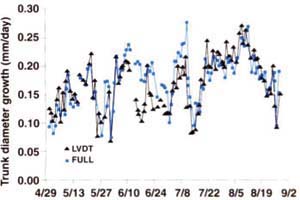
Previous work has demonstrated that although maximum daily trunk shrinkage (MDS) is a sensitive indicator of tree water status for mature trees, it is much less useful for young trees. On the other hand, daily trunk growth (TDG) appears to be a good water stress indicator for young trees. We managed the irrigation in the LVDT treatment by comparing TDG in that treatment with TDG in the FULL regime. Because we cut back irrigation rates in the FULL treatment in mid-July and were concerned that the TDG, being very sensitive to even mild water deficits that might develop in the FULL trees, would fall below potential values, we increased the measured TDG values in the FULL treatment by 15% from mid-July through harvest. Otherwise, management logistics were the same as described for the STEM treatment.
Atmospheric based.
Data from the Visalia CIMIS weather station provided weekly ETo values. The Kc values were taken from recent research on young peach trees by Scott Johnson at the Kearney Agricultural Center. The resulting mean estimated ETc for a given week was used to set the irrigation rate of this treatment (hereafter referred to as ATM) for the following week.
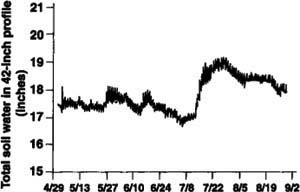

Fig. 3. Stem water potential in the STEM and FULL treatments through harvest. Vertical bars are two standard errors of the mean.
Seasonal irrigation differences
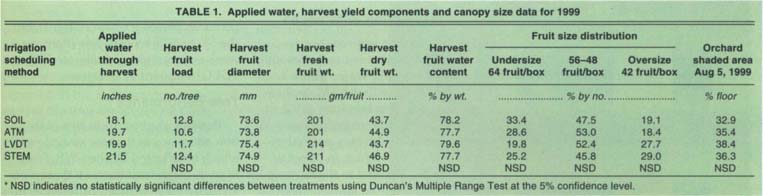
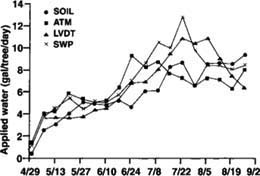
The scheduling approaches resulted in different rates and seasonal amounts of applied water (table 1, fig. 1). It is notable that ATM application rates peaked in late June at 9.2 gal/tree/day, while irrigation rates with the other approaches peaked in late July or early August. In terms of total irrigation applied to the harvest, SOIL applied the least (18.1 inches) and STEM the most (21.5 inches).
Protocol guidelines followed
The success of any irrigation scheduling approach depends not only on good instrument technology and valid scientific development of the data interpretation protocol, but also on whether the water management matches the protocol; that is, on how skillfully the manager adjusts irrigation based on the observed data. Figures 2, 3 and 4 illustrate this for the SOIL, STEM and LVDT techniques, respectively.
Total soil water remained relatively unchanged at 17 to 18 inches through mid-June, followed by a gradual decline to slightly below 17 inches in early July (fig. 2). This triggered an increase in irrigation rates in early to mid-July (fig. 1). The increased irrigation rates resulted in a rapid increase in total soil water that reached about 19 inches in late July. This suggests that we did not do the best job of managing water in this treatment, and that daily evaluation of total soil water would have been preferable to our weekly evaluation.
SWP measured was the same in both the STEM treatment and the FULL regime except from mid-June to early July, when STEM SWP was more negative (fig. 3). This occurred even though we rapidly increased irrigation rates during this period (fig. 1). This illustrates the difficulty of translating a plant-based measurement into a water-management decision. In retrospect, we should have changed irrigation rates in increments greater than 5% to 10% weekly. The same can be said for the water management in the LVDT treatment; relatively low TDG in both mid-June and early July (fig. 4) triggered increased irrigation (fig. 1), but the 5% to 10% weekly rate increases were not enough to accelerate TDG to FULL treatment TDG rates.
Tree performance
Perhaps the best indicator of irrigation adequacy is the tree stress level, which is reflected by the SWP. From May through fruit harvest, there were virtually no significant differences in SWP for the different irrigation scheduling approaches, except for mid-July, when STEM levels were less negative than the other treatments. Not surprisingly, irrigation rates in STEM were higher than in the other regimes during this period (fig. 1).
There were no significant differences between scheduling approaches in harvest fruit load, fruit size, fresh and dry fruit weights, fruit hydration, fruit size distribution and tree growth (table 1). The fact that there was little difference in seasonal SWP, harvested fruit size and tree growth between treatments should not be surprising; all of the scheduling approaches are based on sound agronomic principles, and all are designed to avoid significant tree stress and to achieve maximum vegetative and reproduction growth.
Measurement variability
The water budget (ATM) approach is the only one that uses singular estimates (ETo and Kc) to develop management parameters; in this case, ETc. Therefore, even though there is uncertainty in the ETc estimate due to inaccuracies in the algorithm used to calculate ETo and variability in the Kc value that existed in the experimental data used for its development, this uncertainty is not reflected in the water budget scheduling procedure. On the other hand, there is variability in the soil-based and plant-based measurements. This variability depends partly on the number of instruments used per monitored area, but it is also related to the measurement itself.
Measurement variability can be expressed as the coefficient of variation (CV), which is the standard deviation divided by the mean. For a valid comparison of the CV for the different scheduling approaches, the same number of measurements must be considered for each approach. This situation occurred in the SOIL treatment, where each of the four replicates had one EnviroScan probe, LVDT and SWP value taken from the same tree. Although total soil water and SWP CVs were generally in the 4% to 8% range, the CV with TDG was much greater, reaching 45% in mid-July. We previously observed this high “noise” level in LVDT-derived measurements from mature trees. In that case, the noise decreased as tree stress increased. Additionally, the strength of the “signal” (relative change in the indicator value as stress increased) for the LVDT-derived parameter was much greater than the SWP signal. Therefore the signal/noise ratios of both plant-based approaches (SWP and LVDT derived) were similar under mild to moderate stress conditions.
Which approach is best?
The ideal irrigation scheduling approach would have the following characteristics: measurements would be accurate, reproducible, and easy to take and interpret; be electronic with easily automated and continuous data collection; have visual readouts; and could be directly coupled to an irrigation controller that contained software to automatically manage irrigation. Additionally, the monitoring instruments would be inexpensive to buy, operate and maintain. Finally, their use would result in maximum grower profit with minimum water use. Clearly, no single scheduling approach currently possesses all of these characteristics.
We believe that the future is bright for plant-based sensors because of their ability to reflect small changes in water status, changes that would probably have no negative effect on crop production. Because they take continuous measurements, management protocols can be developed that make these stand-alone scheduling tools. For example, daily irrigation could be incrementally reduced until the indicated tree stress exceeds a mild threshold level. This would trigger an incremental increase in the daily irrigation rate until a well-watered threshold is achieved and the entire cycle is repeated.
As advances continue to be made in electronics and data acquisition, and as research progresses on developing protocols for using soil-based and plant-based measurements for irrigation decision making, it is likely that the cost and utility of the continuously recorded measurements will become more attractive. Nevertheless, we currently recommend that growers use the water budget (ATM) to provide a first approximation, a starting point for irrigation management, and then use a soil-based or plant-based approach to fine tune decision making.

Stem water potential is measured by, from left, Miquel Marquez, Alfonso Moriana and Jesus Salinas.
Peach trees perform similarly despite different irrigation scheduling methods

