


All Issues
Analysis shows climate-caused decreases in Scott River fall flows
Publication Information
California Agriculture 54(6):46-49. https://doi.org/10.3733/ca.v054n06p46
Published November 01, 2000
PDF | Citation | Permissions
Abstract
Because of declining anadromous fisheries, resource managers are concerned about the timing and quantity of water flows in Northern California's Scott River. We analyzed 48 years of flow and precipitation data to improve our collective understanding of the Scott River fall flow regime and to provide information for current and future fisheries-restoration efforts. Fall flows are primarily controlled by the water content of snow and precipitation during the previous 12 months. These two factors account for nearly 80% of the variation in fall flows. Our analysis shows that downward trends in fall flows appear to be explained by a decrease in the water content of the snow falling on the Scott River watershed. This information will be useful in assessing the relative benefits of conservation and restoration strategies against the larger background of climate-caused changes in river flow.
Full text
An important function of watersheds in many parts of California and the Pacific Northwest is to provide water for anadromous fisheries. Populations of anadromous fish such as Chinook salmon and steelhead have declined in many streams, in some cases reaching levels resulting in their designation as threatened or endangered species.
The Scott River watershed, in Siskiyou County, is a watershed that supports anadromous fish. The volume and timing of water coursing through the Scott River is critical for matching water availability with seasonal fish requirements such as spawning, development of fry and in-or out-migration. Fall flows affect access to spawning sites. Many speculate that there has been a reduction in fall flows over the last several decades. Declining fall flows have been attributed to a variety of factors, including increased irrigated agriculture, logging and global warming, as well as climate.
Suggestions and theories on perceived lower fall flows have led to planning efforts and on-the-ground projects to increase fall flows. Since 1942, a U.S. Geological Survey (USGS) gage station has collected flow data that permits evaluation of water volume and flow. To better understand the fall flow of the Scott River and to provide information for improved fisheries management, we analyzed this 48-year data set for trends in fall flow and for precipitation/flow relationships.
Water history, 1951-1998
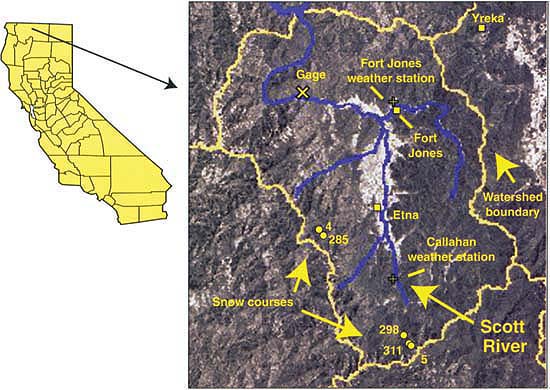
The data used in this analysis spanned the years 1951 through 1998 (n = 48). Daily stream flow and precipitation data, as well as snow water-content surveys from this period, were aggregated into a monthly data set. We used the average daily flow rate at USGS gage station 11519500, located on the Scott River (fig. 1) near the town of Fort Jones, to calculate daily discharge (USGS 1999). Daily flow rate (cubic feet per second) was converted to daily discharge (cubic feet) by multiplication by the time factor (60 seconds times 60 minutes times 24 hours, and converted to acre-feet). Daily data were aggregated into monthly totals. Precipitation data from two locations (Fort Jones, U.S. Forest Service Station, and Callahan, National Weather Service) in the watershed are also available (DWR 1999a). These locations are on the watershed's valley floor, and their relative contribution is 14% of the total watershed precipitation (California Rivers Assessment 1997). We obtained snow data (depth and water content measured as inches of water) from five snow courses.
The sampling process consisted of monthly samples obtained near the beginning of the month from the same points. Depth is measured by driving a snow sampling tube with a cutter end through the snow. By weighing the snow core, the water content (water equivalent) was determined (DWR 1999b). Three courses (course numbers 5, 298 and 311) are in close proximity and located in the southern portion of the watershed. These courses were sampled monthly from February through May. Two courses (4 and 285) are located together in the western portion of the watershed. Course 4 was sampled only in April. Course 285 was sampled in April until 1961, when February through May sampling was conducted. To provide a consistent data set, we used snow measurements in April and May.
Trends in fall flows
Lowest average monthly flows generally occurred in September, but occurred 10 times in August and three times in October. Fall flows have tended to decline over time (fig. 2). Within the study period, single-year and multiple-year periods have shown episodic periods of increase and decrease, as shown graphically with distance-weighted least squares curves that can be observed on the graph (fig. 2). These observations support the belief that fall flows are trending lower than historical values, but display large variations over that trend. The large variation and episodic short-term swings tend to mask and complicate evaluation of discharges. Understanding why discharges are trending lower could greatly assist management efforts to increase fall flows.
Since the Scott River is generally regarded as a snow-fed stream, we evaluated fall flows in terms of snow water content and precipitation. Stepwise regression was used to select only significant variables describing September flows. We evaluated the following precipitation-associated variables: monthly total precipitation in April, May, June, July, August or September; total precipitation during the previous 12 months; and total precipitation during the previous 12-to-24-month period. These variables were selected to represent both short-term and long-term effects of precipitation on the watershed and discharge. Variables associated with snow water content were restricted to April or May data to include snow courses 4 and 285 from the western portion of the watershed, which had more limited sampling than the other courses. Inclusion of courses 4 and 285 increased watershed coverage for snow water-content data.
Because of the large variation in September flows, those flows were transformed by taking the square root. Nearly 80% of the variation in September flows could be explained by the following relationship: total September acre feet = (2.5 + 1.18* sum of previous 12 months precipitation + 8.6* precipitation in August - 6.7* precipitation in July + .48* April water content at course 285 + .25* April water content at course 5)2 (P = .0001, R2 = .78).
Actual and estimated values for September flows are very similar for the entire range of flow volumes (fig. 3). Errors are small and equally distributed.
August flows, which were lower than September flows in 10 out of 48 years, were similarly (R2 = .75) described by water content in April at course 285 and total precipitation during the previous 12 months. Rainfall during July was not a statistically significant contribution to flows in August.
Snowfall has declined
The water content of snow in April has trended lower at snow courses 4 and 285, but not at 298 and 5 (fig. 4). When a curvilinear line is fitted to the snowfall measurements at each course, a decline in water content of snowfall is apparent for courses 4 and 285. These courses are located in the western portion of the watershed, while the snow courses not showing a water-content decline are located in the southern portion of the watershed.
Snow courses 4 and 285 on the west side of the watershed are correlated to each other, as are 5 and 298 to each other on the southern portion of the watershed (correlations greater than .80). As expected, the correlations between courses 4 or 285 to 5 or 298 are not as strong (correlations less than .75). This is expected because those with higher correlation are in closer proximity. However, it is noteworthy that the snow courses that have trended lower over time (4 and 285) are better descriptors of fall flows than snow courses not showing a decline over time. Snow courses 5 or 298, while somewhat correlated to courses 4 and 285 (r = .68 to .75), cannot fully replace snow course 4 or 285 as descriptors of fall flows (variables are significant, but R2 decreases and SE increases). This tends to confirm the relationship between declining water content of the snow and declining fall flows.
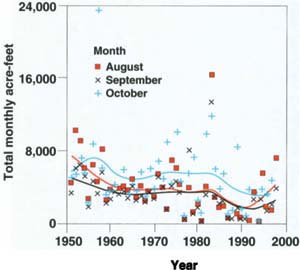
Fig. 2. Total monthly flows, in acre-feet, show a downward linear trend over time for August (P = 0.01), September (P = 0.03) and October (P = 0.12). Data points and curved lines (by distance-weighted least squares smoothing) show individual year and short-term (multiple-year) increases and decreases overlaying the longer-term downward trend.

Fig. 3. Actual and estimated total September flow, acre-feet, from 1951 through 1998 (n = 48). Estimated by total September acre-feet = (2.5 + 1.18* sum of previous 12 months precipitation + 8.6* precipitation in August - 6.7* precipitation in July + .48* April water content at course 285 + .25* April water content at course 5)2 (P = .0001, R2 = .78)
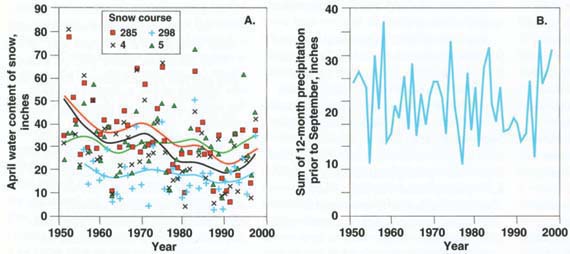
Fig. 4A. April water content, in inches, for four snow courses from 1951 through 1998. Snow courses 4 and 285 display downward trends, while 5 and 298 tend to remain constant. All courses reflect varying water content from year to year. Fig. 4B. Precipitation from the 12 months before September has varied greatly, but does not show a linear trend (P = .84).
Managing for low fall flows
Fall flows are extremely variable but have trended lower over time. September is usually the lowest month of flows and, except for 4 years since 1951, October flows have been higher than September flows. Nearly 80% of the variation in September flows is described by the water content in spring snow pack, July rainfall, August rainfall and total rainfall for the previous 12 months. It is likely that additional factors influence fall flows. Such factors might include whether precipitation was snow or rain, or if April or May rains were substantial enough to rapidly melt snow, resulting in an earlier runoff and thus reduced flows in September. However, these additional factors have little remaining variation to describe, and the data are not readily available. From our analysis, fall flows have trended lower because of a downward trend in water content of snow.
Artificial storage of winter precipitation offers potential for later release to increase September flows. Impounded water could be released later into the summer, effectively mimicking increased water content in the snow. Effects of storage structures on the fisheries would require evaluation. Spawning sites could be reduced if storage structures were to impede fish access to upstream sites. An alternative might be storage on historically inaccessible or marginally accessible tributaries. In years when total precipitation is low, and presumably groundwater is also low, release of stored water might conceivably be less effective in increasing September flows. Water storage efforts would need to recognize potential for thermal pollution of impounded water. Water might be stored at higher elevations to minimize heating, which could result in deleterious temperature effects on fisheries.
Decreasing or eliminating agricultural diversions from the Scott River in September might result in higher flows in September. It is important to recognize that monthly discharge historically increases substantially in October (6,432 ± 8,520 acre-feet), on average nearly doubling September's average (3,263 ± 2,276 acre-feet). Even for the 7 years with dramatically lower September flows, their flow in November (16,440 ± 22,845 acre-feet) is nearly equal to the average (20,420 ± 21,615 acre-feet).
Reducing diversion would primarily affect September flows. In September, crop water needs are declining and irrigation is already decreasing. Many irrigators apply only a single irrigation in September. Thus opportunities for substantial reductions appear limited. However, further efforts to match irrigation to changing climate and crop needs might result in less water being diverted, and potentially increase September flows. Optimism about the ability to influence September flows through irrigation management practices should be tempered by the knowledge that the magnitude of September flows will largely be determined by previous annual precipitation and by the water content of snow.
A reduction of water flow in autumn may affect access for Chinook salmon, steelhead and other anadromous fish to spawning sites in the Scott River.
It would also be helpful to better understand the flexibility of the fishery to respond to cyclic climate conditions. Since October and especially November flows for even the lowest years are similar to average years, what are the consequences of short, episodic low flows on the fisheries? The variations in August, September and October flows as described above, and shown in figure 2, illustrate the tremendous historical flow variations encountered by the fisheries. Even during the downward trend in fall flows experienced over the last 50 years, periods of normal and above-normal fall flows have occurred. Do the fisheries have the genetic potential developed over centuries of cyclic climate conditions to sustain populations during these cyclic dry periods? Since November flows in even the driest years are similar to average years, do fish have the ability to delay their migration upstream in years with low fall flows until flows are adequate? Perhaps management such as in-stream harvest should be delayed or reduced in periods of low fall flows to avoid excess harvesting of fish that are unable to disperse upstream.
Analysis shows climate-caused decreases in Scott River fall flows

