


All Issues
Avocado and citrus orchards along the coast may use less water
Publication Information
California Agriculture 54(3):25-29. https://doi.org/10.3733/ca.v054n03p25
Published May 01, 2000
PDF | Citation | Permissions
Abstract
Most citrus and avocado water-use studies have been conducted in inland orchards; however, orchards located in coastal areas are subject to cooler temperatures and foggier atmospheric conditions. To develop coastal area crop coefficients (Kc values) for irrigation management, we measured orchard consumptive water use (ETc) from two different commercial orchards located near Ventura. In addition to coastal climate variability, the ETc measurements were complicated by the wide variability in field soil, slope and elevation. On average, we measured Kc values of 0.46 for young lemons, 0.52 for mature lemons and 0.64 for mature avocados. These values were slightly less than those published, perhaps as a result of greater fog conditions in the orchards as compared to those occurring at the nearest reference ET stations.
Full text
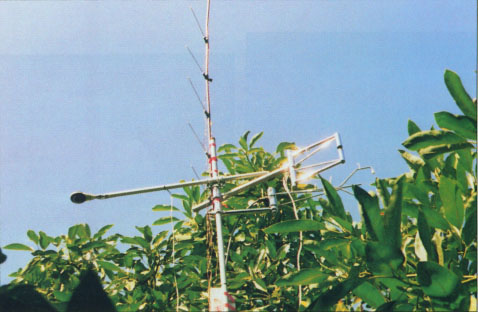
Energy balance measurements over an avocado orchard near Camarillo to estimate evapotranspiration.
Urbanization of Southern California coastal regions continues to press the remaining agricultural sector to use water more efficiently in orchard production. Orchards and other permanent crops are of particular concern because they require water year-round and cannot be economically “fallowed” during drought years, when municipal water demands may reduce agricultural water allocations. Although citrus groves once covered the southern valleys of the state, the remaining citrus and avocado groves are now largely found in the inland valleys east of Riverside, Orange and San Diego counties and along the coast from Ventura to San Luis Obispo. The growing conditions of these two areas differ because reference evapotranspiration (ETo) of the inland valleys is greater and more variable due to increased temperatures and reduced fog conditions as compared to the coastal areas.
In general, there is limited water-use data available for citrus and avo-cado orchards. Some of the original research related to citrus water use in California dates back to the 1950s (for example, Richards et al. 1958) and was updated in the 1970s (for example, Marsh et al. 1974), but it was all developed at the Riverside Citrus Experiment Station rather than in a coastal region. Development of irrigation guidelines for water use both in the inland valley and in coastal settings has been hampered in part by lack of crop evapotranspiration (ETc) measurements from commercial orchards. Cooperative Extension advisors have relied on limited published data combined with local grower experience to develop such guidelines. Generally, published crop coefficient (Kc = ETc/ETo) values for mature citrus and avocado groves range from 0.50 to 0.75, depending on the soil and atmospheric conditions of the orchard. Often these Kc values were developed in the warmer, more arid regions of Israel and Spain rather than in the cool coastal areas.

Above and right, energy balance measurements over lemon trees near Camarillo estimate evapotranspiration.
To develop coastal area Kc values, we have attempted to measure ETc from two commercial citrus and avocado orchards located near Ventura over the past 3 years. Measurements of citrus and avocado ETc have been complicated by the wide range of orchard conditions found in this region, including large variability in field soils, slope and elevation as well as in climate. This variability influences measurements of ETc that are based on energy balance (for example, Bowen ratio) or eddy covariance, which are affected by the fetch distances, slope and aspect in the field. Orchards planted on steeply sloping fields often have limited required fetch distances, and micrometeorological measurements of ETc are difficult to obtain. The fetch is the distance of the continuous orchard, in this case in the dominant wind direction. However, because there is a paucity of information about ETc relative to available reference ETo data, we undertook these measurements to develop Kc values for growers to use for irrigation scheduling in the south coast area.
In this paper, we discuss the results of citrus and avocado orchard ETc measurements from a relatively flat, low-elevation orchard near Point Mugu and from a steeply sloping orchard located at elevations ranging from 400 to 1,700 feet above mean sea-level (MSL) adjacent to La Conchita (between Ventura and Santa Barbara). Then we use ETo from reference stations to estimate Kc values for this coastal region.
Previous research
Most studies on water use by citrus and avocado orchards have focused on determining the level of water application necessary to obtain satisfactory fruit set, size and yield rather than directly determining the actual water need of the trees. As drip and microsprinkler irrigation technology became available, some research was directed at developing appropriate irrigation schedules for these systems. Several studies considered systems delivering water on daily or alternateday schedules (Olalla et al. 1992), while others investigated 1-to-4-week-interval irrigation schedules (Lahav and Kalmar 1977). The Cooperative Extension Drip Irrigation Guide for Ventura County circumvents the irrigation scheduling issue through development of recommendations based on seasonally dependent, daily water allocations per tree.
Soil salinity impacts on orchard production have also been considered (Lahav et al. 1992). In general, it has been found that when soils have adequate water-holding capacity, daily drip or microsprinkler irrigation is not required and 12-to-24-hour irrigation sets 1 to 3 times per week, depending on the prevailing ETo and soil moisture conditions, result in satisfactory yield. In terms of irrigation scheduling relative to ETo, after investigating the use of Kc values ranging from 0.44 to 0.66 for avocados, Olalla et al. (1992) suggested that the use of values less than 0.55 was ill advised for the stony soils of southern Spain due to decreased fruit production and adverse salinity conditions. Avocado cultivars grown on Mexican rootstocks were less salt-tolerant than those grown on West Indian rootstocks. In terms of losses in yield, however, this occurred only at soil salinity in excess of several hundred ppm. Handbook Kc values range from 0.50 to 0.80 for citrus, depending on canopy coverage, and similar values for avocados are assumed (Hydrology Handbook 1996). Despite the economic value of these crops, surprisingly little information is available about their actual water use.
Experimental site descriptions
We conducted field studies at La Conchita Ranch in northwestern Ventura County and at Thornhill Ranch near Pt. Mugu, east of Oxnard. La Conchita Ranch lies on the southerly facing slope of Rincon peak (above the village of La Conchita) and on the southwestern flank of the Red Mountain anticline of the central portion of the Santa Ynez Mountains. The ranch avocado and citrus plantings cover approximately 415 acres of contour-terraced Santa Lucia shaly, silty-clay loam soils on slopes of 15% to 25% and at elevations ranging from approximately 400 feet to 1,700 feet above mean sea level. The orchard is roughly wedge shaped, with the tip of the wedge at the 1,700-feet elevation, and over 75% of the orchard is located at elevations between 400 and 1,200 feet. The orchard was originally planted in 1975 to over 85% ‘Hass’ avocados (the remaining 15% included ‘Whitsell,’ ‘Gwen,’ ‘Zutano’ and ‘Bacon’ varieties) on Mexican rootstock, with some replacement plantings of ‘Allen Eureka’ lemons on ‘Macrophylla’ rootstock (initially and then on ‘Schaub Rough’ rootstock) occurring during the next decade. The trees were planted at a density of 100 to 110 trees per acre. During the period of study (1996 through 1998) the orchard was composed of 59% mature avocados, 30% mature lemons and 11% new (2 to 4 years old) lemons.
The Thornhill Ranch is located on level and hilly terrain formed from sedimentary alluvium approximately 10 miles from Port Hueneme, near Pt. Mugu. The ranch consists of avocado and citrus plantings that range in age from 2 to 20 years. ‘Hass’ avocados on Mexican and clonal rootstocks were planted at a density of 109 trees per acre on 150 acres, with 60 acres dating from 1981 through 1987, 40 acres from the period 1989 through 1992 and the remaining acreage planted since 1994. ‘Eureka’ lemons on ‘Macrophylla’ and ‘C-35’ rootstocks were planted at a density of 140 trees per acre on 140 acres, with 120 acres of the orchard considered mature.
Both ranches employed drip and microsprinkler irrigation systems. At La Conchita Ranch, irrigation scheduling was accomplished through manual soil-moisture monitoring across the different orchard sections, using a small hand-held soil probe to examine soil to depths of 2 to 3 feet (0.6 to 0.9 m). As the trees matured, additional 1 gph emitters were added to the system until there were four emitters per tree. When the ETc rate was sufficiently high, the emitters were replaced by 7 gph microsprinklers. After normal winter rains, the irrigation season at La Conchita Ranch begins in April. A typical schedule is to run 12-to-24-hour sets once every 1 to 3 weeks, depending on available soil moisture. At Thornhill Ranch, irrigation was scheduled using tensiometers. In general, with the 15 gph emitters, the lemon trees received about 8 to 10 hours of water every 10 days. The avocados, with their shallower root system, were irrigated every 7 days. During the spring and fall, set times and frequencies often changed, corresponding to changing ETc conditions.
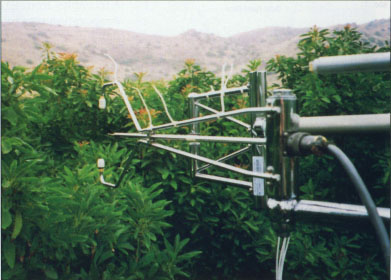
Eddy covariance measurements over avocados near Camarillo.
Evapotranspiration measurements
We made detailed evapotranspiration (ETc) measurements during the intensive irrigation periods of July through October in 1996 through 1998. These detailed ETc measurements complemented long-term water balance and soil moisture monitoring analyses conducted at La Conchita Ranch (Grismer 2000). Daily ETo was obtained from established reference stations (a California Irrigation Management Information System [CIMIS] station at Point Hueneme for Thornhill Ranch and a CIMIS-equivalent [PEEK] station at Rincon for La Conchita Ranch), as well as from National Weather Service Class “A” evaporation pans set up onsite. At La Conchita Ranch, the three evaporation pans were placed on pallets in clearings adjacent to the orchards at elevations of 450, 1,100 and 1,700 ft to evaluate the effects of elevation and relative distance from the coast on pan evaporation (Ep) rates and for comparison with Rincon ETo. A pan coefficient of Kp = 0.76 was used to estimate pan ETo values from ETo = Ep x Kp. Pan evaporation was measured at 1-to-3-day intervals during August through October, with the greatest attention to August measurements. During September through October there were problems with bears disrupting the upper elevation pans, and data from this period was more scattered. Evaporation pans were similarly situated in clearings at Thornhill Ranch, but were used to confirm the CIMIS data for the ranch. In both cases, the ETo data allows for comparison of the different ET measurements and determination of crop coefficients from Kc = ETc / ETo.

Fig. 1 Bowen ratio tower energy flux density at La Conchita Ranch for mature lemons, Aug. 3 and 4, 1998.

Fig. 2 Cumulative ETo from La Conchita Ranch evaporation pans and from Rincon stations ETo during August 1996.

Fig. 3 Cumulative ETo from La Conchita Ranch evaporation pans and from Rincon stations ETo during September 1996.
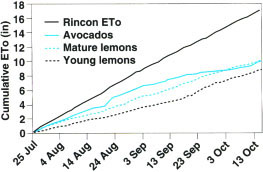
Fig. 4 Cumulative ETo measurements in different orchards at La Conchita Ranch as compared to Rincon ETo.
The Bowen ratio method is often used to estimate ETc from crops. It combines aerodynamic and energy balance methods to estimate ETc. Bowen ratio ETc towers were installed at Thornhill Ranch in 1996 and at La Conchita Ranch in 1998. At La Conchita Ranch, three ETc towers were erected in each of the central avocado orchards and in the young and mature lemon orchards at elevations ranging from approximately 700 ft (young lemons) to 1,150 feet (mature lemons) in August 1998. The towers consisted of a net radiometer to measure net radiation (Rn), three horizontally distributed soil heat flux plates buried at about 0.4 inches (0.01 m) to measure soil heat flux density (G), and two arms with wet- and dry-bulb temperature sensors to determine temperature and water vapor pressure. The Bowen ratio (the ratio of sensible heat flux to latent heat flux density, ß = H/LE) was calculated from the temperature and water vapor measurements from the two arms by assuming equal transfer coefficients for sensible and latent heat flux (Angus and Watts 1984). The lower of the two arms was about 1 feet (0.3 m) above the orchard canopy, and the upper arm was 6.2 feet (2 m) higher than the other arm. The upper arm heights above the tree canopy ranged from approximately 15 feet (4.6 m) in the young lemons to 25 feet (7.62 m) in the mature avocados. Using a datalogger attached to each tower, we collected data at 15-minute intervals. We downloaded the datalogger at 10-to-14-day intervals and processed the data to determine 15-minute interval latent heat flux density (W/m2) using the equation LE = Rn - G/1 + ß.
We converted these values to ETc by dividing the right side by the latent heat of vaporization (L) and summing over 24 hours to obtain daily ETc. During the early morning and late evening hours when the value of ß ≈ -1.0 and LE from Equation 1 is undefined and such values, as well as excessively large ß values, were filtered out of the daily ETc calculations. Although it is not possible to determine ETc when this occurs, actual ETc rates during these periods are quite small, and the overall error in determining daily ETc rates is also negligible.
As with all atmospheric-based ET measurements, adequate fetch, or upwind “footprint” distance, from the measurement locations having the same ETc conditions is required. The towers were positioned in each grove so that the maximum available fetch conditions, on the order of several hundred yards, were obtained.
Daily ETc patterns
In general, the quarter-hour variation of the energy parameters affecting ETc in the field was similar in the orchards on any given day (see fig. 1 for mature lemons), with the exception of some variation in H values from day to day depending on fog conditions in the orchards. The 15-minute interval data gives an impression of the calculation variability associated with the Bowen ratio method (fig. 1). During the day, the values are typically positive except under advective conditions, when H can become negative. During the night, Rn is negative due to a net loss of long-wave radiation from the surface. G and H are also negative because of the upward flux of soil heat and downward flux of sensible heat needed to replace heat loss due to radiation from the surface. The energy required for evapotranspiration, LE, is the difference between the energy input (Rn) and G + H. It is positive when evaporation is occurring and negative when dew is forming. On the morning of Aug. 4, LE was only a small fraction of the total energy flux (Rn - G + H), due to the foggy conditions that dissipated later in the day (fig. 1)
A similar daily pattern of the energy parameters was observed in the avocado groves, with the exception that G was near zero due to the complete canopy coverage by the trees and accumulation of avocado leaves on the ground that insulated the soil. Despite the different locations and elevations of the towers, the maximum net radiation measured at each tower was approximately the same.
We graphed the cumulative ETo values for the evaporation pans at La Conchita Ranch and for Rincon for August and September 1996, respectively (figs. 2 and 3). As elevation increases, pan ETo increases as well due to decreasing coastal fog influence. However, this difference in ETo determined from the pans and the Rincon station diminished in September as the number of foggy days decreased (fig. 3). From the limited data obtained, pan ETo estimates and Rincon ETo were nearly the same in October. Generally, Rincon ETo values exceeded those from the weighted average of the pans but were comparable to those from the high elevation (1,700-ft) pan. The Rincon station, although at an elevation comparable to the lower elevation pans, is located farther inland and is shielded from some of the coastal fog effects, so that its ETo values may be slightly high as compared to those occurring at La Conchita Ranch.

According to the Bowen ratio measurements, ETc rates in the avocados declined, while they increased in the young lemons during the early fall (fig. 4).
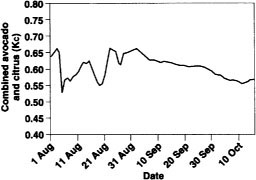
Weighting the Bowen ratio tower ETc data by the total acreage of each type of grove also enabled us to compute average orchard ETc (fig. 5). The ETc measurements from the two ranches yield surprisingly similar results for the month of August, when the average Kc = 0.60. Interestingly, this Kc value is similar to the ratio of the ETo estimated from the evaporation pans to the Rincon ETo data. During September and October, data from the Bowen ratio towers suggests that the Kc decreased to about 0.57. The values Kc - 0.57 to Kc = 0.60 were somewhat greater than those obtained from measurements of decreasing soil moisture during the irrigation seasons, but were similar to water balance estimates of Kc (Grismer 2000). Lemon and avocado yields from both ranches were similar to the county average, suggesting that water was sufficient to obtain adequate yield, yet may not actually satisfy orchard “water needs.” Results of the field measurements, expressed in terms of Kc values, are summarized in table 1.
Coastal conditions affect heat flux
Due to the lack of field measurements of ETc in citrus and avocado orchards of the south coast, we have attempted to obtain such information from two very different commercial orchards. Although net radiation coming into the orchards was similar, the soil heat flux returning to the atmosphere appeared to depend on canopy coverage; these values in the mature avocado groves were nearly zero during all measurement periods. We found that the average Kc values associated with the intensive irrigation period of the late summer range from 0.55 to 0.65. This range of values is slightly lower than those published, and may be a result of coastal conditions suppressing ETc in the orchards as compared to the reference ETo stations in Ventura County.
Avocado and citrus orchards along the coast may use less water

