


All Issues
Modeling vineyard expansion, potential habitat fragmentation
Publication Information
California Agriculture 54(3):12-19. https://doi.org/10.3733/ca.v054n03p12
Published May 01, 2000
PDF | Citation | Permissions
Abstract
We used a statistical modeling technique called logistic regression analysis, and a geographic information system (GIS), to map areas of possible future vineyard expansion in Sonoma County, based on data about vineyard development from 1990 through 1997. The goal of this research was to develop a model that would improve our understanding of vineyard expansion patterns at a landscape scale (for instance, including an entire county). The approach involved identifying landscape characteristics that were associated with vineyard development and mapping the areas with similar characteristics that were undeveloped in 1997. We used the results to map where habitat removal and fragmentation could result from vineyard expansion. This method, although still under development, is designed for county- or regional-scale analysis to assist land-use planners, natural resource protection agencies and land conservation programs in protecting valuable environmental resources while sustaining a vital agricultural economy.
Full text
This is the first time that areas potentially suited to agriculture have been modeled using GIS for an entire county in California. Predictions made by the model are derived from the currently available data, which does not include such information as microclimate and soil profiles for specific sites. Scientists hope to add more information in the future. — Ed.
While recognizing that the wine industry represents a significant portion of California's agricultural economy — $1.3 billion was paid for California wine grapes in 1999 (CASS 2000) — it is also important to preserve the ecological integrity of the natural resources upon which we all depend for services ranging from basic sustenance to aesthetic pleasure. Mapping and analyzing land use at the county scale can facilitate community efforts to balance economic growth and environmental protection. Land-use analysis and models can also aid planners in prioritizing undeveloped and agricultural land for possible protection through conservation easements and other methods.
Recently, vineyard development is expanding into rangelands, woodlands and forestlands (forests that include commercially harvested and regulated species such as Douglas fir), resulting in deforestation. We used results of our model to examine the potential for habitat loss and fragmentation. Model results can also be used to examine the possible effects of new regulations, such as those that restrict future vineyard development on steep slopes ( see sidebar, p. 19 ).
Modeling approach
Our analyses have sought to identify areas that are most susceptible to future vineyard development in Sonoma County. Our primary assumption is that areas that share important characteristics with recently planted land are more likely to be developed into vineyards in the future. The results of our modeling efforts are strongly influenced by the development trends mapped for Sonoma County from June 1990 through June 1997. The model does not specify sites that will necessarily support the successful propagation of wine grapes, since some newer vineyards may have been planted in less productive places. Furthermore, site-specific characteristics, such as microclimate and some soil properties, could not be included.
We used logistic regression analysis (Hosmer and Lemeshow 1989), a statistical modeling technique, to quantify the correlation between geographic factors and recent vineyard development. The combination of logistic regression and a geographic information system (GIS) has been used to model habitat suitability for wildlife species (Carroll et al. 1999; Clark et al. 1999; Massolo and Meriggi 1998). However, it is less commonly used to model land-use change, the notable example being the second generation of Landis and Zhang's (1998a, 1998b) California Urban Futures Model for urban expansion in Bay Area counties.
Logistic regression allowed us to identify which landscape characteristics were associated with sites that recently became vineyard versus those that did not. For a given version of the model, we applied an equation resulting from regression analysis to land that remained available for vineyard expansion and calculated the relative probability that each available site may be suitable for vineyard planting given its characteristics (fig. 1).
Vineyard locations representing 11,663 acres of post-1990 (from 1990 through 1997) vineyard and 36,337 acres of pre-1990 vineyard were incorporated into a GIS. Our statistical analysis of recent vineyard development was based on vineyard sites developed between 1990 and 1997. Explanatory variables were extracted from digital data on topography, vegetation, land use and distances to various features (table 1) ( see sidebar, p. 8 ). Although factors such as soil properties, water availability, zoning and market forces are also important, they were not incorporated because corresponding GIS layers were not yet available.
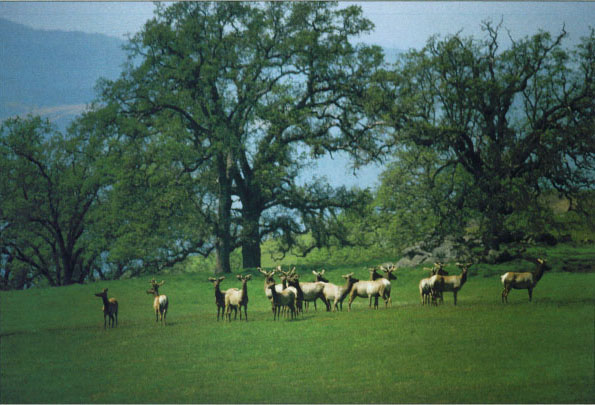
Oak woodlands support a variety of wildlife including tule elk. By modeling vineyard expansion, researchers can show where habitat may become too fragmented to support viable populations of all its original inhabitants in the future.
We divided the county into 2.5-acre cells with a corresponding elevation, vegetation type and so on. The average size of spatially distinct, post-1990 vineyard blocks in Sonoma County was 24 acres, and the majority (400 out of 489) were 2.5 acres or larger. Therefore treating the landscape as 2.5-acre plots reflects the scale at which vineyard development occurs. Due to the limitations of the digital vineyard map, we did not use a smaller cell size.
To gain an accurate understanding of expansion patterns, we identified land that was not available for vineyard development in 1990 and excluded corresponding cells from our model. Land that we considered unavailable for vineyard development included pre-1990 vineyards, 1990 urban areas, state or federally owned land, county and regional parks, water bodies, and land with a slope value greater than 50% or elevation greater than 2,625 feet. After removal of these lands, 537,995 acres were left for model-building. High elevation sites were excluded because these areas are often too cold to grow wine grapes. Planting on steep slopes (greater than 50%) is generally forbidden by new regulations so these areas were also excluded.
To test the ability of our methodology to predict vineyard expansion at the county level, we used two independent data sets, one for model building and one for model testing. Each data set included observations (the 2.5-acre cells) representing post-1990 vineyard sites and available undeveloped areas. To assign individual vineyards to a data set, they were first classified by appellation area and size: large (≥ 250acres), medium (≤ 250 acres and ≥ 25 acres), and small (≤ 25 acres). Half of the vineyards in each appellation-size class were then randomly assigned to each data set.
Multiple versions of the model were constructed using different combinations of variables and observations from the model building set. For a given version of the model, cells in the test data set were classified as either suitable for vineyard or unsuitable. The classification of each cell was then compared to its actual status (vineyard or undeveloped). The percentage of cells that were correctly classified using different versions of our model averaged 73%.

Vineyard development trends.
Between 1990 and 1997, vineyard expansion occurred primarily on gentle, nonforested slopes that were already under cultivation. The probability that a site was a post-1990 vineyard decreased as slope increased. Also, grassland and shrub were more likely to be converted than woodland or forest. Farmland designated as prime, unique or of state or local importance was more closely associated with vineyard development as compared to other land-use designations such as grazing land. Distance to the nearest pre-1990 vineyard was more strongly correlated with vineyard development than was distance to the nearest 1990 urban area. According to these trends, Knights Valley, Dry Creek and Sonoma appellations, and areas neighboring Sebastopol have high potential suitability for vineyard development (fig. 1, also see p. 9 ).
Geographic factors.
In our analysis, the likelihood of a cell being a post-1990 vineyard decreased as slope increased. This result is understandable because the cost and difficulty of establishing and maintaining a vineyard generally increase with increasing slope; development on steeper slopes requires erosion-control measures and in some cases recontouring and terracing.
The tendency to develop non-forested land can be explained primarily by economic considerations and possibly by disease prevention. Clearing trees can be expensive, and remaining tree roots can transmit Armellaria root rot (also known as oak root fungus) to planted vines (Merenlender and Crawford 1998). Also, clearing native vegetation for vineyard development has met with some community resistance ( see p. 4 ).
Distance to the nearest preexisting vineyard may also affect a grower's decision to plant a piece of land. Connoisseurs often seek wines from recognized appellation areas and therefore these wines can fetch a higher price per bottle. Even in regions that are less well known, the presence of healthy grapevines nearby suggests that new vineyards will also do well.
Land value may very well explain why the probability scores in our model decrease as distance to urban area decreases. Sonoma County cities are growing, and the resulting opportunity for urban development can increase real estate values, which makes land near urban areas more expensive for agriculture. On the other hand, agricultural land that is far from transportation corridors may contend with increased transportation costs and is likely to fall outside of well-recognized wine-grape growing regions in Sonoma County, which can affect the price per ton. This trend is partially reflected by the negative correlation between probability score and the distance to the nearest road.
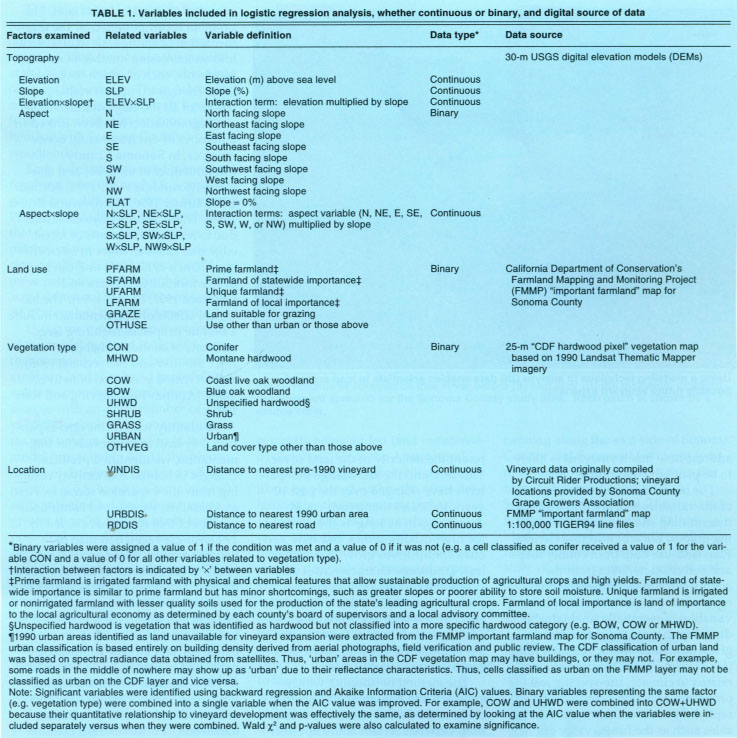
TABLE 1 Variables included in logistic regression analysis, whether continuous or binary, and digital source of data
Modeling limitations
We used data based on information mapped across a large geographic extent, meaning that site-specific details are missing from the information. For example, the elevation data is derived from a 98-foot digital elevation model that would not be able to detect fine-scale topographical changes such as rocky outcrops that can make a site impossible to farm. Our approach is meant to aid in identifying general areas (for example, the Sebastopol vicinity or areas in southern Alexander Valley, see p. 9 ) that have characteristics similar to sites where vineyards have recently been established. It does not allow us to examine a particular acre on a given probability surface and determine with certainty whether that piece of land is suitable for vineyard development. The model also does not address how much vineyard is likely to be planted in the future.

Using a modeling technique to analyze GIS data enables scientists to map areas of possible future vineyard expansion.
The model does not yet include all of the variables that are important in determining site suitability for growing grapes. We are collecting General Plan land-use data from county maps and soil characteristics from the county soil survey. However, data representing important microphysical variables is essentially unobtainable in digital format for the entire county, given limited academic research funds (for example, microhabitat variables related to climate, site-specific soil properties and high-resolution topography). In addition, economic variables such as the future value of Sonoma County's wine grapes and the availability of land for sale are very important but were not considered in this first modeling exercise.
Vineyards were not mapped for the western third of the county in the original mapping effort because it was not an important grape-growing region from 1990 through 1997. However, some vineyards have recently been planted in western Sonoma County, where coastal forestlands represent the majority of the land cover. This fact, and the knowledge that patterns have changed over the past 10 years, indicates that trends could change again as long as the demand for high-quality wines and new varieties continues to grow. Nevertheless, landscape characteristics considered favorable in the past will probably continue to be favorable, and parcels with these characteristics will remain attractive for vineyard development if growing wine grapes continues to be profitable.
The method of selecting which vineyard and nonvineyard cells to include in the model affects the correlations between certain landscape variables (e.g., elevation) and vineyard development. To build the version of the model presented here, we used all the available cells from the selected vineyards; however, future work should include analysis on the effects of weighting the number of samples from a given vineyard according to its size.
Habitat fragmentation impacts
Biodiversity is reduced when natural habitats are converted into urban, suburban and agricultural land. This problem is compounded by the fragmentation of contiguous natural areas into an increasing number of smaller fragments, each of which may not be large enough to support viable populations of all the original inhabitants.
Fragmentation has been linked to a number of environmental consequences, in Sonoma County (Merenlender et al. 1998) and elsewhere (Saunders et al. 1991; Forman 1995; Turner 1996; Harrison and Bruna 1999). These include physical effects due to increased amounts of forest edge that cause changes in microclimate (Chen et al. 1995) and can result in tree mortality (Ferreira and Laurance 1997; Esseen 1994). The biological effects of fragmentation include a decline in species requiring large amounts of connected habitat (Beir 1993; Stouffer and Bierregaard 1995) and increased predation of native fauna (Andren 1995; Sieving and Karr 1997).
To identify where vineyard expansion may lead to future habitat fragmentation, we identified predicted changes in habitat connectivity resulting from one expansion scenario. First, as a baseline, we mapped continuous patches of tree cover that existed in 1990 using a vegetation map of Sonoma County based on 1990 satellite imagery (82-foot resolution) provided by the California Department of Forestry and Fire Protection. A continuous patch of tree cover was defined as being at least 164 feet away from urban areas, and all cells comprising a patch had to contain or be within 82 feet of a forest or woodland habitat type (blue oak woodland, coast live oak woodland, conifer or montane hardwood). Furthermore, a continuous patch had to be a minimum size of 250 acres in the north part of the county or 50 acres in the south, with the exception of the Laguna de Santa Rosa area, where all areas mapped as tree cover were analyzed as habitat patches. A smaller minimum patch size was used for the more developed southern county because larger patches of woodland are not common there, making smaller habitat patches essential for wildlife conservation.
The oaks in the Laguna de Santa Rosa area are primarily valley oaks, now considered a rare community type. Tracking changes to this habitat at the highest resolution possible was of prime importance. These patch-size criteria were developed with input from researchers and land managers familiar with Sonoma County's oak woodlands.
Each patch of connected tree cover resulting from this analysis is represented by a different color in figure 2a. Within the study area, we calculated that there were 3,648 continuous patches of tree cover prior to conversion, totaling 252,067 acres. Five of these patches were larger than 5,000 acres, 16 were 250 to 5,000 acres, and 3,627 were less than 250 acres (fig. 3).
Using the results from the version of the model mapped in figure 1, we then mapped all “available” non-vineyard land that had a probability value greater than 0.5 as vineyard. In a sample with an equal number of vineyard and nonvineyard observations (as was used in the version of the model presented in fig. 1), the probability of drawing a vineyard cell at random is 0.5. In such a sample, a cell with an estimated probability value greater than 0.5 is more likely to be a post-1990 vineyard than randomly expected, and a cell with a value less than 0.5 is less likely to be a post-1990 vineyard. For the version of the model mapped in fig. 1,78% of all post-1990 vineyard cells had a probability greater than 0.5, indicating that although cells with a probability value less than 0.5 may be suitable for vineyard development, cells with a value greater than 0.5 were developed more often.
Using an expansion scenario with probability greater than 0.5, an additional 133,581 acres of vineyard were mapped. This is not to say that this entire acreage is plantable. For example, in some areas the temperature or the chemical composition of the soil may prevent the production of wine grapes. It is unlikely that 133,581 acres of new vineyard will ever be planted within the study area, considering that in 1997 there were 48,000 acres of vineyard. However, the model would predict that the 9,000 acres of vineyard currently being added (and registered by October 1999 in the Agricultural Commissioner's Office) will more likely be planted within the areas designated by this expansion scenario.
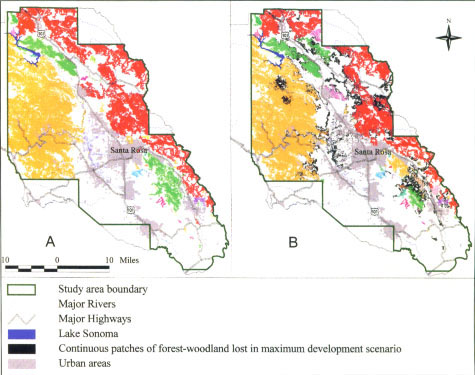
Fig. 2 Patches of continuous tree cover before (A) and after (B) the maximum vineyard development scenario for the Sonoma County study area. Each patch is shown by a unique color.
Use of this “maximum development scenario” allows for a conservative estimate of woodland areas that may be desirable for vineyard expansion. Land-use planners can use this scenario to identify which woodlands may warrant protection, given zoning and land sales patterns. One of the most effective uses of this analysis is to learn where continuous patches of tree cover and areas of high vineyard suitability overlap. This is where fragmentation of ecologically valuable woodland habitat is more likely to occur. According to our results, areas that may receive significant habitat loss and fragmentation include hillsides east of Healdsburg, Sonoma Valley, and the west side of Santa Rosa (fig. 2a, 2b, also p. 9).
The habitat type most threatened by vineyard expansion in the Mayacmas range running along the east side of Sonoma County and Sonoma Mountains west of Sonoma Valley is absent from the more coastal or steeper sites in Sonoma County (fig. 4). The overstory is predominantly Oregon, valley, black, blue and/or coast live oak and is accompanied by a diverse under-story of native perennial grasses and shrubs such as toyon and manzanita.
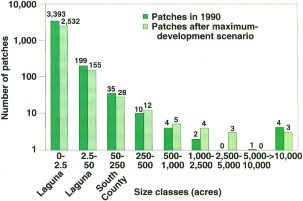
Fig. 3 Distribution of patches of continuous tree cover before (1990) and after the maximum development scenario. Patches less than 50 acres were mapped only for southern Sonoma County. Patches greater than 250 acres were mapped for the entire Sonoma County study area.
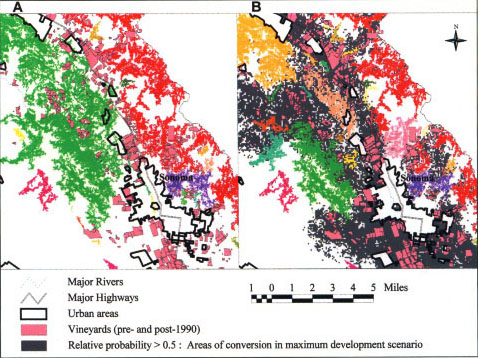
Fig. 4 Patches of continuous tree cover in Sonoma Valley before (A) and after (B) the maximum vineyard development scenario. Each patch is shown by a unique color.
Moister sites may include Douglas fir and redwood, while flatter areas such as the Laguna de Santa Rosa area primarily support remnant stands of valley oaks.
Figure 2b displays the continuous patches of tree cover that would persist after the “maximum vineyard development” scenario. After applying the conversion scenario, there were 2,742 patches, totaling 222,868 acres. Three of these were larger than 5,000 acres, 24 were 250 to 5,000 acres, and 2,715 were smaller than 250 acres. The increase in the number of medium-sized patches after conversion is due to the fragmentation of larger forested areas into several smaller ones. Over 900 small patches, primarily in the Laguna de Santa Rosa area, are lost altogether when the maximum vineyard development scenario is run. The removal of habitat using the maximum development scenario resulted in a size reduction of the largest patches, deletion of the smallest patches and an increase in the number of medium-sized patches (fig. 3).
Future directions
Recent developments in computer power and mapping analysis software have made it possible for more researchers to model land-use change across large geographic regions (Goodchild et al. 1996). This approach has allowed us to map areas that may be suitable for vineyard expansion and areas where conversions could cause habitat loss and fragmentation. We would like to continue to monitor where vineyard expansion occurs to determine if the areas identified are indeed converted from woodland to vineyard.
We would like to expand our investigations in this area by using remote sensing to monitor vineyard development more regularly and across a larger geographic region. Active collaborations have been initiated to investigate how changes in vineyard development costs and wine-grape values may affect development patterns. We also hope to improve our current model by including additional environmental variables, such as soil characteristics and water availability.
Although vineyard expansion can have negative environmental impacts, other land-uses changes such as urban and exurban development also have consequences for habitat fragmentation and biodiversity. Integrating urban expansion models with our vineyard expansion model will allow us to explore changes in the urban-agriculture-wildland interface, resulting in a better understanding of the forces driving these changes and the relative impacts of different land uses on various ecological processes. It will also be important to incorporate the county planning process in future studies, because areas suitable for vineyard development may be more valued for other land uses such as urban or rural residential.
We have presented this initial model and its results to county planners, agencies and citizens, generating discussion at the local level ( see sidebar, p. 19 ). Further, this method has provided open-space acquisition planners with some direction for protecting oak woodlands, demonstrating that this information can be used to support science-based planning and policy decision-making.
Modeling vineyard expansion, potential habitat fragmentation

