


All Issues
Past, present and future: Immigration, high fertility fuel state's population growth
Publication Information
California Agriculture 54(1):11-18. https://doi.org/10.3733/ca.v054n01p11
Published January 01, 2000
PDF | Citation | Permissions
Abstract
Immigration, and births to new immigrants, will continue to fuel California's population growth, not just in the urban areas but in the cities and towns of rural counties. Local communities will face a wide range of social and economic changes as they adapt to increasing population diversity. As we enter a new century, the demands for greater investments in education, health care and other aspects of the urban infrastructure will increase.
Full text
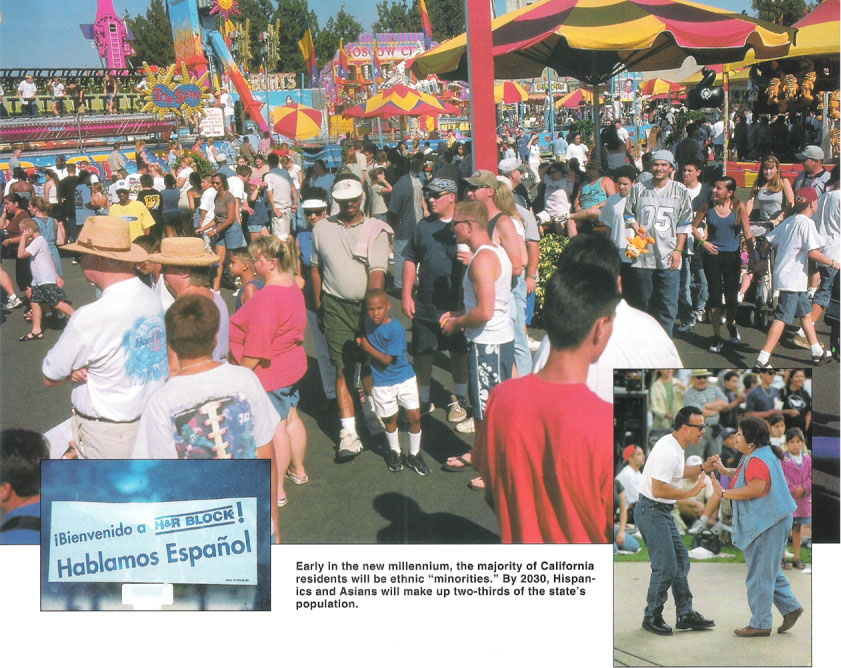
Early in the new millennium, the majority of California residents will be ethnic “minorities.” By 2030, Hispanics and Asians will make up two-thirds of the state's population.
During the 1990s, California added almost 3 million people, including many new immigrants and a large number of new births. The flows have already transformed our large cities, and are now affecting the small towns and rural communities. In a little more than a quarter of a century, well within the lifetimes of most Californians, the state's population is projected to grow to 50 million (from 35 million in 2000), and the composition will be an even greater mix of races and ethnicities (California Department of Finance 1998; fig. 1). How will these changes affect the state as a whole and the agricultural community in particular? What are the implications for the counties that serve as the fruit and vegetable basket of the United States?

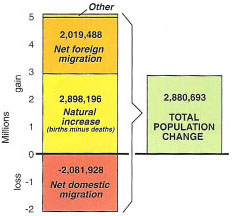
Fig. 1 Changing population of California. Source: California Department of Finance, Demographic Research Unit, 1998.
The United States is, of course, a nation of immigrants, and California is no different. The American economy, culture and political structure have long been defined and shaped by waves of new residents from Europe, Africa, Asia and Central and South America and elsewhere. Like all previous waves, the current flow of immigrants to California will change the social and occupational structure of the state and provide new opportunities and challenges.
The growth process
Rapid population growth is not new to California. The state grew rapidly with internal immigrant waves in the 1920s and 1930s, and again after World War II, when a westward migration transformed the state into the most populous in the nation. Since the Hart Cellar Act of 1965 transformed immigration laws, California has received a large number of new migrants; the foreign-born population has grown from less than a million in 1970 to almost 8 million in 1998.
The state grew by almost 15 million people between 1970 and 2000, more than 70% (fig. 1). Between 1990 and 1998 alone, 2.88 million people were added. That growth includes a net inflow of a little more than 2 million international migrants (fig. 2), as well as 4.7 million new births. The total natural increase (births minus deaths) of 2.9 million is actually greater than the total increase in the state. However, California also experienced net domestic out-migration of over 2 million in the 1990s, resulting in total growth of approximately 2.88 million people through July 1998.
Proportionately, new immigrants provided 74% of the net growth of California's population. Much of the natural increase is due to the higher fertility rates of the new immigrant population. About half of all births in California are to foreign-born mothers (Clark 1998). The domestic out-migration from California during the 1990s was related to the downturn in the state's economy early in the decade. Changes in domestic migration are quite susceptible to economic changes and thus will rise and fall with the state's economic trajectory.
Overall, it is likely that the growth of the past 30 years will continue in the coming decades. Immigrants are still coming to California, and there is no sign that the flows will slow in the next two decades, even though increased border enforcement is making it more difficult to make the passage. Moreover, research shows that there is less circular migration than there was 40 years ago (Binational Study 1998). More people are coming and fewer are returning to Mexico and other Central American nations.
Current migration is a function of previous migration; it is a self-perpetuating process. The migrants who came earlier and stayed set up a social world for future waves of migrants, especially now that family reunification is a major part of the legal immigration process. Because migrants have increasingly dispersed throughout California, their populations will increase not only in the large urban areas, but also in the rural towns and cities. This population growth will have important implications for rural communities in the 21st century (Medvitz 1998).
State demographers now predict that California will grow to almost 52 million people by 2030 (California Department of Finance 1998). That growth is more than the current total population of the five-county Southern California region, and it will be very different in composition. Projections by the State Demographic Unit suggest little change in the size of the non-Hispanic, white population, but a significant growth of the Hispanic and Asian populations.
Therefore proportions of the non-Hispanic, white population will decline in relation to the entire population (fig. 1). However, as time goes by and intermarriage increases, the number of mixed-race/ethnicity families will increase. It will be more difficult to speak of Hispanic or Asian households. In addition, the new “check all” self-identification in the 2000 census will create a much more complex structure of self-reported ethnic groupings.
During the first few years of the new millennium, California will no longer have a white non-Hispanic majority, and by 2030 almost 44% of the population will be Hispanic. Asians and Hispanics together will make up more than two-thirds of the state's population, a change in ethnicity that will alter the enrollment of schools and colleges and instigate changes in political representation as these new groups participate more actively in the political process.
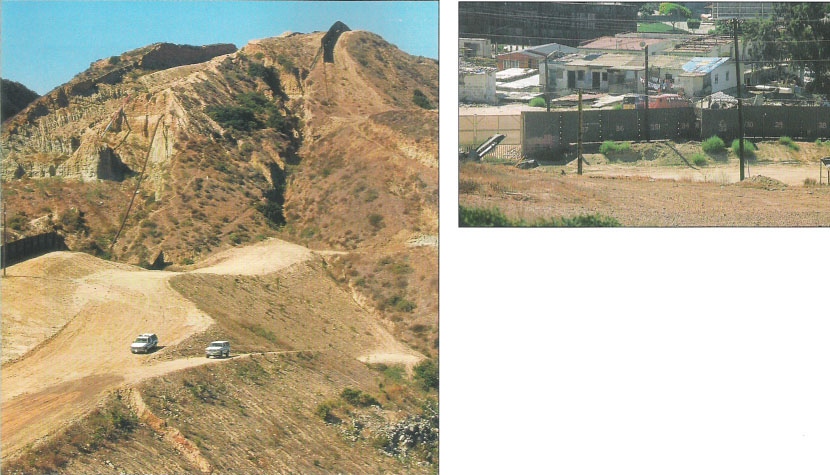
Control efforts have increased along the U.S./Mexico border, such as top right, where a wall faces Tijuana housing, and above, where border vehicles patrol a fence near San Ysidro. There are few signs that immigration to California will slow significantly in coming decades.
Aging and fertility
The coming changes can be traced to different age/sex pyramids and fertility differentials of the white, black, Asian and Hispanic populations of the state. The pyramids, which show absolute numbers in age categories for these groups, reveal striking contrasts between the white and Hispanic populations, California's two largest groups (fig. 3). The white population pyramid shows clearly the baby-boom population, now approximately 35 to 55 years old, and the baby-boom echo, between 5 and 19 years old. The graph also shows that the white population is aging rapidly, with large proportions of retirement-age men and women, especially the latter. The graph is quite unbalanced in the older-age female categories. The white population pyramid is beginning to show the classic rectangular pattern of advanced information societies, where the youthful and older populations are nearly equal.
The Hispanic age-sex pyramid is much more youthful, with the diagram more nearly a true pyramid. The large number of very young children, under 9 years of age, is nearly half again as large as the white population, and it is not difficult to envision how this very young population will translate into future increases in the Hispanic population. The average fertility of Hispanic women in California is about 3.5 children, and it is higher for Hispanic women with less than a high-school education. Relatively high fertility, large numbers of young women in the childbearing ages and continuing Hispanic immigration will continue to increase the size of the Hispanic population in California. While the white, non-Hispanic population is projected to grow by about 1 million in the next 30 years, the Hispanic population is projected to more than double, from 10.7 million to 22.6 million.
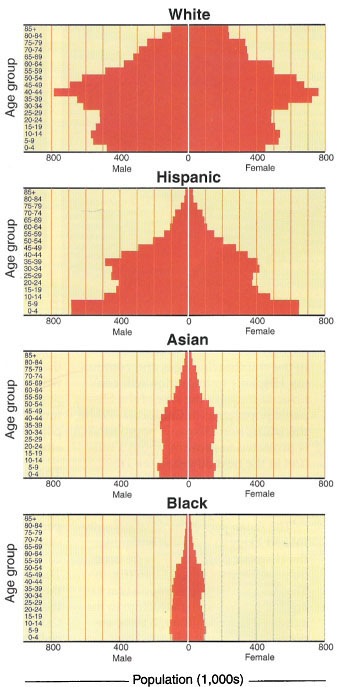
Fig. 3. Age-sex pyramids of projected populations in 2000 by ethnicity in California. Source: California Department of Finance, Demographic Research Unit, 1998.
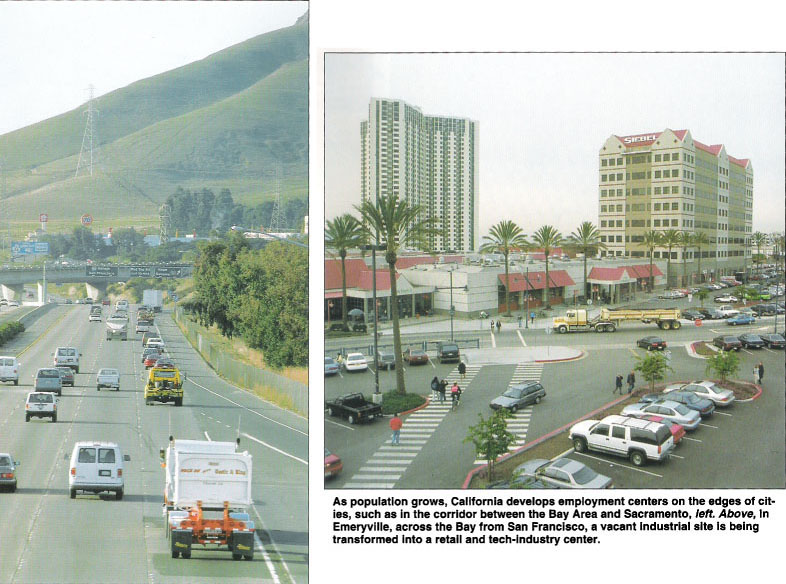
As population grows, California develops employment centers on the edges of cities, such as in the corridor between the Bay Area and Sacramento, left. Above, In Emeryvilie, across the Bay from San Francisco, a vacant industrial site is being transformed into a retail and tech-industry center.
The Asian population is also youthful and likely to increase, but unlike the Hispanic community, there is no bulge of very young children (fig. 3). The African-American population has an almost rectangular structure to the age-sex pyramid, although there are not nearly as many African-American elderly people. The raw population numbers, plotted by age, place in perspective the declining relative proportion of the black population in California. The Asian population is currently about one and a half times the size of the black population, and by 2030 it will be more than twice as large. The population pyramids foretell the future of the state — an aging white population and a growing, youthful, ethnic population.
The geographical context
All of California is undergoing a significant transformation, but the impact is greater in some areas of the state than in others because not all counties are growing at the same rate. There is an ongoing transformation of the old patterns of clustered growth in the major urban cores of Southern California and the Bay Area. These counties will continue to grow (fig. 4), increasing by about 7.5 million people in the next 30 years. But the top 10 agricultural counties — including the Central Valley counties of Kern, Tulare, San Joaquin, Fresno and Merced — are also expected to increase by 6.6 million during the same period, almost as much as the major urban counties.
Proportionately, the agricultural counties are predicted to grow 80% in the next 30 years. That growth will be in urban centers like Fresno and Stockton, and also in the small towns. In addition, there will be a large-scale transformation of San Diego County, which is both a top agricultural producer and a major urban region.
The growth in the traditional urban areas around Los Angeles and in the Bay Area is increasingly at the edges of the metropolitan areas. These “edge cities” (Garreau 1991) have become centers of employment for an increasingly dispersed urban population. The traditional dominance of downtown urban cores, never strong in California, will be even weaker in the coming decades. This multinodal urban structure will further mingle the urban and rural contexts and increase the deconcentration of the metropolitan population in California.

Fig. 4. Projected population change 2000-2030 in California counties. Source: California Department of Finance, Demographic Research Unit, 1998.
Much of the growth that is occurring in the Central Valley, especially in the corridor between the Bay Area and Sacramento, and in the northern San Joaquin Valley, is spillover into formerly agricultural land. Bay Area commuters and other newcomers are moving into new housing developments that are springing up in suburbs within long-distance driving of urban employment centers. A similar process is occurring in San Diego County along the corridor from San Diego to Los Angeles and in the interior valleys along Interstate 15 between Riverside, Escondido, Temecula and San Diego.
The changes in the composition of the population will affect smaller communities too — it will not be only a big-city phenomenon. Many counties and their cities will be ethnic pluralities (that is, there will not be a dominant ethnic group) by the end of the next decade. In 1990, only Los Angeles County had an ethnic plurality, but in the coming decade ethnic pluralities will cover a broad band of counties from Riverside to the suburban counties of the Bay Area (fig. 5). All of the southern San Joaquin Valley will be an ethnic plurality by 2010.
Social and cultural changes will accompany California's growth in size and ethnic diversity. For example, Hispanic immigrant neighborhoods often develop amenities such as soccer and social clubs, which in turn make them more like home for prospective migrants. This is a sign of the ability of new immigrants to create a social world for themselves and their children in their new homeland.
Equally important, the political landscape will change as candidates consider a diverse population with different needs from those of the formerly majority white population. Even though there were always ethnic neighborhoods in the towns and cities of the Central Valley, the look and feel of neighborhoods, and the issues that have been central in multiethnic counties like Los Angeles, will become more common in the neighborhoods of Fresno, Stockton, Modesto and Visalia.
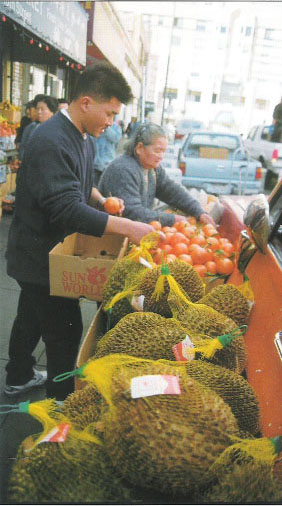
Oakland's Chinatown is truly Pan-Asian, with multicultural residents from China, Taiwan, Vietnam, Cambodia, Korea and other countries.

Fig. 5. Counties with an ethnic plurality in 2010. Source: California Department of Finance, Demographic Research Unit, 1998.
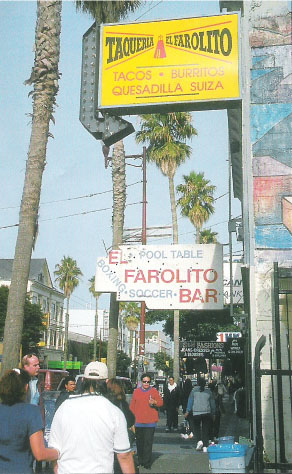
San Francisco's Mission District serves as a transitional neighborhood for many new immigrants.
Implications of population change
In the past, the primary destination for immigrants was the large cities of California. There were always migrants in the fields, but many were temporary or moved from rural areas to jobs in cities. New immigrants not only are moving directly to Central Valley towns, they are staying (Binational Study 1998). They find land and housing less expensive than in the major metropolitan regions, providing greater opportunities to achieve the American dream of becoming a homeowner.
With larger, permanent-resident immigrant populations, rural towns and cities will face issues previously thought to be the exclusive domain of metropolitan areas (Taylor et al. 1997). While the impacts of population growth and change are numerous, the general social problems of education, health care and housing can serve as important illustrative examples.
Population growth increases the needs for schools and teachers, especially those with multilingual skills. Larger numbers of people earning relatively low incomes also increase the need for subsidized health care. Youthful populations tend to have more children, and these children require doctors, community health facilities and hospitals. When populations grow rapidly and change in unpredictable ways, local communities are often caught in the position of having to provide new and expanded facilities.
Education.
A relatively recent and important outcome of the changing population composition is that the schools are faced with children who have difficulty in the California educational system. Limited English proficiency (LEP) students have increased almost 50% in the past decade in California (California Department of Education 1999). While most of these students used to be in Los Angeles and Orange counties, and the majority still are, there are seven additional, more rural, counties that have proportions of LEP students greater than the California average (fig. 6).
Immigrants (and their children) who move to take temporary agricultural work usually have few skills, and their incomes are low compared with, for example, those who move to the high-tech centers of the Bay Area (McCarthy and Vernez 1997). It is therefore not surprising that rural immigrant children may be educationally disadvantaged. Although education is largely funded by the state, the local school districts must find the teachers and help acclimate these new students to the American educational system.
Teenage pregnancy.
Low education levels are not unrelated to high levels of teenage pregnancy. In the past, teenage pregnancy was often associated with inner-city black populations in the large metropolitan areas. Although Los Angeles is above the statewide average for teenage pregnancies, many of those pregnancies are to new immigrant children. The pattern of counties with rates of teenage pregnancy that are above the statewide average underscores the increasingly strong impacts on rural counties and their urban areas (fig. 7). The statewide, age-specific birthrate for teenage mothers was 61.7 (the annual rate per 1,000 young women), which is well above the rate for the United States as a whole (51.1 per 1,000), and 16 counties exceeded it. Fresno, Kern, Kings, Yuba, Merced, Madera and Tulare counties had rates of more than 85 births per 1,000 young women.
There is a growing dynamism between immigration and social and cultural change, and the population mixing that was once more obvious in some large inner-city communities will soon be the norm for a sweep of communities across California.
Health care.
Associated with teenage pregnancy, and with large numbers of births to low-income families, are issues of infant health care. The national objective for prenatal care in the first trimester of pregnancy is 90% California as a whole is at 79.5%, and more than half of the counties in California are below this figure. Kern, San Joaquin, Tulare and Merced are all at 75%. One-quarter of the pregnancies in these counties have late or no prenatal care (California Department of Health Services 1999a).
What were often large-county issues are becoming issues in all California counties, as indicated by the fact that Kings, Madera, Merced, Monterey and Tulare counties are all experiencing high levels of Medi-Cal-funded deliveries (fig. 8). In 1997 Tulare County had 3,464 Medi-Cal-funded deliveries, costing $10.2 million, and Monterey County had 2,790 deliveries, costing $12.7 million (California Department of Health Services 1999b).

Fig. 6. Counties that have greater proportions of students with limited English proficiency than the California average in 1998-99. Source: California Department of Education, 1999.
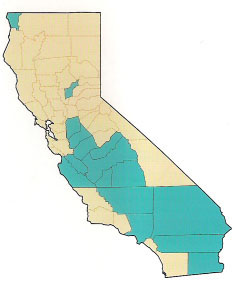
Fig. 7. Counties that exceeded the California-wide teenage pregnancy rate in 1997. Source: California Department of Health Services, 1999a.

Fig. 8. Counties that have rates of Medi-Cal-funded deliveries 50% greater than the California average in 1997. Source: California Department of Health Services, 1999b.
Housing.
Increases in population create needs for housing and other elements of shelter infrastructure, from sewers to streets. Because there is very little public housing in California, housing provision has been and still remains a private-sector activity. Given a rapidly increasing low-wage population in a state with relatively high housing costs, there are bound to be stresses in the system. Anecdotal reports document overcrowding and inadequate housing across a wide range of contexts, but nowhere more dramatically than in the agricultural regions of California's Central Valley. Migrant workers, who follow the harvests, are often crowded 10 to a room in cheap motels. The federal Commission on Agricultural Workers estimates that nearly a third of California's farmworkers lack adequate shelter (New York Times, May 31, 1998)
The Statewide Housing Plan Update estimated that California had an annual need for more than 200,000 units during the 1990s, but produced only a little over 100,000 units annually (California Housing Resource Center 1998). The greatest shortfall has been in the production of multifamily housing. The gap between housing demand and housing production has created greater housing cost burdens, especially in the major metropolitan areas, where rents increased by 20% to 35% between 1995 and 1997.
Nearly half of all renter households in California paid more than 30% of their income for housing; among poor renters, 63% paid more than 50% of their income for housing (California Housing Resource Center 1998).
Along with problems of afford-ability, there are increasing problems of overcrowding, especially for low-income Hispanic households, which account for more than three-quarters of all severely crowded households. Overcrowded units often have problems and require rehabilitation. Statewide, about 12% of the housing stock is substandard, but that figure rises to between 20% and 25% for much of the Central Valley housing stock.
Future in focus: Policy debates
The changes occurring in California are connected to worldwide changes in immigration and globalization (Clark 1998), which are similar to those in a wide variety of other countries and states. The changes occurring now, and those expected in the next three decades, are related to continuing high levels of legal and illegal immigration, to the demand for low-wage labor by industrial and agricultural entrepreneurs in California, and to the lack of a consensus on a population policy for the United States as a whole. The outcomes are altering local social and economic contexts and are imposing considerable burdens on some local governments (Clark 1998).
There is no evidence, given current legal admissions of almost 1 million people per year to the United States, that the California population will slow its growth even after 2030. Although it is expected that the current high fertility of the new Hispanic population will decrease, even modest fertility levels will continue to increase the Hispanic population. In addition, Mexico will grow to about 150 million by the middle of the next century, putting pressure on job provision within Mexico and motivating young workers to look for work in the United States. Given current conditions in Mexico, it is not at all clear that Mexico will have sufficient job growth for its expanding population. We can expect continuing flows whether there are jobs in California or not.
The population growth in traditionally rural counties has increased pres-sure to control “sprawl” and limit farmland conversion to urban uses (Sokolow 1998). Californians are struggling to balance the growing demand for housing with the need to protect natural resources and agriculture. In the absence of regional or statewide land-use policy, land-use decisions are fragmented, as illustrated by growth-control proposals in some communities coexisting with virtually unregulated growth in others. Finding a balance between demands for housing and protecting California's agricultural and natural resources will take place amid expanding concern over local growth-control proposals. The recent decision of the Packard Foundation to fund farmland purchases is a sign of the renewed focus on urban growth and urban encroachment (Los Angeles Times, Oct. 24, 1999). As already demonstrated, nowhere is this more apparent than in the Central Valley.
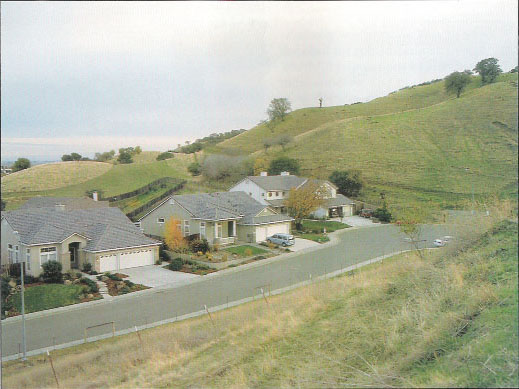
Low-income and publicly funded housing are hard to come by in California, while private-sector builders cater to middle- and upper-income buyers. One-third of the state's farmworkers lack adequate shelter.
The flows of undocumented migrants will not decrease either. Current estimates from the U.S. Immigration and Naturalization Service's Office of Policy and Planning suggest undocumented flows of about 275,000 per year to the United States. About half are from Mexico, and the majority enter through California even if they do not stay in the state. Some sense of the pent-up demand for entry to the United States is contained in the waiting lists for visas. In 1997 there were more than a million Mexican nationals waiting for visas to the United States (Clark 1998). Moreover, where once the flow of undocumented immigrants was largely male and youthful, the flow now includes many more families and women.
California in the next two to four decades will undergo changes that are not dissimilar to earlier periods of rapid growth in California history. The issue is how to incorporate and empower these new Californians. Although many new immigrants bring needs for additional resources, they are also a large proportion of the California labor force, and they provide much of the low-wage labor for the low-cost services that Californians enjoy on a daily basis. In addition, ethnic diversity continues to enrich the state, both culturally and socially. At the same time, the state would be amiss if it did not recognize that a significant proportion of the new immigration population is struggling with low incomes and limited opportunities.
The question for California now is how to invest in education and social services to ensure that the new flows into the state enrich California just as earlier waves set the stage for today's social and economic advances.
Past, present and future: Immigration, high fertility fuel state's population growth

