


All Issues
Timing, frequency of sampling affect accuracy of water-quality monitoring
Publication Information
California Agriculture 53(6):44-48. https://doi.org/10.3733/ca.v053n06p44
Published November 01, 1999
PDF | Citation | Permissions
Abstract
Monitoring water quality is a major issue on California's rangeland watersheds, and there is limited published data to guide these efforts. We used stream-flow and water-quality data from experimental rangeland watersheds to demonstrate the temporal variability of water quality at the storm, season and annual time scales. The timing and frequency of water sampling from the storm to the annual time scale play an extremely significant role in water-quality monitoring. Our studies conducted in Northern California suggest that a minimum sampling strategy should include sampling before, during and after storms. Samples must be collected over a period of several years to account for variability among years.
Full text
Water-quality monitoring on California's annual rangelands has become a high priority for ranchers, watershed groups, regulatory agencies, land management agencies, municipal drinking water districts, consultants and environmental groups throughout the state. This interest and activity is fueled by concerns about potential grazing and range management impacts on water quality. Recent events such as the listing of various anadromous fisheries on the Federal Endangered Species List, development of numeric standards (Total Maximum Daily Loads) for nonpoint source constituents and litigation concerning grazing impacts on watersheds that provide municipal drinking water ensure that this interest will not diminish soon. Sediment, nutrients, pathogens and increased stream-water temperature are the primary water-quality concerns on California rangelands.
Key to an effective water-quality monitoring program is the establishment of well-planned and concise monitoring objectives. A common monitoring objective of ranchers and managers is to determine pollutant levels in water bodies that pass through lands they manage and to identify possible contributions resulting from their management activities. Watershed groups and funding agencies are often interested in assessing improvements in water quality following implementation of best management practices (BMPs), such as erosion-control structures or improved grazing management. Regulatory agencies charged with developing Total Maximum Daily Loads (TMDLs) are required to document reductions in pollutant concentrations and loading for several decades into the future. Although these are valid and important monitoring objectives, difficulties with funding, logistics, technical skill and the inherent variability of nonpoint source pollution on rangeland watersheds can make it extremely difficult to achieve monitoring objectives.
A fundamental understanding of the system to be monitored is critical for developing realistic monitoring objectives and for developing monitoring plans to achieve these objectives. Our collective experience has taught us that successful monitoring of nonpoint source water-quality constituents on rangelands must account for the temporal variability of constituent concentrations. The objective of this paper is to demonstrate the inherent temporal variability of several important nonpoint source constituents at the individual storm event, seasonal and annual time scales from experimental rangeland watersheds in Northern California.
Experimental watersheds
We have established four experimental oak woodland watersheds at the UC Sierra Foothill Research and Extension Center (SFREC) near Brown's Valley. These watersheds allow for replicated short-term and long-term study of the relationships between weather, hydrology, water quality, ecology, nutrient cycling and range management. The watersheds also serve as field demonstration sites for extension education. We established SFREC Watersheds 1, 2 and 3 and began monitoring in 1996. Watershed areas are 86.5 acres (35 ha), 197.6 acres (80 ha) and 286.5 acres (116 ha) respectively. The 254.4 acre (103 ha) Schubert Watershed was established in 1978 and has an 18-year record of stream flow and water quality. The watersheds are used for light to moderate beef cattle grazing, primarily from January through March and August through October. For example, the average stocking rate over the 18-year period on the Schubert Watershed was 0.1 animal unit per acre (0.22 AU/ha) per year. Data from SFREC Watershed 2 for the 1997 water year (October 1997 through September 1998) and from Schubert Watershed for water years 1981 through 1998 are used to demonstrate water-quality temporal dynamics in this study. These data show trends similar to other rangeland watersheds (for example, Hopland Research and Extension Center and Mokelumne River Watershed) that we are studying in Northern California.
Stream flow and sampling
Stream flow is monitored at flumes installed at the outlet of each watershed. Stream flow is measured and recorded on a 0.25-hour time step using electronic stage sensors and data loggers. We collected stream water samples on a 1-to-2-hour time step during storm events using automatic pump samplers. Base-flow samples were collected every 3 or 4 days for periods between storm events. In this study, we report data for stream discharge, turbidity, suspended solids, ammonium (NH4-N), nitrate (NO3-N) and ortho-phosphate (PO4-P) for Watershed 2 and suspended solids and total mineral nitrogen (NH4 + NO3) for Schubert Watershed. Data from Watersheds 1 and 3 support the data reported for Watershed 2. Simultaneous monitoring of flow and constituent concentrations allowed us to determine the constituent load (kg/ha or lb/ac) leaving the watershed for any time interval. The load for a given sampling interval was calculated by multiplying flow (in liters) for the sample interval by the mean constituent concentration (measured in milligrams per liter) for the sample interval.
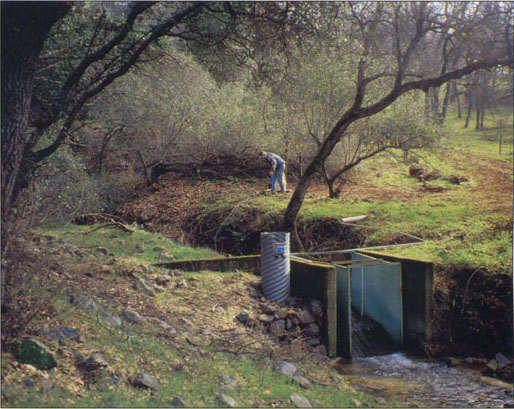
Stream flow is measured and recorded every 15 minutes.
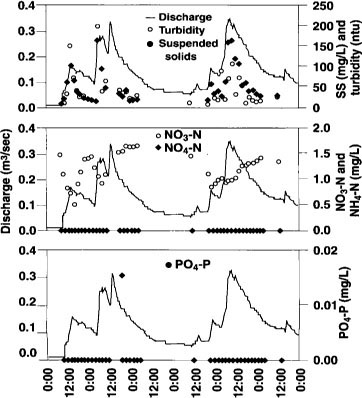
Fig. 1. Stream flow and constituent concentrations from SFREC Watershed 2 for the period of Jan. 11-16, 1998. (cfs = 35.31 x m3/ sec).

Fig. 2. Stream flow and constituent concentrations from SFREC Watershed 2 for the period Dec. 1, 1997 through April 15, 1998. (cfs = 35.31 x m3/ sec).
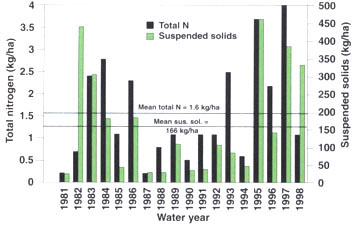
Fig. 3. Annual total mineral nitrogen (NH4 + NO3) and suspended solids load from the Schubert Watershed for the period 1981 through 1998. (Ib/ac = 0.89 x kg/ha).
Water quality variable over time
Storm event variability.
In California oak woodlands and annual grasslands, it is common for a large portion of the total yearly stream discharge to occur during storm events. The large runoff associated with storms allows these events to export potentially large loads of nonpoint source constituents from watersheds. Therefore it is critical to intensively monitor changes in water quality constituents during the rising and falling limbs of the storm hydrograph.
Figure 1 shows the response of the hydrograph for Watershed 2 during a week in January 1998 with substantial precipitation. There were 10.5 inches (267 mm) of rainfall on the watershed prior to these storms. The rising limb of the hydrograph responds quickly to precipitation events, and the return to base-flow conditions occurs over the period of a few days in the absence of additional rainfall (figs. 1 and 2).
Suspended solids concentrations and turbidity tend to rise and fall in a pattern similar to the storm hydrograph, with peak concentrations occurring near the peak of the hydrograph (fig. 1). Suspended solids are particles greater than 0.45 microns in size suspended in stream flow; they are often equated with sediment. Turbidity is a measure of the clarity of water, where clarity decreases as turbidity increases. There is an apparent hysteresis effect, with suspended solids concentrations tending to be higher during the rising limb as compared to similar discharge on the falling limb. This hysteresis effect is commonly observed and results from transport of easily erodible materials early in the storm and depletion of these materials later in the storm.
Nitrogen and phosphorus are the two nutrients of greatest concern as nonpoint source constituents in California rangelands. Concentrations of ammonium are generally negligible in stream waters from most rangeland watersheds because ammonium is positively charged, allowing it to bind to cation exchange sites in the soil. Although ammonium concentrations in Watershed 2 were below detection limits, nitrate concentrations were elevated during these storm events (fig. 1). Maximum nitrate concentrations were about 4 mg NO3-N/L, which is well below the EPA drinking-water limit of 10 mg NO3-N/L. Concentrations of nitrate fluctuated by a factor of about 2 during storm events, showing a general dilution during the rising limb of the hydrograph and a recovery during the falling limb.
Concentrations of ortho-phosphate were below detection limits, with the exception of one sample that had trace levels (< 0.02 mg PO4-P/L). Phosphate is strongly retained by interactions with soil particles and is generally found at very low concentrations in natural waters. The majority of phosphorus exported from watersheds occurs in association with the suspended solids fraction. Ortho-phosphate may bind to the inorganic fraction of the suspended solids, or the phosphorus may be incorporated as a component of organic matter. This bound phosphorus may be released from the suspended solids, making it available to the aquatic biological community.
Seasonal variability
Suspended solids concentrations appear to be largely regulated by the intensity of the precipitation and corresponding runoff (fig. 2). However, interactions between hydrological and biological processes produce distinct patterns in the concentrations of nitrate over the course of a water year (fig. 2). Nitrate concentrations reach maximum values (~4 mg NO3-N/L) during the first major runoff event of the year and show a progressive decrease to concentrations less than 1 mg NO3-N/L by the end of the water year (fig. 2). This pattern results from a temporal discoupling of nutrient cycles in the Mediterraneanlike climate common on California's annual rangelands. There are distinct wet and dry seasons, which temporarily breaks the annual nutrient cycle on these watersheds.
Nitrate accumulates in the soil during the summer and fall periods, when plant uptake and leaching processes are very low. Nutrient uptake by oak trees is limited during the summer due to the soil water deficit, which severely reduces transpiration. Blue oaks become dormant in the fall and are generally inactive until about mid-March. Similarly, annual grasses germinate with the first fall precipitation; however, their growth is limited by cold temperatures until the beginning of March. Therefore the nitrate that accumulates in the soil over the dry period is highly susceptible to leaching because biological uptake is very low until March. The accumulated nitrate is progressively flushed out of the soil (especially from the upper soil horizons), resulting in lower concentrations of stream water nitrate during subsequent storms.
Because nitrate concentrations are further reduced by plant uptake once the oak and annual grasses begin their-rapid spring growth, oak woodland and annual grassland ecosystems are naturally susceptible to nitrate leaching, even in the absence of grazing and management activities. It is therefore unrealistic to expect to reduce nitrate concentrations to nondetectable levels in streams that drain these ecosystems.
Annual variability
There is considerable variability in the magnitude of constituents exported from the watershed on an interannual time step. Annual loadings (kg/ha/yr or Ib/ac/yr) are the most appropriate measure for comparing interannual variation. Loadings are calculated by combining the stream flow volume with the mean constituent concentration over a given interval of time. Using the data in Figure 2, we calculated the 1997 annual suspended solids, NO3-N, NH4-N and PO4-P loads from Watershed 2 to be 157.5 lb/ac/yr (177 kg/ha/yr), 4.5 lb/ac/yr (5.06 kg/ha/yr), 0.027 lb/ac/yr (0.03 kg/ha/yr) and 0.0018 lb/ac/yr (0.002 kg/ha/yr), respectively.
The 18-year record at Schubert Watershed provides a unique long-term look at annual variability in nonpoint source constituent loading from a grazed oak woodland watershed. Annual nitrogen loadings from the Schubert Watershed vary by more than an order of magnitude (0.18 to 3.56 lb/ac/yr or 0.2 to 4.0 kg/ha/yr), with a mean value of 1.42 lb/ac/yr (1.6 kg/ha/yr) over the 18-year record (fig. 3). Total nitrogen loads are loosely related to the total runoff for a given year (r2 = 0.48; P = 0.001). Phosphate loadings are exceedingly low (mean = 0.027 lb/ac/yr or 0.03 kg PO4-P/ha/yr) due to the low mobility of phosphorus.
Suspended solids loads ranged from 22 to 414 lb/ac/yr (25 to 465 kg/ha/yr), with a mean value of 148 lb/ac/yr (166 kg/ha/yr). Suspended solids yields greater than 8,900 lb/ac/yr (10,000 kg/ha/yr) are not uncommon from some agricultural lands. The suspended solids loading shows a highly significant relationship with annual runoff (r2 = 0.82; P = 0.001). It is perhaps also strongly regulated by the intensity of the precipitation, the seasonal distribution of precipitation and ground cover as determined by grazing intensity.
Implications for monitoring
An understanding of the inherent pattern of stream flow and pollutant concentrations is critical for developing an effective plan to monitor water quality. Our work shows that temporal variability of nonpoint source constituent concentrations from annual rangeland watersheds is large and occurs at the storm event, seasonal (within year) and interannual (between year) time scales. Monitoring objectives often include compliance monitoring, detecting the effect of improved land-use management and determining contributions from various activities in a watershed. Our data illustrate that the timing and frequency of sampling from the storm to the annual time scale play an extremely significant role in determining the ability of monitoring to meet any of these objectives.
For instance, one might determine that there is a serious nitrate problem by sampling during the first storm event of a water year (late fall-early winter), when nitrate concentrations are highest. In contrast, one could conclude that there is no nitrate problem by sampling during late spring. With regard to suspended solids, one might conclude that there is no problem by sampling only during low flow. However, by sampling only during peak flows, one could overestimate solids concentrations.
It is important to consider that loading rather than just the concentration of a constituent is the most appropriate measure of nonpoint source pollution. Load takes into account both the concentration of a constituent and the volume of water associated with the constituent concentration. The order of magnitude differences in annual nitrogen loads from the Schubert Watershed suggest that several years of data are required to obtain an adequate representation of nonpoint source pollution from a watershed. One year, even several years, of data are often not enough to distinguish confounding temporal and weather influences from the real impact of land use or BMPs. In most instances, paired watershed studies with control watersheds are the only means to distinguish weather from treatment effect. At a minimum, significant and consistently collected data both before and after a specified treatment are required to document the causal relationship between water-quality parameters and management changes.

By sampling water only during the first storm of the year, when nitrate concentrations are highest, one might mistakenly conclude there is a serious nitrate problem.
Our studies of water quality on annual rangelands in Northern California suggest that a minimum sampling strategy should include before-, during- and after-storm event samples to characterize variability associated with the rising and falling limbs of the storm hydrograph. Storm event sampling is extremely important because the majority of the annual water flow and nonpoint source constituent loadings occur during the four to six major storm events each year. Samples should be stratified seasonally to capture the large seasonal variability associated with the Mediterranean climate. Samples must be collected over a period of several years to account for interannual variability. Stream discharge must be measured for the purpose of calculating annual loadings. Timing is everything when it comes to designing a proper water-quality monitoring program.

The timing and frequency of water sampling is important to accurately assess the impacts of grazing and range management on water quality. Water quality varies between storms, seasons and tears.
Timing, frequency of sampling affect accuracy of water-quality monitoring

