


All Issues
Ice creams and frozen yogurts vary widely in key nutrients
Publication Information
California Agriculture 51(2):36-40. https://doi.org/10.3733/ca.v051n02p36
Published March 01, 1997
PDF | Citation | Permissions
Abstract
The combined forces of consumer demand, nutritional labeling requirements and product innovation have led to a range of frozen dairy desserts that vary significantly in several nutrients highlighted on the nutritional label. Ice creams and yogurts available in California were surveyed in 1995 for nutrient content. Ice creams varied from 70 to 270 calories and from 0 to 18 grams of fat per half-cup serving. Two ice cream products met the Food and Drug Administration's definition for a “good source” of vitamin A, providing 10% or more of the Recommended Daily Value of the nutrient, and 21 were “good sources” of calcium. While no frozen yogurts met the requirement for a good source of vitamin A, 10 were good sources of calcium.
Full text

Scientists compared the nutrient content of 69 vanilla-flavored ice creams and frozen yogurts.
The Nutritional Labeling and Education Act (NLEA) of 1990 led to modifications in the legal requirements for minimum levels of milk solids and fat in frozen dairy desserts. Prior to NLEA implementation, state and federal regulations defined ice cream as containing 10% milk solids and 10% milkfat and weighing at least 4.5 pounds per gallon. Ice milk — the lower milkfat, lower-cost frozen dessert that was available for decades — was required to contain between 2% and 7% milkfat and at least 11% milk solids. Those products not meeting the definitions for ice cream or ice milk were labeled “frozen dairy dessert.” California regulations specified that frozen yogurt must contain 3.5% milkfat, weigh 4.0 pounds per gallon, and meet a specified total acidity.
Under today's standards, products labeled “ice cream” or “frozen yogurt” must still meet the same minimum requirements for milkfat and solids, except that products with lower fat levels can also be called ice cream or frozen yogurt as long as they meet federal NLEA labeling guidelines. A product labeled “low fat” must have 3 grams fat or less per serving, a “light” product must have one-third less fat than the standard product, a “reduced fat” product must have 25% less fat than the standard product, and a “nonfat” product must have 0.5 gram fat or less per serving. Standards for ice milk, which is no longer on the market, were abolished in 1995.
Manufacturing a lower milkfat product that meets consumer expectations for flavor and texture is a challenge. Milkfat gives frozen dairy products richness and promotes desirable textural qualities known as “mouth-feel.” It also contributes its own flavor and is a good carrier and synergist for added flavor compounds. In making products with reduced milkfat, frozendessert manufacturers must do more than just substitute milk for cream. Other ingredients in the formula are varied to achieve the desired flavor, body and texture.
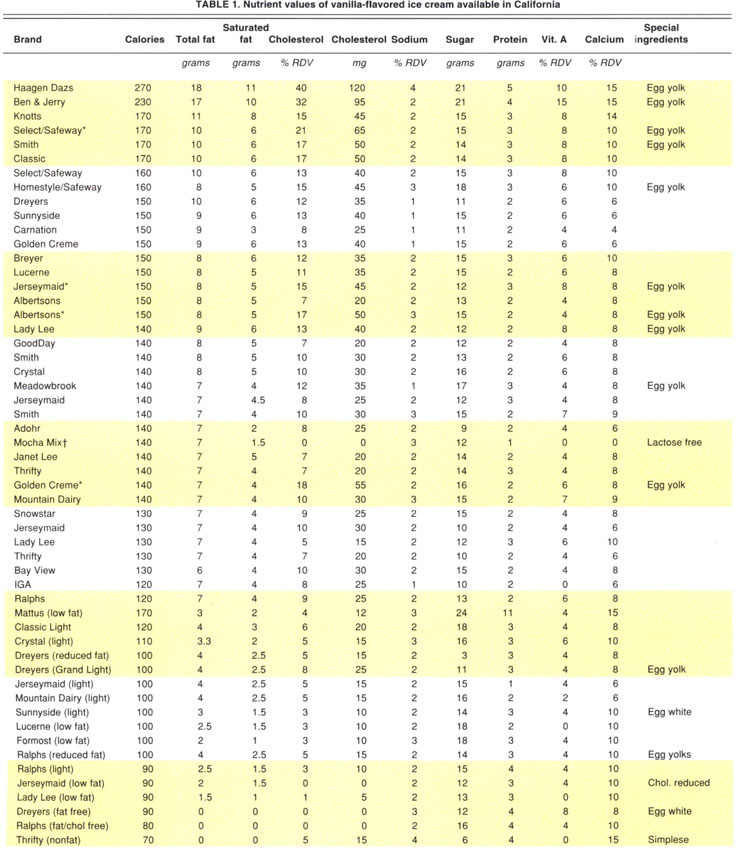
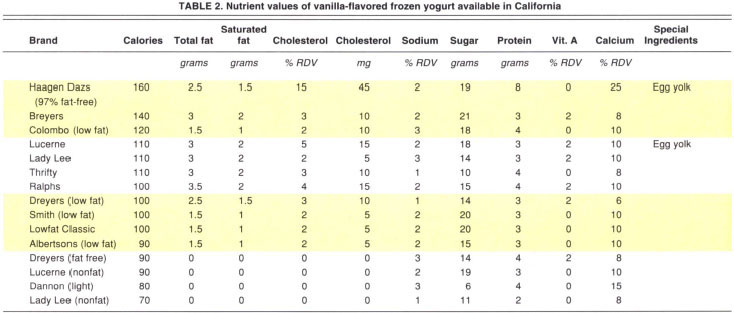
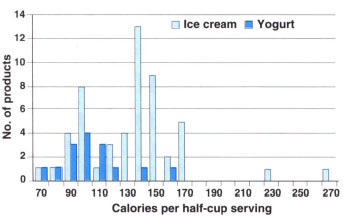
Fig. 1. Calorie content of vanilla-flavored ice creams (n = 54) and frozen yogurts (n = 15) available in California.
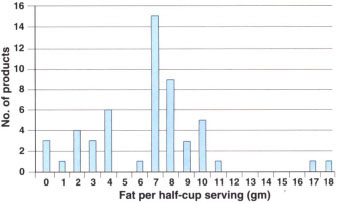
Fig. 2. Milkfat content of vanilla-flavored ice creams (n = 54) available in California. “Lew fat” has 3 grams of fat or less per serving.

Fig. 3. Vitamin A content of vanilla-flavored ice creams (n = 54) available in California. The Food and Drug Administration defines a food providing 10% or more of the Recommended Daily Value of a nutrient as a “good source.”
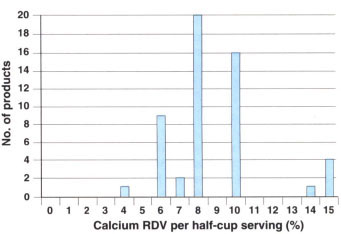
Fig. 4. Calcium content of vanilla-flavored ice creams (n = 54) available in California. The Food and Drug Administration defines a food providing 10% or more of the Recommended Daily Value of a nutrient as a “good source.”
Milk solids, for example, contribute to good body and smoothness in ice cream. They contain 36.7% protein, 55.5% lactose and 7.8% minerals. Sugar, in addition to providing sweetness, affects the viscosity of frozen desserts and improves the body and texture of the frozen product by lowering its freezing point. Corn syrup is frequently used because it is less expensive than sugar and provides a smooth texture and good body. Stabilizers, such as guar gum or microcrystalline cellulose, improve smoothness, help prevent ice crystal formation during storage, help the product resist melting and improve handling properties. Mono- or diglycerides are commonly used in ice cream to improve whippability and give it desirable properties in the freezer.
Frozen-dessert manufacturers have responded to the new NLEA labeling regulations by offering consumers a range of lower-fat products. In 1995, we surveyed supermarkets throughout California to record ice cream and frozen yogurt nutrient composition as presented on the “Nutrition Facts” label (tables 1 and 2). Although the survey does not include every product available in the state, the 69 products recorded represent the breadth available to the consumer. Vanilla-flavored ice cream and frozen yogurt were chosen as the standard for comparison to eliminate variation due to fat-containing flavorings, such as chocolate or nuts, or the higher sugar content of fruit flavors.
Ice creams vary in content
Ice creams varied significantly in total fat content, calories and other nutrients reported on the Nutrition Facts label (table 1). Many manufacturers produce more than one product to meet consumer preferences. Calories ranged from 120 to 270 per half-cup serving for regular ice creams and 70 to 170 for lower-fat variations. A caloric value of 140 per half-cup serving was the most common in the marketplace, while the highest values (230 and 270 calories) were found in the high-milkfat ice creams often called “super premiums” (fig. 1).
Standard ice cream products varied in fat content from 7 to 18 grams per half-cup serving. Lower-milkfat ice creams ranged from 0 to 4 grams fat per serving. Ice cream with 7 grams fat per serving was the most common, while three brands offered a zero-fat product (fig. 2).
The NLEA provides that food may be labeled as a “good source” of vitamin A or calcium if one serving provides 10% or more of the Recommended Daily Value (RDV). The vitamin A content of ice cream ranged from 0 to 15% RDV per serving, with high-fat products generally having higher values. Most ice creams provided 4% of the RDV for vitamin A, and only two products could be considered good sources of this nutrient (fig. 3).
Since ice cream contains milk solids, it can be an important source of calcium. Although most ice creams contained 8% of the RDV for calcium, 21 products contained 10% or more and could therefore be considered good calcium sources (fig. 4). Ice creams with higher milkfat (“super premiums”) also contained more milk solids and provided 15% of the RDV for calcium. Lower-fat products contained from 6 to 10% of the RDV for calcium, and fat-free products contained from 8 to 15% of the RDV. The nondairy Mocha Mix had as many calories and as much fat as many brands of ice cream, but it contained no calcium and no vitamin A.
The cholesterol contents of ice creams ranged from 0 to 40% of the RDV per serving, with most falling in the 5 to 10% range (fig. 5). Four products claimed no cholesterol on the label, which is permitted under NLEA guidelines for foods that contain 2 mg or less of cholesterol per serving and meet other criteria related to total and saturated fat. The highest cholesterol levels were found in those products that contained egg yolks, some of which also contained up to 4% of the RDV for iron.
Ice cream was not a significant source of sodium. A half-cup serving provided from 1 to 4% of the RDV. Similarly, it was not a major source of protein, with most ice creams providing 2 to 3 grams per serving.
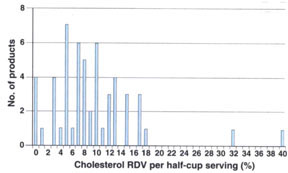
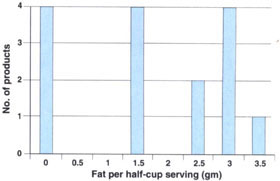
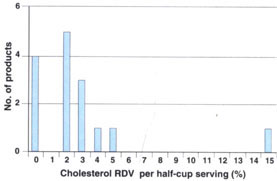

Fig. 8. Calcium content of vanilla-flavored frozen yogurts (n = 15) available in California. The Food and Drug Administration defines a food providing 10% or more of the Recommended Daily Value of a nutrient as a “good source.”
Frozen yogurts
Frozen yogurts had less fat than ice cream, as the regulations require (table 2). Fat contents of regular frozen yogurts ranged from 3 to 3.5 grams of per serving, while low-fat yogurts ranged from 1.5 to 2.5 grams of fat, and nonfat yogurts contained 0 fat (fig. 6). Four frozen yogurt products on the market were nonfat. Cholesterol contents ranged from 0 to 15% of the RDV, with most products having 2% of the RDV for cholesterol (fig. 7). Calories per half-cup serving ranged from 100 to 160 for regular frozen yogurts and 70 to 100 for the lower-fat products (fig. 1). Calcium contents ranged from 6 to 25% of the RDV, with 10 products qualifying as a “good source” of calcium (fig. 8). Vitamin A contents ranged from 0 to 2% of the RDV. No frozen yogurt met the requirements of a “good source” of vitamin A.

Frozen yogurt was not a significant source of sodium, with most products providing 2 to 3% of the RDV. Most frozen yogurts provided 3 to 4 grams of protein per serving, although one brand that used a lot of milk solids contained 8 grams of protein.
Consumers have many choices
The survey demonstrated that consumers may select from a range of frozen dairy desserts that offer varying amounts of specific nutrients. These products also provide phosphorus, riboflavin and other important nutrients that are not part of the mandatory nutrition label. Manufacturers continue to modify their formulations to meet consumer preferences for flavor and nutritional composition. Consumer research has repeatedly demonstrated that taste is the primary factor in repeat purchase. Product taste is influenced by fat content, percentage of milk solids and quality and quantity of flavoring and other ingredients. Consumers can use the nutritional label and product taste to find the combination of flavor and nutrients that best fits their preference.
Ice creams and frozen yogurts vary widely in key nutrients

