


All Issues
Hedgerows use more water, but increase efficiency, profit in young walnuts
Publication Information
California Agriculture 49(4):24-28. https://doi.org/10.3733/ca.v049n04p24
Published July 01, 1995
PDF | Citation | Permissions
Abstract
Total water use was 18.8% greater for hedgerow plantings of walnut trees than for conventionally spaced trees during years 2 through 7 of this study. Cumulative yield-and revenue-water use efficiencies were much greater with the hedgerows through year 5, but differences narrowed there-after. The hedgerows had greater total yield, but lower crop value due to smaller nuts. Although individual nut weight was strongly correlated with nut load, the relationship between nut weight and nut density was independent of tree spacing. Total gross and net hedgerow revenues were greater.
Full text
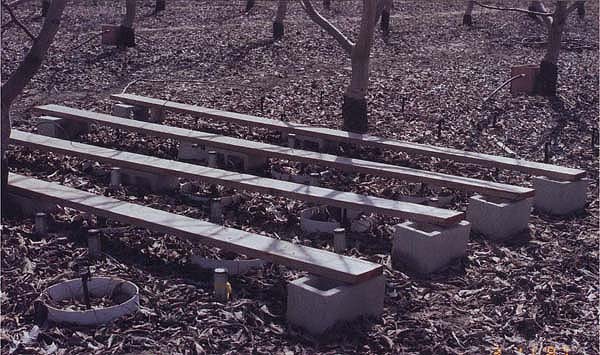
Neutron probe access tubes in hedgerows were used to assess changes in soil water content. Drip emitters in the monitored root zone quadrant were located on stakes and surrounded by rings to limit overland flow. Boards facilitated access to tubes for data collection.
High-density plantings of walnut trees configured as hedgerows offer the possibility of higher yields during the early years of an orchard, yields that are not achieved until several years later with conventionally spaced plantings. The use of mechanical rather than hand pruning once the hedgerows have reached adequate size offers an additional economic benefit. However, increasing the number of trees per acre results in faster orchard canopy development, which increases per-acre water loss through the leaves (transpiration) and to a lesser extent reduces surface evaporation due to increased orchard floor shading. As the cost of water increases and availability becomes less certain, knowledge of water use requirements of different planting densities is necessary for growers to make informed orchard-design decisions.
We conducted a study to determine orchard water use rates from planting to orchard maturity in a hedgerow planting and in a conventional-density planting. We also established relationships between water use, nut production, and crop revenue during the early years of orchard development in order to determine whether the presumed increase in orchard water use in hedgerows is justifiable.
Hedgerow, conventional plantings
An experimental orchard established at the Kearney Agricultural Center consisted of two 1.25-acre blocks, one with 11-feet-by-22-feet “hedgerow” spaced trees (180 trees per acre) and the other with 22-feet-by-22-feet “conventional” spacing (90 trees per acre). ‘Chico’ was the primary cultivar, with 5.5% and 11.1% ‘Ashley’ pollinizers for the hedgerow and conventional spacings, respectively. The field was fumigated with methyl bromide before planting. Microsprinklers were used for irrigation; they were placed 5.5 feet from each tree in the tree row. Each microsprinkler applied 5.4 gallons per hour over a circular area 9 feet in diameter. The system was operated two or three times a week.

Mari Carmen Ruiz-Sanchez and Don Katayama count shaded squares on tarp placed beneath conventionally spaced tree to determine orchard floor shaded area.
We initially estimated irrigation amounts based on published crop coefficients (Kc's) developed for other deciduous trees; California Irrigation Management Information System (CIMIS) reference crop water use (ETo), determined from data collected from a nearby weather station; and measured application efficiency (95%). Irrigation amounts were adjusted according to canopy size, using orchard floor shaded area measurements determined by counting shaded squares within a grid drawn on a tarp placed beneath measured trees. A relation-ship developed for almonds between shaded area and percent of maximum orchard water use was also used. We used the almond relationship as a first approximation because no similar data exists for walnuts. Water application was measured with water meters.
We estimated orchard water use (sum of evaporation from the soil surface and transpiration from the leaves, expressed as ETc) using the following water balance technique:
ETc = Applied water + Effective rainfall −+ Soil water storage - Deep percolation
Two trees of normal size and vigor in each block were used to estimate ETc. Soil water storage was measured by installing 15 neutron probe access tubes (electrical metal tubing) to a depth of 10 feet in the southwest quadrant of each tree. The tube array was designed to accurately characterize three-dimensional changes in soil water content. The location of each tube relative to its neighbors was used to partition the root zone, and the data from each tube was weighted accordingly. Weekly measurements in 1-foot increments were made to assess three-dimensional changes in soil water storage. If these measurements indicated significant consistent drying in the wetted profile, additional irrigation was applied.
The usefulness of the water balance depends on the accuracy of measurement of each component of the balance. Slight shifts in the micro-sprinkler spray pattern distribution due to even light wind creates uncertainty in the amount of applied water in the measured tree quadrants. Therefore we replaced the microsprinklers on the measured trees after year 2 with an array of drip emitters that were not disturbed by wind, cumulatively applied water at the same rate as the microsprinklers, and wetted the same surface area.
Deep percolation was calculated by first determining the relationship between water flux (soil hydraulic conductivity assuming unit hydraulic gradient) and soil water content. This was accomplished with a winter study in which sites adjacent to each measured tree were flooded for 10 days to wet the profile, covered with plastic sheets to prevent surface evaporation and rain entry, and then monitored periodically with a neutron probe in 6-inch-depth increments to determine soil water distribution. Differences in soil water content were used to calculate the flux of water across specific depths. These fluxes (which decreased with time) were correlated with the mean soil water content at the specific depths (which also decreased with time) to establish the functional relationship between the two parameters.
Over the approximately 60 days that the winter study was conducted, there wasn't enough change in soil water content at the lower depths to establish functional relationships between flux and soil moisture. Adequate relationships were possible at the 5-feet depth, below which few if any roots were visible in backhoe pits. Therefore we assumed that the root zone was 5 feet and calculated the weekly flux of water across this depth (deep percolation) during the season using the measured soil water content and the previously described functional relationships between soil mois-ture content and flux.
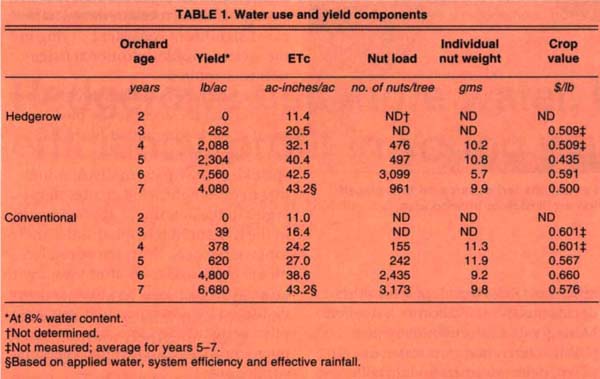
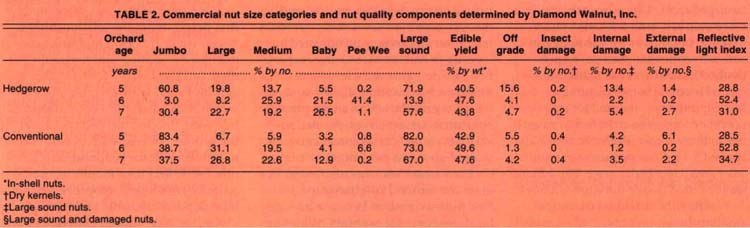
TABLE 2. Commercial nut size categories and nut quality components determined by Diamond Walnut, Inc.
ETc measurements began in late March and continued until late October. During this time relatively little rain fell, but what did fall was considered as “effective” in the water balance equation.
The conventional block was trained using a modified central leader strategy. The objective was to build a canopy with three primary scaffolds; vertical growth was emphasized in the early years. With the hedgerows, lateral growth in the tree row rather than vertical growth was the goal; this was accomplished by leaving five primary scaffolds. In the first 3 years both blocks were hand pruned according to the philosophies just described. At the end of the fourth year, mechanical pruning began for the hedgerows; they were side-hedged on one side of the tree about 3.5 feet from the trunk and topped at about 14 feet. In year 5 and subsequently, the hedgerows were side-hedged on the opposite side of the tree from the previous year and were not topped. The conventional planting was hand pruned each year by removing half of the past season's growth from each shoot.
The trees were hand harvested in years 2 and 3 and mechanically in subsequent years. Nut samples were taken beginning in year 4 and commercially analyzed for size, quality and value by Diamond Walnut, Inc.
Canopy development
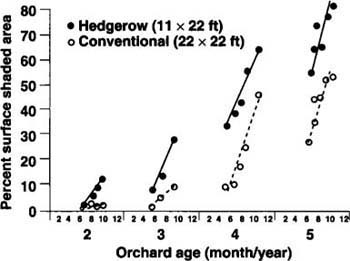
The hedgerows developed faster than the conventionally spaced trees (fig. 1). Maximum hedgerow orchard floor shaded area was 14.8, 44.0, 65.1 and 72.3% for years 2 through 5, compared with 5.0, 18.0, 35.5 and 65.1% for the conventionally spaced trees. These differences were due not only to the number of trees per acre but also to the pruning used to achieve desired tree architecture. The modified central leader training system for the conventional trees required severe pruning through year 3, while the hedgerows were minimally pruned. Thus the rate of canopy development (the slope of the curves in fig. 1) was much greater for the hedgerows. Canopy development rates for years 4 and 5 were similar for each spacing, reflecting less pruning in the conventional planting once the central leader was established.
Water use
Although hedgerow ETc was greater than for the conventional spacing through the first 6 years, the magnitude of the difference (about 30 inches) was much less than expected based on tree number and canopy development (table 1). ETc depends on evaporative demand, canopy size, wetted surface area and irrigation frequency. During years 2 and 3, hedgerow floor shading was 2 to 5 times greater than for the conventional spacing, but ETc was only slightly higher. This can be explained by greater advective energy (sensible heat) transfer from the relatively large dry orchard floor areas to the canopies in the conventional spacing, thereby increasing transpiration. Also, the small canopies meant that a greater percentage of the wetted surface area in the low-density trees was exposed to direct sunlight, thereby increasing surface evaporation, the other component of ETc. These two factors resulted in greater ETc per tree for the conventionally spaced trees than for the hedgerows, although ETc was lower when expressed on a per-acre basis because of the lower number of trees.
Yield
The two primary walnut yield components are nut load and size. Through year 5, average hedgerow yield was four times greater than yield from the conventional planting, due mostly to high nut loads (table 1). This is not surprising, since so much fruitwood was pruned in the conventional planting in order to achieve the modified central leader, the desired tree structure. By year 6 the hedgerow yields were about 1.5 times the conventional yield, but individual nut size was much smaller. By year 7 conventional yields were about 50% greater than hedgerow yields. This narrowing and reversal of yields was due to more equal canopy development and presumably to alternate bearing in the hedgerows (year 8 hedgerow yield was 8,406 lb/acre, more than twice year 7; data for year 8 is not included in the tables because we did not measure ETc for that year).

Color infrared image of experimental orchard taken in year 4. Hedgerows are at left and conventionally spaced trees at right, where irrigation wetting pattern is also visible.
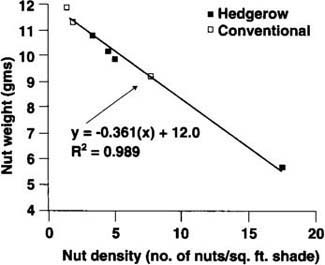
Fig. 3. Relationship between individual nut weight and fruiting density (shaded area measured in late July). No data for conventional year 7.
Commercial processor analysis also shows a dramatic drop in nut size for the hedgerows in year 6. The previous year, the yield of 2,304 lb/ac resulted in 80.6% of the crop in the Jumbo and Large categories (table 2). However, in the 6-year-old hedgerows these large nut sizes comprised only 11.2% of the crop (7,560 lb/ac). On the other hand, in year 7 the conventional-density trees supported a similar size yield (6,680 lb/ac) but had 64.3% large-size nuts. Is there some factor related to the hedgerow planting that results in small nuts?
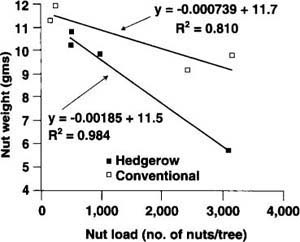
Figure 2 shows the relationship between nut size (represented as individual nut weight) and nut load. Linear expressions with nearly identical y-axis intercepts but different slopes adequately describe each relationship. Thus, for equivalent nut loads, hedgerows clearly have smaller nuts.
Although nut size can be influenced by nut load, it is more directly related to fruiting density. This can be thought of as the amount of support available per nut from the photosyn-thesis factory, which can be approximated as the nuts per unit area of shaded orchard floor. When expressed on this basis, there is a strong (R2 of 0.989) linear relationship between individual nut weight and nut density that is independent of tree spacing (fig. 3). Thus, the smaller nut size observed in hedgerows is due only to “over cropping” and would also occur with conventional spacing if nut density were allowed to be high. The higher hedgerow tree density (in this study, twice as many trees per acre) requires lower cropping levels on a per-tree basis for good-size nuts.
Crop value and revenue
The value of the nuts depends on size, percent kernel, kernel color, and insect and disease damage. Table 2 shows the commercial parameters used to quantify these factors. Smaller nut size and resulting lower edible yield in the hedgerows was the primary factor in lower crop value, expressed as dollars per pound (table 1). Higher off-grade and internal damage (table 2) also contributed to lower value.
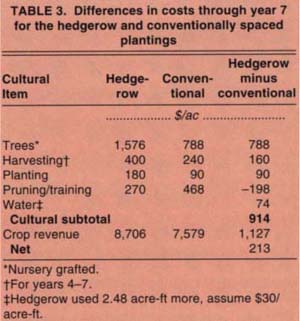
Revenue is determined by yield and crop value. Because crop value was determined only for years 5 through 7, even though there were modest yields in years 3 through 5, we used average crop values for these early years in order to estimate cumulative orchard revenue. Through year 7, the hedgerows yielded about 3,800 lb/ac more; and although crop value was somewhat lower, total revenue was $1,127/ac greater than for the conventional spacing. This higher revenue must be weighed against the cost of the additional trees; increased water, planting and harvesting costs; and lower pruning costs. Considering these factors, total net revenue was $213/ac greater for the hedgerows (table 3).
Water use efficiency
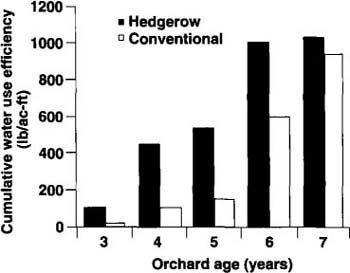
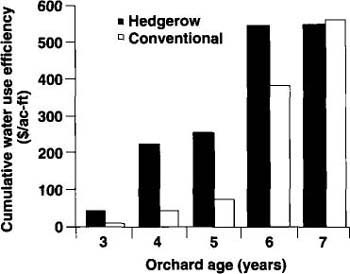
Cumulative water use (years 2 through 7) was 2.48 ac-ft/ac more with the hedgerows. Yield-water use efficiency (pounds of nuts per acre-feet water use) was much greater with the hedgerows through year 6, but the difference narrowed in year 7 (fig. 4). Somewhat smaller differences occurred with revenue-water use efficiency in the early years, and by year 7 cumulative revenue-water use efficiency was slightly greater with the conventional spacing (fig. 5). By year 6, yield-water use efficiency clearly was similar for both planting densities.
Conclusions
Water use (ETc) was greater in the early years of the hedgerow planting due both to the number of trees per acre and to more rapid canopy development. Cumulative hedgerow water use (years 2 through 7) was about 2.5 ac-ft/ac (18.8%) greater than with the conventional spacing. This is much less than would be anticipated based on tree density and faster canopy development. Indeed, ETc was greater in the conventional planting on a per-tree basis each year due to advective energy transport to the canopies and greater surface evaporation.
Higher nut yields in the hedgerows were accompanied by smaller nuts. Individual nut weight was strongly correlated with nut load, with different relationships for each planting density. However, the relationship between nut weight and nut density (nuts/unit shaded orchard floor area) was independent of tree spacing. This indicates that hedgerows require lower nut loads on a per-tree basis for production of good-size nuts. Smaller nut size due to heavy cropping with the hedgerows reduced crop value. However, cumulative crop revenue through year 7 was about $1,100/ac greater with the hedgerows. Higher hedgerow tree, planting, harvesting and water costs outweighed pruning cost savings and reduced total net revenue differences through year 7 to about $200/ac in favor of the hedgerows. Cumulative yield-and revenue-water use efficiencies were much greater through year 6 with the hedgerows, but narrowed thereafter.
Hedgerows use more water, but increase efficiency, profit in young walnuts

