


All Issues
Drip irrigation controls soil salinity under row crops
Publication Information
California Agriculture 49(4):19-23. https://doi.org/10.3733/ca.v049n04p19
Published July 01, 1995
PDF | Citation | Permissions
Abstract
Keeping soil salinity low in the root zone is crucial to growers of salt-sensitive crops. This study investigated patterns of soil salinity under surface and subsurface drip irrigation. High soil salinity occurred midway between drip laterals for both irrigation methods and above the drip tape for subsurface drip irrigation. Rainfall leached the salts from the zones of high salinity for both irrigation methods.
Full text
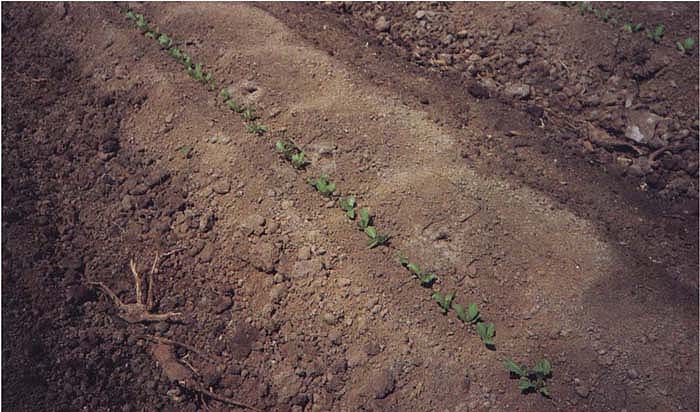
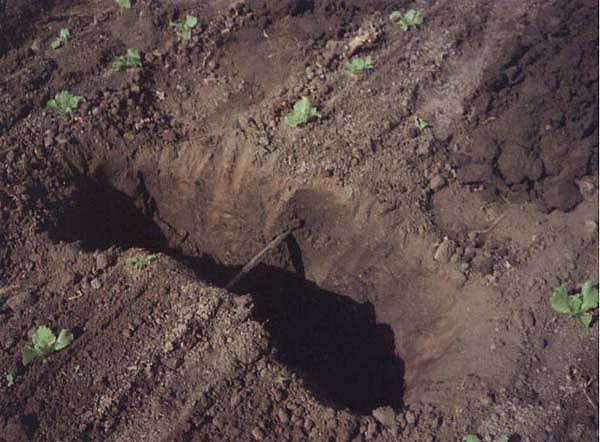
Salt accumulatlon is apparent in the white lines on the soil surface along row crops irrigated with subsurface drip. Salts above the drip tape are driven toward the surface, whereas salts below the tape continue to move down.
Drip irrigation of row crops is increasing in California's coastal valleys and along the west side of the San Joaquin Valley. In some coastal areas, the salinity of the irrigation water exceeds 1 decisiemen per meter (dS/m). Because salt-sensitive and moderately salt-sensitive crops such as lettuce, broccoli, cauliflower, tomatoes, onions, celery, garlic and strawberries are grown in these areas, salinity management is necessary to prevent yield reductions.
Surface drip irrigation
A number of studies have been conducted on soil salinity under surface drip irrigation. Researchers at the U.S. Salinity Laboratory investigated salt distributions under a traveling trickle irrigation system before and after simulated rainfall. The irrigation water salinity was 2.2 dS/m. Water was applied at rates to provide leaching fractions of 5%, 10% and 25%. Results showed that before the rainfall, soil salinity was low near the drip laterals and high near the soil surface midway between laterals (fig. 1, leaching fractions of 5% and 25%). The zone of low salinity was the largest for the highest leaching fraction and the smallest for the lowest leaching fraction. Small changes in soil salinity occurred with depth below the lateral for all three leaching fractions. Midway between laterals, salinity rapidly decreased with depth for the top 6 inches (15 cm), and then gradually decreased with depth. After 1.2 inches (3 cm) of simulated rainfall, soil salinity decreased near the soil surface midway between laterals (fig. 1). The initially high salt concentrations near the surface were driven downward by the rainfall. Changes in soil salinity caused by rainfall near the emitter were small.
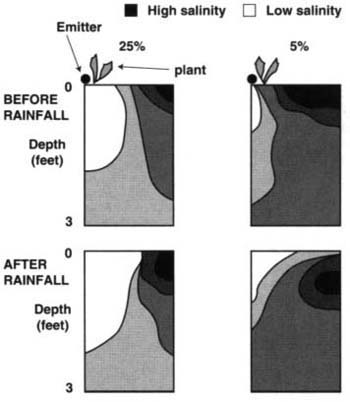
Fig. 1. Salt patterns under surface drip irrigation before and after rainfall for leaching fractions of 5% and 25%.
Another research project, conducted in Israel, studied root distributions with respect to soil salinity under surface drip irrigation for row crops. This study showed patterns of soil salinity similar to those in figure 1. Maximum soil salinity near the soil surface occurred at about 8 inches (20 cm) from the emitter. However, maximum root density occurred near the emitter, where soil salinity was the lowest.


Another Israeli project studied salt and water distributions under surface drip irrigation for lateral spacings of 39 and 79 inches (100 and 200 cm). Water applications were 75% and 100% of the amount applied to an adjacent sprinkler-irrigated plot. Soil type was a loam. The 39-inch spacing was one lateral per cotton row (plant row spacing was 39 inches); the 79-inch spacing was one lateral every second row.
Again, the results showed salt patterns similar to those in figure 1. Salt accumulation occurred above the 12-inch (30 cm) depth for all treatments except near the emitters. Below 12 inches, little change in soil salinity occurred with depth. However, near-surface soil salinity between laterals of the 39-inch spacing was three to four times higher than that of the 79-inch spacing. Both soil water content and soil salinity data showed that leaching was occurring below the emitters for the 100% water treatment. The maximum depth of salt and water movement under the emitter was about 39 inches for the 75% treatment.
Subsurface drip irrigation
Sampling in Santa Maria Valley
A literature review revealed little information on salt patterns for subsurface or buried drip irrigation of row crops under field conditions. For this study, we sampled two locations in the Santa Maria Valley to determine the patterns and magnitudes of soil salinity under drip irrigation of vegetables. Sampling occurred over about 12 months to evaluate changes in the distributions. Soil types were a clay loam and a fine sand.
We took samples in the clay loam soil during stand establishment of a lettuce crop (August 1992), just before harvest (October 1992), after a winter of rainfall (March 1993), and after the following lettuce crop (September 1993). Samples were taken in a grid across the bed perpendicular to the drip tape. During the September sampling, we also took samples parallel to the drip tape. Cauliflower was grown at the fine-sand site. Sampling in the fine sand was done on the same dates as for the clay loam, with no regard to stage of growth.
The salinity of the irrigation water at the clay loam site was 2.5 dS/m; at the fine-sand site it was 2.2 dS/m. Depth of the drip tape was 5 inches (13 cm). Bed and lateral spacing was 38 inches (96 cm). Emitter spacing was 12 inches (30 cm). Two plant rows per bed were used for the lettuce, and one plant row per bed for cauliflower. Due to the difficulty of measuring flow rates, we did not measure the water applied to each field.
Salinity low near tape
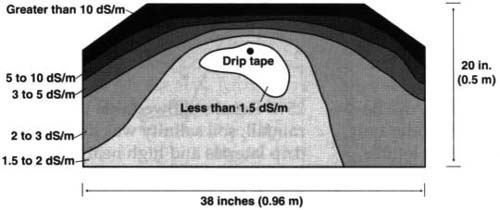
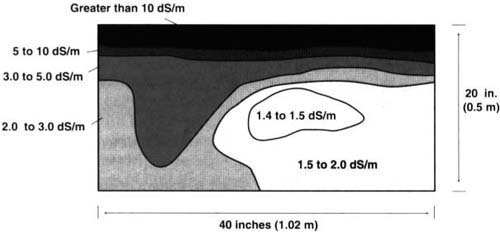
In August 1992, soil salinity near the drip tape was less than 1.5 dS/m at the clay loam site (fig. 2). Soil salinity ranged between 1.5 and 2.0 dS/m through-out the soil profile at depths below the drip tape except near the edge of the bed. At horizontal distances less than about 6 inches (15 cm) from the drip tape and at the depth of the tape, soil salinity changed slightly with distance from the tape. Beyond 6 inches, soil salinity increased considerably, particularly near the edge of the bed. Soil salinity increased rapidly above the drip tape as depth decreased, and was highest near the soil surface. This pattern of very high salinity occurred across the bed, where salinity exceeded 5 dS/m. The depth interval of the high-salinity zone was smallest directly above the drip tape and largest near the furrow.
The soil salinity near the drip tape was less than 1.5 dS/m, which is less than the salinity of the irrigation water. This is a consequence of the standard method used to measure soil salinity. Soil samples are dried and ground, then distilled water is added to make a saturated paste. The salinity of the extract of the saturated paste is the measure of soil salinity. Because of the dilution effect, the salinity of the extract can be less than the salinity of the irrigation water under high-frequency irrigation if the soil sample is taken close to the water source.
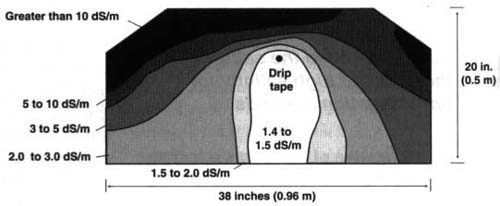
We found a similar pattern of soil salinity for the October 1992 sampling, except that salinity levels were higher in the vicinity of the drip tape (fig. 3). The soil salinity of the soil profile within 6 inches (15 cm) of the drip tape was between 2.0 and 2.5 dS/m, compared to between 1.0 and 1.5 dS/m for the August sampling. The reasons for this increase are not clear, but it may reflect either a soil salinity still increasing toward an equilibrium value or a decrease in the leaching fraction compared to the earlier crop. Soil salinity near the soil surface had also increased. Soil salinity of the depth interval that earlier was between 3 and 5 dS/m was now between 5 and 10 dS/m.
Differences in sample processing can cause variations in soil salinity monitored over time. Saturation percentages that differ considerably (more than 7 to 10%) between sampling dates could account for some of the salinity differences with time. Average saturation percentages, however, ranged between 33.6 and 34.2, indicating that salinity differences with time were unaffected by sample processing.
These salinity patterns show that no leaching of salts occurred above the drip tape during irrigation, as expected. Salt in the water flowing upward above the drip tape, in response to evapotranspiration, accumulated in the top 2 to 3 inches (5 to 8 cm). Near and below the drip tape, leaching was considerable compared to the rest of the root zone as indicated by the low soil salinity and small changes with depth. As horizontal distance from the drip tape increased less leaching occurred, and consequently high soil salinity occurred near the edge of the bed and beneath the furrow. Similar patterns and magnitudes were found at the fine-sand site.
In March 1993, after nearly 14 inches (35 cm) of winter rainfall, the salinity near the surface was reduced considerably (fig. 4). Uniform salinity was found throughout the soil profile, except under the furrow, where soil salinity was higher. Interestingly, soil salinity near the drip tape was similar to that shown in figure 3, suggesting little leaching from rainfall. However, these salinity levels may reflect the downward movement and dispersion of the near-surface salts due to multiple rainfall events. The higher soil salinity under the furrow suggests less leaching compared to the rest of the profile. This may be due to furrow compaction from wheel traffic (observed during sampling), which may have resulted in surface runoff of rainfall.
A different behavior was found at the fine-sand site for the March samples (not shown). Soil salinity throughout most of the soil profile generally was between 1 and 1.5 dS/m. Under the furrows, soil salinity ranged between about 0.4 and 0.6 dS/m. Infiltration of water from rain-fall ponding in the furrow may have caused lower salinity under the furrow than elsewhere in the profile.
In September 1993 the salt pattern shown in figure 5 occurred at the clay loam site. After one crop season, salinity had again increased to very high levels near the soil surface. Salinity in the vicinity of the drip tape was similar to that in figure 2. Near and below the drip tape, soil salinity decreased compared to the March salinity. This indicates that leaching from the drip irrigation occurred during this crop season. By September 1993 near-surface soil salinity increased at the fine-sand site to levels exceeding 6 dS/m. Salinity under the furrows also increased. However, soil salinity in the fine-sand near and below the drip tape changed little from the March levels.
Figure 6 shows a uniform salt pattern near the surface with distance along the lateral. No pattern reflecting salt accumulation midway between emitters was found. This probably reflects the small emitter and plant spacings. Similar behavior was found at the fine-sand site.
Methods of salinity control
Salinity control requires the application of sufficient water during irrigations to leach salts below the root zone. Under subsurface drip irrigation of row crops, wetting patterns during irrigation allow leaching of salts near the drip tape. During irrigation, little leaching occurs midway between laterals, and no leaching occurs above the drip tape. Thus salinity control under drip irrigation requires leaching by rainfall or with another irrigation method, such as sprinkler irrigation, if rainfall is insufficient. The leaching water must leach the salts below the drip tape. Once those salts are carried below the drip tape, irrigations with the drip system continue to move the salts downward. Salts not initially carried below the drip tape accumulate above the drip tape.
Prior to planting, some growers control the salinity above the drip tape by building up the bed and then operating the drip system to carry the accumulated salts up into the built-up bed. The built-up bed is then pushed into the furrow before planting. This approach is justified because most of the very high soil salinity is concentrated in the top 2 to 3 inches (5 to 8 cm) of the soil profile (figs. 2 and 3). The saline soil displaced into the furrow should cause little problem because operation of the drip system prevents those salts from moving laterally toward the drip tape. Little root development of shallow-rooted crops should occur near the edge of the bed and beneath the furrow. Studies of root distribution suggest that little root development may occur beyond 6 to 8 inches (15 to 20 cm) from the drip tape.
One concern is that small amounts of rainfall during the cropping season may move the accumulated salts near the surface down into the part of the root zone with the highest root density. This highly saline soil water could affect crop growth; however, little or no information is available on any potential effect. Some growers operate the drip system during rainfall in an attempt to prevent the downward movement and to dilute the highly saline soil water.
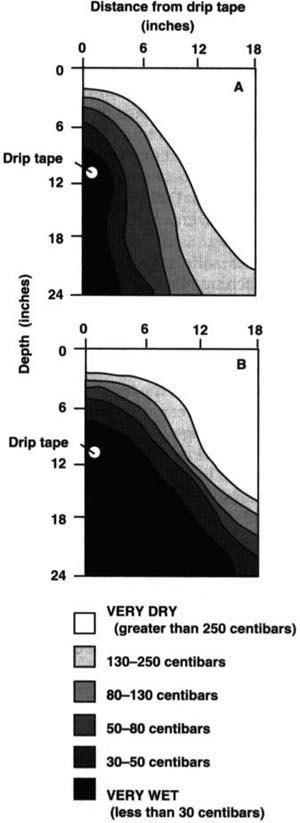
Fig. 7. A. Pattern of soil water content (described by matrix potential) under a leaching fraction nearly equal to zero. B. Pattern of soil water content (described by matrix potential) under a leaching fraction of about 50%.
At one sampling location at the clay loam site, the drip tape was not centered in the bed, but instead was offset to one side. This offset caused the zone of high soil salinity near the furrow of the far side to shift toward the center of the bed. Salinity levels in the soil profile below the plant row on the far side were higher than occurred where the tape was centered between plant rows.
As in surface drip, the higher the leaching fraction, the larger the volume of low-salinity soil in the vicinity of the emitter. Patterns of soil water content, as described by the soil matrix potential, were determined in a tomato field near Davis for a very small leaching fraction (about equal to zero) and for a leaching fraction of about 50%. The smaller the matrix potential, the higher the soil water content. The leaching fractions were calculated using potential evapotranspiration data and amount of water applied to the field. A relatively small volume of very wet soil occurred in the vicinity of and below the emitter for the small leaching fraction (fig. 7a), whereas a much larger volume of very wet soil occurred under the higher leaching fraction (fig. 7b). Soil salinity was not measured at this location, but it would be expected that more leaching would occur around the emitter for the large volume of very wet soil.
Under other irrigation methods, the average root-zone salinity can be related to the leaching fraction and irrigation water salinity. This approach assumes a certain soil-water uptake pattern by the plants. This approach may be difficult to apply under drip irrigation because leaching and thus soil salinity vary greatly throughout the soil profile. Near and below the emitter, actual leaching may be very high, reflected by the low soil salinity. Above the drip tape no leaching occurs, and little leaching may occur near the furrow. Plant uptake of soil water may also be highly variable throughout the profile, reflecting the pattern of soil water. Therefore relating leaching fraction and average root-zone salinity may not be possible. We can only conclude that the higher the leaching fraction, the larger the zone of relatively low-salinity soil around the drip tape. The salinity of this zone reflects that of the irrigation water.
The depth of the drip tape may also be a factor in controlling soil salinity under subsurface drip irrigation. The shallower the tape, the smaller the amount of rainfall or sprinkler-applied water needed to carry the salts below the drip tape. Salts leached below the drip tape continue to be leached by the drip system. Also, the shallower the tape, the more root zone of shallow-rooted crops in the low-salinity soil.
In some coastal areas with salinity problems, growers are under pressure to decrease deep percolation to reduce groundwater contamination from fertilizers leached from the root zone. However, where salinity can affect crop production, some minimum amount of deep percolation is necessary for salinity control. This minimum amount is the leaching fraction needed to prevent any yield reductions. Studies conducted at the U.S. Salinity Laboratory revealed that for surface drip irrigation with an irrigation water salinity of about 2 dS/m, minimum leaching fractions were 26% for lettuce, 17% for cauliflower, 14% for celery and 21% for tomatoes. This means that 14 to 26% of the water applied by drip irrigation should percolate below the root zone to prevent crop yield reductions from excessive soil salinity.
Conclusions, recommendations
The results of this study led to the following conclusions and recommendations for salinity management under drip irrigation of row crops.
The shallower the drip tape, the smaller the amount of rainfall or sprinkler-applied water needed to carry the salts below the drip tape. Also, a shallower tape leaves more root zone of shallow-rooted crops in low-salinity soil.
-
Zones of high soil salinity occur midway between laterals under both surface and subsurface drip irrigation. This could also be a problem along the lateral between emitters, although no such pattern was found at these sites, where the emitter spacing along the lateral was 12 inches (30 cm). Zones of low salinity occur near the drip emitter for both types of drip irrigation. This suggests that salt-sensitive and moderately salt-sensitive crops should be planted as close as possible to the drip lateral to provide a low-salinity environment for the roots. The larger the leaching fraction, the larger the zone of low-salinity soil.
-
Under subsurface drip irrigation, a zone of very high salinity can occur above the drip tape. This is caused by salt accumulation from the evapotranspiration of water flowing upward from the drip tape. This zone of high salinity must be removed for stand establishment of salt-sensitive crops. One method of salinity control includes leaching with rainfall or sprinkler irrigation to move the salts downward below the drip tape. Another method consists of building up the bed, operating the drip system to carry the accumulated salts into the built-up bed, and then removing the built-up soil before planting.
-
Rainfall during the crop season can carry salts accumulated near the soil surface downward into the soil profile. These salts move as a zone of highly concentrated soil water. This zone of salinity may not be a problem under surface drip if the plant row is close to the lateral, since most of the root growth is near the lateral and the high-salinity water is midway between laterals. However, this zone could be a problem under subsurface drip irrigation, where salt accumulation occurs above the drip tape.
-
Leaching fractions of 14 to 26% may be needed under drip irrigation to prevent yield reductions of vegetable crops for an irrigation water with electrical conductivity equal to 2 dS/m. Minimum leaching fractions are less with lower-salinity irrigation water.
Drip irrigation controls soil salinity under row crops

