


All Issues
Before-and-after tests on emitters show organic fertilizers can be injected through low-volume irrigation systems
Publication Information
California Agriculture 46(5):21-23.
Published September 01, 1992
PDF | Citation | Permissions
Abstract
The practice of injecting organic fertilizers into low-volume irrigation systems is not widespread, partly because of concerns that the materials will clog emitters. This study looks at two spray-dried organic fertilizers (fish protein and poultry protein) that were injected through various low-volume irrigation systems, and finds only minimal clogging and even distribution of fertilizer throughout the irrigated area.
Full text
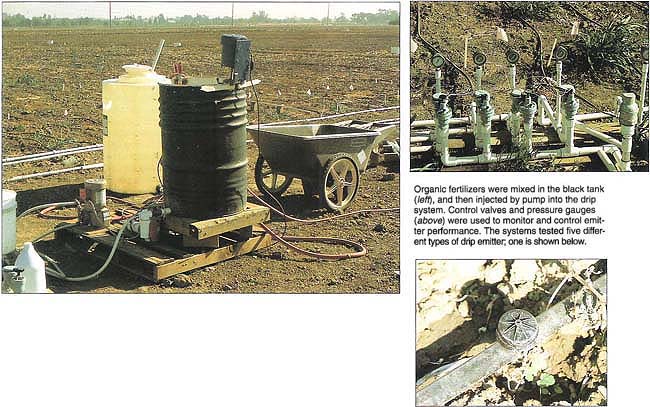
Organic fertilizers were mixed in the black tank (left), and then injected by pump into the drip system. Control valves and pressure gauges (above) were used to monitor and control emitter performance. The systems tested five different types of drip emitter; one is shown below.
Low-volume (drip emitter and micro-sprinkler) irrigation is gaining popularity because it has the potential to conserve water and energy, it is easy to manage and operate, and it has a positive impact on crop yield and quality. Another benefit is its capacity to carry injected fertilizers in the irrigation water, known as ° “fertigation.” When applying fertilizers through the irrigation system, growers can expect more efficient fertilizer use and improved plant response because the plants' nutritional demands are more closely matched throughout the growing season.
Organic growers using low-volume irrigation systems have expressed interest in finding an organic fertilizer that can safely be injected through their irrigation systems. Available organic fertilizers such as fish emulsion frequently clog emitters when used for this purpose. Chilean nitrate (sodium nitrate), an available and affordable nitrogen (N) source, is used by some organic growers, but it has a disadvantage: it adds sodium to the soil. Formulations of sodium nitrate frequently contain as much as 26% sodium. High sodium levels in the soil can result in a dispersed soil that exhibits poor infiltration.
It was suggested to the authors that animal and plant proteins rendered by a process known as “spray-drying” may be suitable for injection. In this process, plant or animal tissues are hydrolized with enzymes, concentrated into a slurry under warm temperatures in a vacuum column, and then sprayed though a rotary nozzle spinning at 11,000 revolutions per minute in the center of a cyclone tank with winds of 140 miles per hour. The resulting products are very fine, uniform in size, and have high N analysis (12 to 14%) for organic fertilizers. Fish protein, blood protein, poultry protein, and brewers yeast all are available as spray-dried materials.
During the summers of 1989 and 1990, the authors investigated the potential usefulness of such spray-dried fertilizers as injected materials in low-volume irrigation systems. We sought answers to these questions:
Hopland: 1989 experiments
In June 1989, an irrigation system was assembled at the Hopland Field Station in Mendocino County to assess the potential for various low-volume emission devices to clog as a result of organic fertilizer injection. Injection was accomplished with a positive-displacement, water-powered pump. The drip system consisted of seven brands of drip emitters: Irredelco Flapper 2-gph dripper, Hardie Turbo-key 1-gph dripper, Netafim pressure-compensating 1-gph dripper, Bowsmith S-series 1-gph dripper, Bowsmith Truflow Gripper 1-gph dripper, Netafim 1/2-gph button dripper, and Netafim 1-gph button dripper. Each was replicated 20 times for a total of 140 experimental units.
Emitters were installed 2 feet apart on four 70-foot-long 1/2-inch polyethylene lines, with water pressure set at 7 pounds per square inch (psi). Six different micro-sprinkler types with a range of sprinkler patterns and orifices were used: Bowsmith Red Fanjet, Bowsmith Green Fanjet, Bowsmith Blue Fanjet, Olsen Blue Mini-sprinkler, Olsen Green Mini-sprinkler, and Hardie Black Fan-Spray. The micro-sprinklers were installed in a system similar to the drip-emitter system, with line pressure set at 20 psi. The sprinklers were installed 2 feet apart on five 3/4-inch black polyethylene lines 80 feet long. Two products — blood protein and fish protein — were evaluated during the 1989 Hopland screening test.
Test results indicated that both the blood protein and the fish protein could be injected with minimal clogging through low-volume emitters. It was also found that portions of both products went into suspension rather than solution and would tend to settle out. This was true of the blood protein where higher concentrations of fertilizer (as measured by nitrate concentration in the irrigation water) were emitted near the inlet end of the drip lines. The fish protein product was more easily held in suspension, resulting in a more even distribution of fertilizer along the entire length of drip line. The 1989 screening test indicated that injection of the fish protein product merited further more detailed and more extensive investigation under irrigation system conditions typical of grower installations.
Davis: 1990 experiments
Irrigation equipment.
In summer of 1990, a low-volume irrigation system was designed and installed at the Campbell tract of the University of California at Davis. Tested were a microsprinkler, five drip emitters, and two drip-tape materials to examine their susceptibility to clogging. The microsprinkler model was a Bowsmith Blue Fanjet, and these were placed at 15-foot intervals along 3/4-inch polyethylene tubing. Four 300-foot-long microsprinkler laterals were installed. The Bowsmith Blue Fanjet was chosen as a result of information gathered from the 1989 Hopland screening. It has a relatively small orifice size, and would therefore be more likely to clog. If injected fertilizer materials failed to clog the Bowsmith Blue Fanjet, we felt that microsprinklers with larger orifice sizes would suffer even less clogging.
Five drip emitters were investigated: Bowsmith Truflow Gripper drippers, Netafim pressure-compensating 1-gph drippers, Netafim 1/2-gph button drippers, Bowsmith S-series drippers, and Netafim 1-gph Button drippers. Four lateral lines (1/2-inch polyethylene tubing), each one 300 feet long and with emitters at 5-foot intervals, were laid out for each type of emitter. Finally, two drip tapes — Netafim Typhoon tubing with 0.45-gph emitters at 18-inch spacings, and T-Tape Low Flow with 12-inch outlet spacings — were installed. Again, four 300-foot lengths of each drip-tape material were laid out.
The 32 lateral lines were connected to four 1-inch solenoid valves so that the flow to each station was approximately equal. The valves were connected to a control clock so that the irrigation system could be operated automatically. Pressure to the system was controlled by a Hardie Irrigation adjustable pressure regulating valve, which could sense downstream water pressure and compensate to maintain the desired system-operating pressure. Irrigation was performed daily to simulate actual grower operations. The water source was the UC Davis water supply system.
After an initial “break-in” period of approximately 1 week, a baseline set of emitter flow-rate measurements for the entire system was taken on July 26, 1990. For the drip emitters and microsprinklers, emitters were selected at 50-foot intervals along each lateral line and the flow rate from each selected emitter during a 1-minute interval was collected. For the drip-tape materials, the flow rates of 5-foot sections of drip tape at 50-foot intervals were monitored for 1 minute using a PVC trough laid under the drip tape. All monitored locations were marked and became the sampling sites for all future flow measurements.

Fig. 1. Distribution of total nitrogen concentration along the length of drip line when fish protein fertilizer was injected into the system.
Fertilizer Injection.
The spray-dried fish protein fertilizer was evaluated first. For injection, the fish protein was added to a tank of water at a concentration of 160 grams of fertilizer per gallon of water and thoroughly mixed using a mechanical stirring device known as a drum beater. The fish protein mixed easily into solution; once mixed, it stayed well in suspension. The fertilizer solution was injected into the irrigation system using an adjustable electrically driven diaphragm pump. An injection rate was chosen to attain a nitrogen concentration of approximately 75 ppm in the irrigation water.
During fertilizer injection, one of the four lateral lines for each of the tested emission devices was shut off with a ball valve. These selected control lines never had fertilizer-injected water run through them. Fertilizer was injected in the middle of the irrigation cycle to allow a period of “clean” water to follow the injection. This practice worked well, is easily done, and is recommended for anyone injecting the organic fertilizers we tested. Without a flushing period, residual fertilizer is left in the line, with the result that fertilizer settles out before the next irrigation. Although we have no data to indicate this would increase the potential for clogging, there is no reason to take unnecessary risks.
Following the first fish protein injection (August 6, 1990), emitter flow rates were again monitored at the same sites as had been selected and monitored before. No emitter clogging was evident as a result of the fertilizer injection. Subsequently, the irrigation system was operated daily, with fish protein injection occurring weekly until seven fertilizer injections were completed. A final set of emitter flow-rate measurements was taken October 9, 1990.
During the second fish protein injection (September 4, 1990), water samples were collected at 50-foot intervals along the lateral lines to determine whether the fish protein was being discharged uniformly along the entire lateral length. The samples were later analyzed by a diagnostic laboratory for total nitrogen levels.
Following the fish protein injections, a spray-dried poultry protein product was also evaluated in a manner identical to that used for the fish protein fertilizer. We made six injections of the poultry protein, and collected final flow measurements December 6, 1990. The two drip tapes had been damaged by rabbits and ground squirrels, so they were not evaluated during the poultry protein experiment. Injection of the poultry protein was easily managed, although it was slightly more difficult to mix into solution than was the fish protein. Once mixed, however, the poultry protein stayed in suspension very well.
Interpretation of data
Statistical analysis of the flow-rate information gathered during the fish protein injection indicated that for four of the low-volume products — Bowsmith Fanjets, Bowsmith Truflow Grippers, T-Tape drip tape, and Netafim Typhoon drip tape — the average flow rates before and after the fish protein injections were not equal. The statistical analysis used a two-sample analysis that computed a confidence interval for the difference between sample means and a hypothesis test for the difference between sample means, which computed a T-statistic. A 95% confidence interval and an alpha of 0.05, respectively, were used for the tests.
Table 1 summarizes the percentage change in average flow rates from low-volume emitters across the period of fish protein injection. It is evident that changes in the flow rate across the injection period of the various emitters were minimal, with a 6% decrease being the greatest change.
A statistical comparison of the post-injection, average flow rates of the treated versus the control (no injection), on an emitter device basis, revealed that no clogging could be attributed to the fish protein injection. For example, the average flow rate of the T-Tape sections that had fish protein injected through them and those that experienced no injection (control lines) were statistically equal. Table 2 illustrates this for each irrigation product tested. There were some small-but statistically significant average flow-rate changes across the fish protein injection period, because (1) pre- and post-injection measurements were taken at slightly different operating pressures or (2) clogging resulted from other sources. Although the water quality made clogging by chemical precipitates unlikely, organic growth was noticed in the system because of the entire irrigation system's exposure to sunlight. Chlorine was injected periodically into the system to control organic growth, but the minimal flow-rate changes experienced might be attributable to clogging with organic matter.
The uniformity of fertilizer distribution along the lateral line was measured during injection by collecting water discharged from the selected emission devices at 50-foot intervals along the lateral. The water was analyzed by the diagnostic laboratory for total nitrogen — chosen as an indicator of the fertilizer content in the irrigation water. The source water, UC Davis domestic water, had less than a 1-ppm background nitrate level. Figure 1 illustrates the nitrogen distribution along a lateral containing Netafim 1-gph button drippers. Clearly, uniformity of fertilizer emission was very good. Microsprinklers and drip tapes were analyzed similarly, with similar results.
After completion of the fish protein injection on October 9, 1991, we evaluated the spray-dried poultry protein. We followed the experimental procedure previously described for the fish protein evaluation to evaluate the suitability of the poultry protein for injection. Daily irrigations and six weekly fertilizer injections were performed. Final low-volume emitter flow measurements were taken on December 6, 1990.
Table 1 lists the percentage change in drip-emitter average flow rates across the poultry protein injection period. Little change occurred in emitter discharge rates across the injection period. Statistical analysis indicated no significant change in emitter discharge rates except for the Bowsmith S-series dripper, which showed an increase in average discharge rate (but less than a 4% increase) during the injection period. A comparison between the average flow rates of the treated versus the control emission devices (table 2) on an emitter device basis again revealed that no clogging could be attributed to the poultry protein injection.
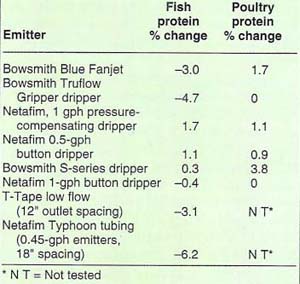
TABLE 1. Percentage change in discharge rates across the injection period for various drip emitters when fish or poultry protein fertilizers were injected into irrigation water
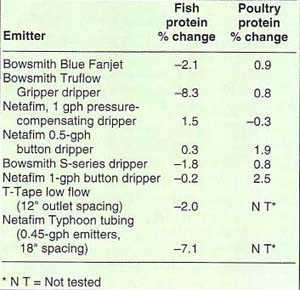
TABLE 2. Average changes in discharge rates with fertilizer injection, relative to changes in discharge rates for uninjected controls, for two organic fertilizers and various drip emitters
The uniformity of the injected poultry protein emission along the lateral line was measured by collecting water samples in a manner similar to that described for the fish protein product. As with the fish protein, the injected fertilizer was uniformly discharged along the entire 300-foot-long lateral.
Other management considerations
Both the fish protein and poultry protein products are sold dry and finely ground. In this form, they are easy to handle and to store. It is recommended that once mixed with water, the entire batch be injected and the fertilizer tank rinsed. Both products tend to take on offensive odors if allowed to sit for more than a few days.
Frequently, nitrogen fertilizer applications are calculated in terms of pounds of applied nitrogen. One acre-foot of water with a 75-ppm nitrogen concentration of injected fish or poultry protein products (the level used in this study) contains approximately 200 pounds of nitrogen.
The fish protein and poultry protein products contain 14% nitrogen, 0.5% phosphorus, and 0.7% potassium. Both fish and poultry protein products cost approximately $1.60 per pound of material, depending on quantity purchased, resulting in a final cost of approximately $12 per pound of nitrogen. As a comparison, sodium nitrate costs approximately $1.50 to $2 per pound of nitrogen. Both organic nitrogen sources are substantially more expensive than nonorganic nitrogen sources, such as UN-32 (35 cents per pound of nitrogen), which are commonly injected into low-volume irrigation systems.
Conclusion
The two organic fertilizer products tested — spray-dried fish protein and spray-dried poultry protein — were both shown to be injectable through microsprinkler, drip, and drip-tape irrigation systems with minimal clogging. Both fertilizer products were also shown to be emitted uniformly along the 300-foot lateral lines tested.
Before-and-after tests on emitters show organic fertilizers can be injected through low-volume irrigation systems

