


All Issues
Owning harvest equipment versus custom hiring: the case of walnuts
Publication Information
California Agriculture 45(6):33-38.
Published November 01, 1991
PDF | Citation | Permissions
Abstract
Is a walnut producer better off owning harvesting equipment or custom hiring someone else to perform the job? This paper compares purchase costs with custom harvest rates, leading to an estimated break-even acreage which can be used as a decision criterion. However, two risk factors must be included in the decision process: the date of harvest and the efficiency of the harvest operation. The effect of these factors may significantly alter the “real” costs of owning versus custom hiring harvest equipment and, therefore, may change the decision reached by an individual grower.
Full text
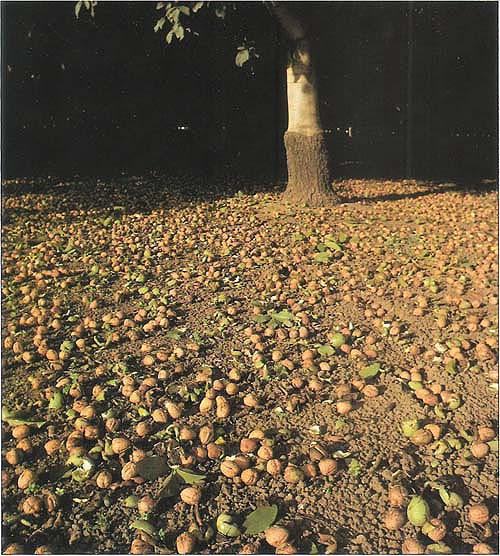
Walnuts on ground after shaking of Yolo County orchard.
The question of whether a walnut producer is better off owning harvesting equipment or custom hiring someone else may be addressed through a financial analysis of three alternate courses of action: (1) to buy all new harvest equipment, (2) to buy all used harvest equipment, and (3) to custom hire the job done. This analysis is based on data collected during January 1991 through interviews with equipment manufacturers, custom harvest operators, and growers located in the San Joaquin Valley and Sacramento Valley. Using this data, the cost of owning and operating the necessary harvest equipment is estimated over the average period such equipment is held. The estimated cost for both new and used equipment is then compared against the current custom rates to reach a basic conclusion. In the second part of the analysis, risk factors which might affect the basic conclusion for individual growers are evaluated. The objectives of this paper are to report the results of this study for walnuts and to illustrate how financial analyses are structured as a guide for readers undertaking their own purchase/lease decisions.
Equipment needed
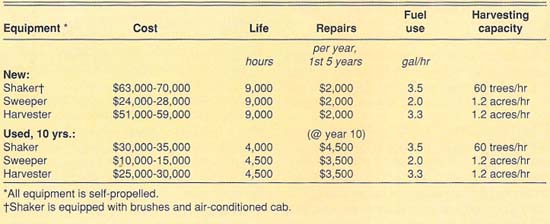
The analysis here focuses on the three pieces of equipment required to harvest walnuts. This “team” of equipment includes a shaker (usually purchased with options such as wheel brushes and an air conditioned cab), a sweeper (a.k.a. windrower), and a harvester or pick-up machine with nut trailers (a.k.a. bail-out wagons, nut buggies). Table 1 presents cost and performance information concerning this equipment when purchased new or used. This equipment can be used with other nut crops, such as almonds and pecans, although short-boom shakers are particularly suited for use with walnuts and almonds. Only the harvest of a mature walnut orchard is considered here.
Ownership and operating costs
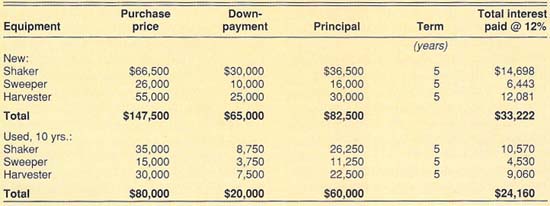
The first step in this analysis is to determine the total cost of owning and operating harvest equipment. Since there is an active market for used equipment in California, each purchase alternative (new versus used) is evaluated separately. In each case, it is assumed that the equipment will be financed. Table 2 lists the details of typical loans for the equipment described in table 1. At present, five-year loans at 12% interest are the most common in California and, therefore, are included in the analyses below.
An analysis of the cost of owning harvest equipment must include cash flows over a number of years while the expenditure for custom hiring is a single year cost. It is not correct to take the simple average cost of ownership over the useful life of the equipment and compare it to the custom cost. Most importantly, by investing in harvest equipment the grower is tying up money that could be generating earnings in another investment. This income foregone is the opportunity cost of the investment. In addition, uncertainty and inflation make a future dollar less valuable than today's dollar. Nominal interest rates reflect the opportunity cost of not immediately putting money into the best alternative use, as well as overall inflation and investment risk.
In order to account for the level and timing of the grower's expenses, present value analysis is used to compare the cost of owning harvest equipment to custom hiring. In this analysis all cash flows are adjusted into their current purchasing power equivalents and added together to calculate the net present value. The equivalent annual annuity is then calculated from the net present value. It represents the annual expenditure of equal amounts that is equivalent to the uneven cash outlays for the harvest equipment purchase and use.
Pieces of equipment with unequal lives and/or annual cash expenses can be evaluated against one another and a single year's custom harvesting contract by comparing the corresponding equivalent annual annuities and the custom rate. It should be pointed out that both the operating costs and custom rates may increase with inflation. However, for the purposes of this type of analysis the operating costs are adjusted for inflation and the custom rates are not. The results should be interpreted as a decision made in the present and not for decisions made in the future. Also, it is noted that custom rates have not increased at the inflation rate over the last three years.
New equipment
Total and annual costs of owning and operating harvest equipment will vary depending on three factors: acreage harvested, interest rate, and tax rate. Therefore, cost estimates were made for several combinations of these factors. A summary of these results is presented later, but first an explanation of how the estimates are calculated is presented.
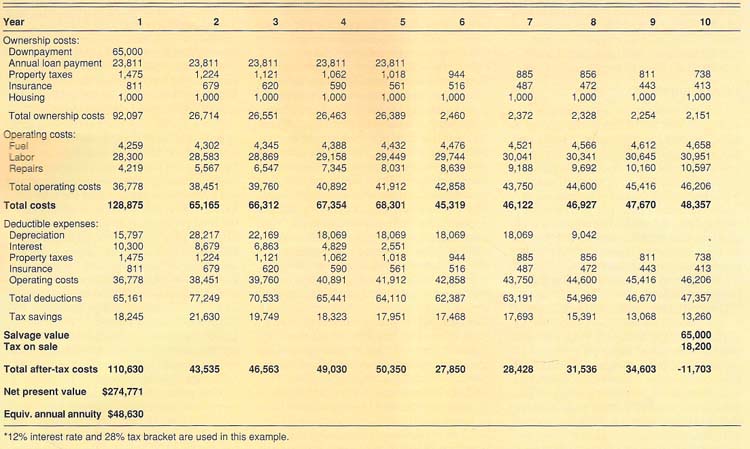
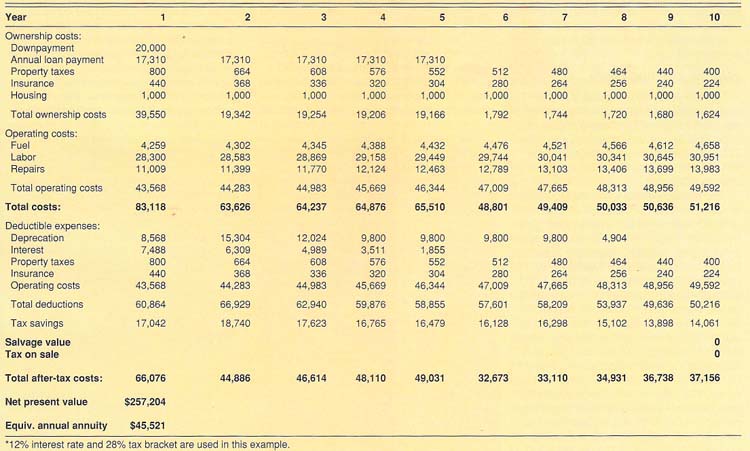
Table 3 presents the details for the combination of factors considered to be most representative of the current situation in California. The case presented in table 3 is for a grower intending to keep the harvest equipment 10 years while harvesting 500 acres (expressed as hours equipment used per year) annually, paying 12% interest and having a marginal tax rate of 28%. Such a grower is expected to face after-tax total annual costs of $48,630 (expressed in current dollars as the equivalent annual annuity listed at the bottom of table 3). This average value does not represent actual cash flows for any particular year. Next, the variables in table 3 are described briefly.
Downpayment
This amount comes from table 2. It represents the total trade-in value expected for the three pieces of equipment after 4,000 to 5,000 hours of use. Typically, this is the age at which equipment is traded-in and it is common for trade-ins to be used in lieu of cash downpayments.
Loan amounts
The total, interest and principal payment amounts come from standard loan amortization calculations.
Property taxes and insurance
These values are based on the current value of the equipment. County assessors use methods which vary somewhat, but typically they use a given percentage of the purchase price (such as 1% for taxes) for year 1 and then gradually reduce that percentage to half its original amount by year 10.
Housing
It is assumed that housing for the equipment does not exist and, therefore, is purchased. Purchased housing for equipment is a depreciating asset, so its cost is deductible according to its depreciation schedule (7-year life is used here). If housing is leased from another firm, the cost is deductible as a fixed operating expense.
Operating costs
All operating costs are adjusted annually for inflation. The labor rate used for an equipment operator is $8 per hour, the rate for field labor is $6 per hour (both include a 34% benefits margin). Shaking requires one equipment operator; sweeping, one equipment operator and five field laborers; and pick-up, 2 equipment operators. Fuel use is calculated from the use per hour and acres harvested per hour for each piece of equipment listed in table 1. The cost of diesel is assumed to be $1 per gallon. Repair costs are calculated using the formula below from the American Society of Agricultural Engineers Standards Yearbook 1990:
Depreciation
The tax code allows farm machinery to be depreciated as 7-year property under the Alternate Depreciation System of the Modified Accelerated Cost Recovery System. Therefore, the purchase cost is multiplied by the standard percentages: 1st year, 10.71; 2nd year, 19.13; 3rd, 15.03; 4th through 7th, 12.25, and 8th year, 6.13.
Tax savings
This is the amount that taxes are reduced by writing off all deductible expenses. It equals the total deductions times the tax rate. To simplify the analysis, only federal rates are used in this paper, but the tax rate used by an individual should include both federal and state brackets.
Salvage value
The value used here, $65,000, is an average estimate for the equipment after 4,000 to 5,000 hours of use.
Net present value
This is the sum of all discounted after-tax costs over the period the equipment is held. It represents the total costs expressed in terms of the current purchasing power of the dollar amounts.
Equivalent annual annuity
This value represents the average of discounted costs per year. In other words, if the uneven annual cash flows included in the total after-tax costs could be lumped together and amortized over the 10-year period, this is the fixed amount of costs which would have to be paid each year.
Used equipment
Table 4 presents the details for the same combination of factors considered in table 3, except that the machine being purchased has only 4,000 to 5,000 hours of useful life remaining. A grower intending to keep the harvest equipment 10 years while harvesting 500 acres (expressed as hours equipment used per year) annually, paying 12% interest and having a marginal tax rate of 28% is expected to face after-tax total annual costs of $45,521 (expressed in current dollars as the equivalent annual annuity listed at the bottom of table 4).
The variables in table 4 are calculated just as those in table 3. However, a couple of points need to be raised. First, the repair costs are calculated using the formula given earlier, but it is expected that actual costs could range more widely around the value calculated for an older machine than for a newer model. In some cases, growers reported costs more than 50% higher than the calculated value for particular years. Second, it is assumed here that machines have no salvage value after their normal life span, but this may not be true for well-maintained equipment. Higher salvage values reduce the net cost of owning equipment.
Factors affecting costs
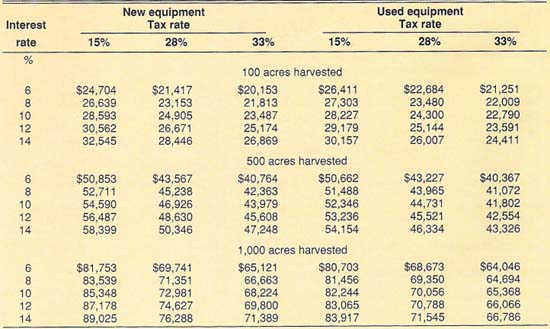
Table 5 presents a summary of estimates of annual costs of owning and operating new and used harvest equipment, expressed as equivalent annual annuities. The estimates vary depending on three factors: acreage harvested, interest rate, and tax rate.
The acreages reported in table 5 represent three scales of operation across the range which can be handled by a single equipment team. With a harvesting capacity of approximately 60 trees per hour for the shaker, a single team would be stretched to cover much more than 1,000 acres of walnuts during the 45-day harvest period common in California. An operation of 500 acres would use the new equipmenťs expected number of productive hours over the 20-year life span that manufacturers claim for their machines. Orchards of 100 acres are common in California. The effect of acreage on costs of both new and used equipment is quite apparent in table 5: total costs increase, but costs per acre decrease with increasing acreage. Clearly, being able to spread fixed ownership costs over more acreage is an advantage of large growers.
Interest rates and tax rates have opposite effects on equipment costs. As would be expected, interest rates and equipment costs change in the same direction. An increase in interest rates raises the cost of equipment and, therefore, reduces all firms' incentive to buy. Tax rates, on the other hand, reduce the after-tax cost of equipment. This appears to indicate that more profitable firms (if they have higher tax rates than less profitable firms) are more likely to buy equipment than are less profitable firms which harvest the same number of acres. This also means that equipment purchases may be more likely when walnut market prices improve, thus improving industry profitability. Of course, taxes also decrease the after-tax cost of custom hiring, so no conclusion about the effects of taxes can be reached at this point in the analysis.
Comparing entries in table 5 for new versus used equipment, the general conclusion which can be reached is that used equipment costs less in nearly all cases. It is noted, however, that as interest rates decline the amount of the cost difference between new and used equipment declines. At some interest rate, new equipment becomes less expensive than used machines, as happens in table 5 at 6% and 8% for 100-acre operations. Yet, to judge the two purchase alternatives requires a comparison of costs with custom harvest rates.
Custom rates
Custom rates for harvesting walnuts are contracted on a per-ton basis. Custom operators generally charge a minimum rate of 1 ton per acre and charge the same rate per ton regardless of orchard size. Survey responses indicate that rates in the San Joaquin Valley range from $110 to $120 per ton, with $115 being the average rate. This rate includes shaking, sweeping, harvesting and hauling. In this study the cost of hauling is removed from the quoted rates because growers would not have to purchase special equipment to perform this task. Therefore, the $8 per ton rate charged by haulers in the San Joaquin Valley is subtracted from the $115 average rate to get the gross cost per ton of $107.
The after-tax cost per ton is found to be approximately $91, $77 and $72, respectively, for the 15%, 28% and 33% tax brackets. The per-acre custom charge is found by multiplying the after-tax cost per ton by the yield per acre and the total custom charge is calculated by multiplying the total production by the custom rate. The total production is the yield per acre multiplied by the number of acres. For example, on 500 acres, the 28% tax bracket, and a 1 ton yield per acre, the per-acre custom charge is $77 ($77/ton x 1 ton/acre) and the total custom charge is about $38,500 ($77/ton x 1 ton/acre x 500 acres). Under the same conditions and a 1.75 ton (3,500 pounds) yield per acre, the custom charge would be $135 per acre and the total for the 500 acres would be $67,375.
Comparing the results in table 5 to the corresponding custom charges, it becomes clear that custom harvesting is always the best alternative for growers averaging a 1 ton yield on 100 or 500 acres, but owning (used) equipment is always the best choice for an average 1 ton yield on 1,000-acre operations – regardless of the interest rate or tax rate. However, for growers with an average yield of 1.75 tons per acre the custom charge is higher than the cost of owning and operating equipment for both the 500-acre and 1,000-acre examples. The acreage at which the rankings of the three alternatives changes under various sets of assumptions is discussed in the next section.
Break-even acreage
The break-even acreage is the orchard size for which the average total annual after-tax ownership (fixed) costs and operating (variable) costs for equipment is the same as the after-tax cost of custom hiring. The cost of owning and operating the equipment and the cost of custom hiring are described by the following two equations.
1) after-tax after-tax after-tax ownership and = ownership + operating cost operating cost cost times acres
2) after-tax custom hire cost = acres times custom rate per acre
The break-even acreage is calculated by setting the total after-tax cost of owning and operating equipment equal to the total after-tax cost of custom hiring and solving the equation for acreage. The result is the following equation for break-even acreage.
3) break-even acreage = average after-tax ownership costs/(after-tax custom rate per acre - aftertax operating cost per acre)
Table 6 presents the break-even acreages calculated in this study. Four observations can be made concerning the results in table 6. First, break-even acreage varies depending on interest rates. Higher rates increase owning and operating costs, thus raising the amount of acreage across which those costs must be spread to remain competitive with custom rates. Second, the effects of tax rates are negligible (there are no differences in break-even acreage between tax rates therefore only one column is presented for new and used equipment in table 6). Third, break-even acreages are lower for used equipment than for new equipment. This is due to the fact that the total costs reported in table 5 are lower for used machinery than for new equipment, and that both new and used equipment costs are compared to the single custom rate in calculating breakeven acreages.
Finally, the expected yield is a critical factor in the own versus custom hire decision. The break-even acreage for a 1-ton yield is more than three times the breakeven acreage for a 1.75-ton yield for both new and used equipment. The break-even acreages for new and used equipment are not significantly different at a yield of 1.75 tons although the break-even acreage for new equipment is much higher than the break-even acreage for used equipment at a low yield of 1 ton per acre. The average yield for most growers falls within the 1-ton to 1.75-ton range although some growers experience much higher yields.
Figure 1 is a graphic representation of the break-even concept and can be used to consider any yield level. The curved line is the cost per acre to own and operate new equipment. Notice that the per-acre cost decreases quickly for orchards under 400 acres but that above 600 acres the line smooths out indicating that the costs per acre are not decreasing much beyond this size. The line stops at 1,000 acres because larger acreages would require a second set of equipment in order to harvest the walnuts in a timely fashion. The horizontal lines across the graph are the per-acre custom charges at two different yield levels. The point where the line showing the cost of ownership intersects the line showing the custom charge is the break-even acreage.
A basic decision could be reached from the results in figure 1 and table 6. For example, someone facing 12% interest rates on loans would always choose to buy used, rather than new, equipment but only if they had about 750 acres or more to harvest and an expected per-acre yield of 1 ton. However, as is usually the case in agribusiness, decisions cannot be made solely on the basis of anticipated economic conditions. Financial analysis always needs to consider unanticipated conditions, as described next.
Risk factor analysis
It has been assumed in the basic analysis performed thus far that the quantity and quality of walnuts harvested does not depend on which of the three alternatives is selected. Yet, there are some risks involved in harvesting which vary across the alternatives and may affect a grower's net revenues. These risk factors must be identified and quantified to complete the decision-making process.
Risks in harvesting
The first risk factor to be considered is the date of harvest. It is a popularly held belief that owning harvest equipment allows for greater flexibility in the timing of operations. Since walnuts have a harvest period usually lasting 45 days, control over when harvesting will occur can be very valuable. For example, when asked why he owns his equipment, one grower responded:
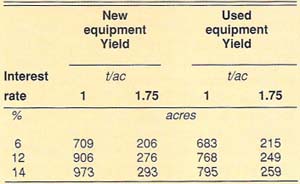
TABLE 6. Break-even acreages for buying new and used harvest equipment at varying yields and interest rates
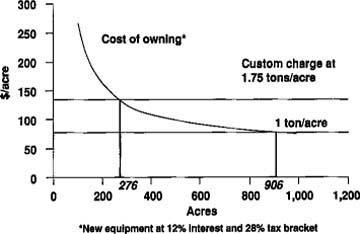
Fig. 1. Cost of owning vs. custom hiring to harvest walnuts. Break-even acreages are shown at various yields.
“Since I have a small acreage (250), I want to get top dollar for my walnuts. That means they must be harvested at precisely the right time, and I can't afford to take chances on custom.”
This comment reflects the problem raised by the common practice of not getting a definite time commitment from custom operators. Timing may affect both the quality and quantity of walnuts harvested, especially if the harvest does not all occur within the peak period. Reductions in either quality or quantity will reduce the grower's net revenue, effectively raising the cost of custom harvesting. Therefore, this “timing risk” factor is generally considered an incentive to buy equipment for acreages smaller than the calculated breakeven levels, and to consider new equipment rather than used (to avoid repair delays).
The second factor, “efficiency risk”, is an incentive to custom harvest. It concerns the efficiency of the harvest operation. In general, the custom operator should be more skilled at operating specialized equipment and should move through the orchard more efficiently. The fixed price per ton serves as an incentive for the custom operator to harvest the highest possible yield. For the same reason, custom operators will try to minimize equipment down-time. An owner-operator will usually not be as experienced in repairing the specialized harvest equipment, thus requiring longer to resume work and risking the revenue losses discussed earlier.
It was noted during the interviews that custom operators typically buy new equipment to reduce time and money spent on repairs. Also, speed in completing each job is important to a custom operator trying to serve as many growers (and acres) as possible within the harvest period (although the incentive for speed can lead to a poor quality job). Finally, the issue of damage to trees can be important, although most growers interviewed said that damage is not a major problem with walnuts. It is possible that the good custom operators will cause less damage than owner-operators if the custom crews are more experienced in harvesting techniques than the owner-operator's crew. Yet, growers may be more careful with their own trees. Nonetheless, a custom operator has an incentive to do a good job to keep a grower as a customer in future years.
Risk analysis
After the basic decision is reached, choosing either of the other two alternatives indicates that the grower is willing to pay a “risk premium” to avoid some potential problems inherent in the “best” alternative. For some growers, this may be a rational decision once the risk factors are considered.
To illustrate risk analysis, we present the case of a grower with 500 acres yielding 1 ton per acre, who pays 12% interest and who is in the 28% marginal tax bracket. For this grower, the basic analysis showed that the total annual cost of purchasing new equipment is $48,630, the annual cost of purchasing used equipment is $45,521, and custom costs total $38,520 per year. The basic decision for this grower is to custom harvest. However, the grower is aware of the costs associated with the two risk factors identified earlier and wishes to incorporate them into his analysis.
The risk factor concerning harvest dates adds to the cost of custom harvesting. Since it is assumed that the grower would harvest at virtually the best time considering production and marketing conditions, if he had the equipment to do so, any delay which reduces total revenues collected from the crop is a “cost of risk” inherent in custom harvesting. In this example, the grower is aware of a neighbor who lost $90,000 one year due to worm damage. This damage could have been avoided if the harvest had not been started late. The grower estimates that such a loss is likely to occur only once each 8 years. Therefore, the estimated cost of custom harvesting needs to be raised by the cost of this risk factor, calculated as
Cost of Risk = (Damage) times (Probability of occurrence) = ($90,000)(0.125) = $11,250.
The real cost of custom harvesting in this example is now estimated to be $38,520 +11,250 = $49,770.
At this point, the risk analysis has changed the basic decision. The risk-adjusted cost of custom harvesting is now the highest of the three alternatives. The least expensive choice is now to purchase used equipment. However, as noted earlier, the time risk factor also may affect the real cost of used equipment.
While the basic analysis includes higher estimates of repair costs for used equipment than for new, the grower knows that repair delays may also cause lost revenues. Reduced yield (from worms or other such production risk) and reduced price (a market risk) both reduce total revenues. If such losses occur due to breakdowns of used equipment, where new equipment would not normally break down, that revenue damage has to be included in the cost of risk of used equipment. In this example the grower estimates that at least $4,000 worth of revenue losses will occur due to used-equipment downtime each year. This raises the total risk-adjusted cost of used equipment to $45,521 + [($4,000)1.0] = $49,521.
In this example, the effect of the timing risk factor made purchasing new equipment the least costly alternative. However, the effect of the efficiency risk factor must also be evaluated before a final decision is reached. For instance, if owner harvesting is estimated to be less efficient than custom work, the revenue losses from that inefficiency must be added to calculate a new total cost of owning equipment. This may or may not sway the final decision back in favor of custom harvesting. The key is that all risk factors must be considered.
Whereas the basic decision is derived from observable quantities, the risk analysis portion of the decision process is based on estimates of both damages and the probabilities of those damages occurring. This means that the final decision is affected significantly by the skill of the grower in estimating the cost of risk for each potential risk factor. Since this is an inexact process, many growers may prefer a different approach to the problem.
Instead of estimating the cost of risk to be added to each of the three harvest alternatives, the risk premium can be evaluated. The risk premium is simply the difference between an alternative's basic cost and the cost of the least expensive alternative. In the example above, the two equipment purchase alternatives have a risk premium compared to custom harvesting. If the grower is considering the purchase of new equipment, the annual risk premium is $48,630 - 38,520 = $10,110. This means to justify the purchase, the grower must believe there are at least $10,110 worth of risks associated with custom harvesting that he wishes to avoid. It is not necessary to formally measure the risks, as suggested thus far in this section of the paper; an informal assessment may be enough to satisfy the grower. Therefore, this risk premium evaluation process is virtually identical to the process involved in deciding whether or not to purchase insurance.
Summary and conclusions
The question of whether a walnut producer is better off owning harvesting equipment or custom hiring someone else to perform the job involves analyzing three alternate courses of action: (1) buying all new harvest equipment, (2) buying all used harvest equipment, and (3) custom hiring the job done. Total and annual costs of owning and operating harvest equipment will vary depending on three factors: acreage harvested, interest rate, and tax rate. Cost estimates were made here for several combinations of these factors. Interest rates and tax rates are shown to have opposite effects on equipment costs. Higher interest rates raise the cost of equipment and, therefore, reduce all firms' incentive to buy. Higher tax rates, however, reduce the after-tax cost of equipment.
In comparing costs for new versus used equipment, the general conclusion is that used equipment costs less in nearly all cases. The annual costs of new and used equipment is quite close, however. This is not surprising considering that there is an active market for used equipment and that the price is bid up to where the average annual cost is almost the same as for new equipment. Of course, the timing and magnitude of the capital outlays is significantly different for new and used equipment and must be taken into account by me firm.
To choose between the three alternatives requires a comparison of purchase costs with custom harvest rates. This leads to an estimate of the break-even acreage which is used as a decision criterion. In general, a grower would choose to buy equipment if their orchard is larger than the break-even acreage, and they would custom harvest if their operation is smaller than the break-even size. However, two risk factors need to be included in the decision process: the date of harvest and the efficiency of the harvest operation. The effect of these factors may significantly alter the “real” costs of owning versus custom hiring harvest equipment and, therefore, may change the decision reached by an individual grower.
Owning harvest equipment versus custom hiring: the case of walnuts

