


All Issues
Unions: their effect on California farm wages
Publication Information
California Agriculture 44(6):28-30.
Published November 01, 1990
PDF | Citation | Permissions
Abstract
Six unions today cover 12,400 farmworker jobs on 258 California farms, a sharp decrease from the numbers of the early 1980s. Though they are the workers' certified bargaining representatives on 725 farms, unions are finding it harder to turn their election victories into contracts that will raise member wages.
Full text
In 1966, the United Farm Workers' (UFW) first contract with the Scherdey Industries grape farm raised the hourly minimum wage for farmworkers from $1.25 to $1.75. Ever since, there has been a great deal of speculation among media, researchers, and legislators about the effects of unions on California farm wages. According to the USDA, the average hourly wage paid to a California fieldworker rose from $1.41 in 1965 to $5.84 in 1989. Some commentators credit the UFW for this increase, while others believe rising minimum wages and other factors account for the overall 314% increase over 24 years. Over the same period, the Consumer Price Index rose 270%.
This article looks at union activities and their effects on farm wages since 1975. In 1975, California enacted the Agricultural Labor Relations Act (ALRA) and created the Agricultural Labor Relations Board (ALRB) to administer it. The ALRA granted farmworkers the right to organize into unions and to bargain collectively with farm employers. As a consequence, the ALRA was expected to encourage union activities and help increase wages. A review of wage data indicates that unions had a statewide influence on farm wages during the late 1970s, but since then their effects have been more local.
Farmworker unions
At least 15 unions have been certified as bargaining representatives for farmworkers in ALRB-supervised elections since ALRA enactment in 1975. Of the 1,125 supervised elections, 726 (65%) resulted in union certification. Almost two-thirds of those elections were held between 1975 and 1978. ALRB election and certification data indicate (1) that many unions were certified in only one election; (2) that two unions—the UFW and the Christian Labor Association (CLA) — account for 79% of all certifications; and (3) that 54% of all certifications were in two geographical areas, around Salinas and San Diego. Several unions were certified but no longer exist (e.g., the International Union of Agricultural Workers), and several new unions have yet to be certified in ALRB elections.
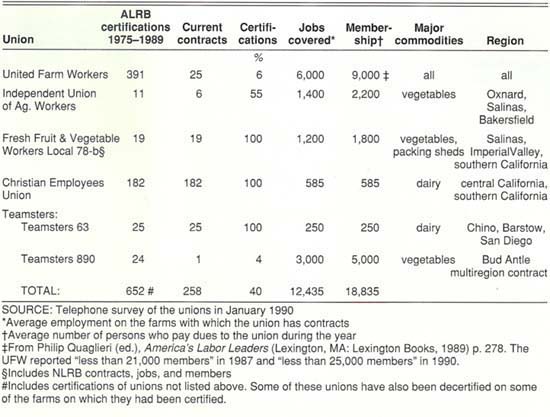
Union success in translating certification victories into union contracts has been spotty. The dairy workers' unions, for example, have contracts with virtually all farms on which they are certified, while the UFW has contracts with fewer than 10% of the farms where it is certified (table 1). The four field worker unions report about 18,000 members on the 50 farms where they have contracts, an average 360 members per farm.
Unemployment Insurance data show that 1,580 crop and livestock farms hired the equivalent of at least 50 year-round workers in 1988, and most of these large farms issued 150 to 400 W-2 earnings statements to individual workers for the year. About 325,000 workers earned $1,000 or more from California crop, livestock, or farm-oriented agricultural service firms in 1988. Whether measured in terms of large farms with and without union contracts or of workers employed in California agriculture, farmworker unions represent only a small fraction of farm employment in California.
Wages
The wages of unionized workers outside the farming sector are 20 to 30% higher than the wages of comparable non-union workers, and the largest union wage effects are for young minority workers with little education who have been on the job less than three years. Because farmworkers fit this profile, one might expect them to benefit disproportionately from unionization. One mid-1980s study of the effects of farmworker unions on wages was based on Current Population Survey data, and found that unionized farmworkers in California earned 38% more than non-union workers during the 1970s.
Three sources are available for year-by-year data on California farm wages. The USDA Quarterly Agricultural Labor Survey checks with about 1,200 California farmers, asking about the total wages and hours worked by various worker categories and then calculating an average hourly wage for field workers, piece-rate workers, supervisors, and so on. California's Employment Development Department (EDD) publishes a monthly tabulation of prevailing wages in various crops and counties using data collected by local agribusiness representatives. As a third source of farm wage data, the appendices to collective bargaining agreements list the wages negotiated for various job titles, such as general laborer and tractor driver.
These three sources are imperfect. USDA data take a statewide average with no distinction for commodities or areas. Local agribusiness representatives use diverse techniques to obtain commodity and task-specific data for EDD. Neither USDA nor EDD data distinguish union from non-union wages. Finally, there is no complete list of union contracts in California agriculture.
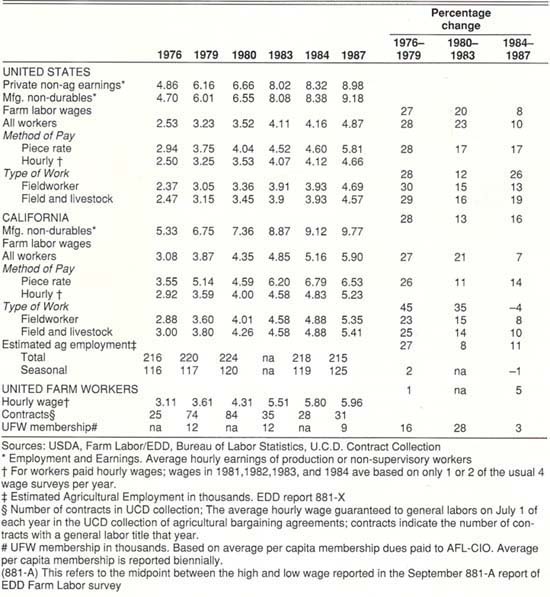
In 1976, USDA reported that field and livestock workers in California averaged $3.00 hourly, the equivalent of 56% of the average wage paid in California's non-durable manufacturing industries (table 2). General laborer wages in UFW contracts averaged $3.11 hourly, and the UFW wage was $3.10 in Central Coast vegetables (table 3). About one-third of the UFW contracts were in the Central Coast area.
By 1988, USDA field and livestock wages were 86% higher ($5.57), but comparatively dropped to 55% of non-durable manufacturing wages. The average UFW hourly wage rose to $5.96 in 1987, a 92% increase over 1976 levels; and the UFW wage was $7.38 in Central Coast vegetables, which included almost two-thirds of the UFW contracts. These data indicate (1) that farm wages rose at about the same pace as nonfarm wages and (2) that the statewide UFW wage premium over average farm wages, as measured by USDA, remained in the range of 4 to 6%.
Year-to-year wage changes indicate steady but uneven increases in farm wages between 1976 and 1985. After 1985, wage increases leveled off, and USDA figures for California piece-rate wages decreased.
A comparison of USDA and UFW wage trends indicates that the average union wage premium for California was about 6% from 1975 to 1979, the period marked by high levels of union certification activity. After 1979, the average annual union wage premium rose to 16%, even though election and certification activity declined. An average of 200 elections were held per year, resulting in 153 union certifications per year between 1975 and 1979; only 33 elections and 28 certifications occurred on average per year after 1979.
Why did the union wage premium rise after 1979 when union activity was declining? The best explanation seems to be that between 1975 and 1979, union activity had a statewide impact on farm wages, but after 1979, the unions influenced wages only in selected commodities and regions. This explanation is supported by USDA wage data. UFW wages rose more slowly than statewide average farm wages in the late 1970s, and then more quickly than other farm wages between 1980 and 1983. Since 1983, UFW wages have risen more slowly than statewide average farm wages.
Statewide and local effects
These data paint the picture that during the late 1970s and early 1980s, the UFW set the pace for farm wage increases statewide. The number of UFW contracts peaked at more than 100 in 1978, but as more employers realized that their workers were not likely to be organized, those employers offered wage increases that depended on local conditions; often, these wage increases were less than the UFW had achieved in bargaining. In the few commodities for which the UFW represented the majority of employees, average UFW wages continued to increase, but the UFW in the 1980s began to have less and less impact on statewide wage patterns.
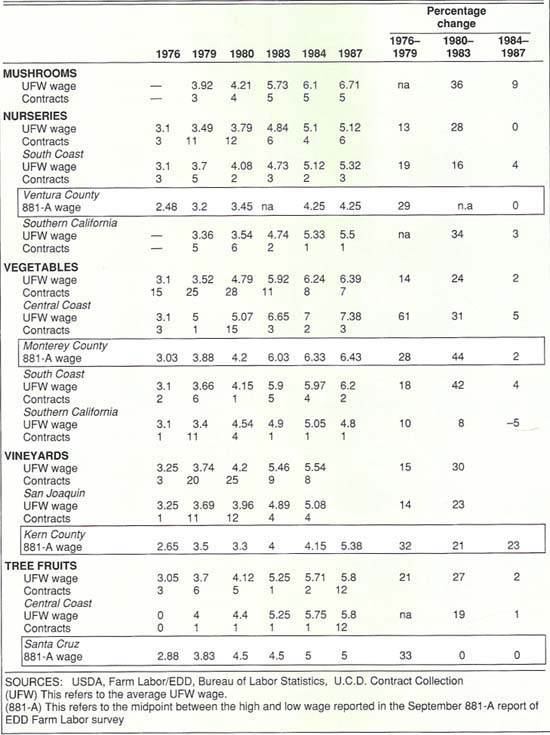
The UFW today represents the majority of workers employed in only one commodity, mushrooms. In 1977, the average hourly wage for UFW mushroom workers was $3.35, 4% more than the average fieldworker's wage as measured by USDA. By 1987, the average hourly wage for UFW mushroom workers was $6.71, 20% more than the average fieldworker's wage. The UFW helped to raise mushroom worker wages, but union activities had few spillover effects in non-union commodities in the 1980s.
Vegetable wage patterns are similar. There were 33 UFW vegetable contracts in 1981, but only seven in 1987. The average hourly wage paid to general laborers on Central Coast vegetable farms with UFW contracts rose 61% between 1976 and 1979 and another 31% in the early 1980s, but only 5% between 1983 and 1987. UFW vegetable wages initially rose more quickly than all other vegetable wages in the Central Coast area, but as the union's number of vegetable contracts declined, so did the rate of increase in UFW vegetable wages.
Unions: their effect on California farm wages

