


All Issues
Farm employment and wage patterns in the mid-1980s
Publication Information
California Agriculture 44(6):16-18.
Published November 01, 1990
PDF | Citation | Permissions
Abstract
Wages paid to hired workers make up the single largest production expense for California crop and livestock farmers, and they rose 11% between 1984 and 1988. Crop and livestock employment is becoming concentrated on fewer, larger farms, and labor contractor employment is becoming fragmented among smaller contractors.
Full text
California agriculture depends on the hired workers who do 75 to 80% of the state's farm labor. The wages paid to these workers made up 27% of the $11 billion in production expenses reported by farmers in the 1987 Census of Agriculture. The cost and availability of farm labor became more critical in the 1980s, when immigration reforms made it illegal for a farmer to knowingly hire illegal alien workers.
Between 1984 and 1988, the wages paid for seasonal agricultural services (crop-farm work and farm-oriented agricultural services) rose 17%. At the same time, growers shifted to hiring more through farm labor contractors (FLCs). The FLC share of total wages for seasonal agricultural services rose from 10 to 12% while the share of those wages paid by general crop farms fell from 13 to 10% and the share paid by vegetable and melon farms fell from 16 to 14%. The shift toward labor contractors was more pronounced in some counties. In Monterey County, for example, vegetable crop employment fell by 17% between 1984 and 1988, while FLC employment rose by 151%.
Employment concentration
In 1988, almost 35,000 agricultural employers paid $5 billion to the equivalent of 420,000 full-time workers (table 1). California's Unemployment Insurance (UI) system requires that all employers paying wages of $100 or more report the names, social security numbers, wages paid, and weeks worked for all employees each quarter. The employers pay a tax of 2 to 5% on the first $7,500 of wages paid to each employee. The tax covers the cost of Unemployment Insurance benefits for jobless workers. California's Employment Development Department (EDD) began publishing quarterly UI data by commodity and county in the 1987 EDD Report 882. Our report is based on the same data set that served as the basis for Report 882.
Virtually all California farm employers must obtain UI reporting numbers, report their workers and wages, and pay the UI tax, so the UI system should constitute a functional “census” of farm employment. Undoubtedly, some growers do not comply with the law, but there are no state or federal estimates of noncompliance; enforcement officers generally agree that agriculture is not a “special problem” industry as, for example, is construction. When compared to Census of Agriculture data, the UI data report fewer employers and more wages paid. Because there is no incentive to understate wages on the Census of Agriculture, this comparison suggests that the smaller employers who report their Wrings to the Census but not to UI authorities do not account for a significant share of total farm employment.
The Standard Industrial Classification (SIC) system is a set of identification codes developed by the Federal Office of Management and Budget to classify economic activity. SIC divides agriculture into three segments: crop production (SIC 01), livestock production (SIC 02), and agricultural services (SIC 07). Within each segment, activities are sub-divided into three-digit codes (e.g., 017 is fruits and nuts) and four-digit codes (0172 is grapes). Employers (reporting units) are assigned to the SIC code from which they derive 50% or more of their sales. A single employer may appear as two or more reporting units if, for example, that employer has separate grape and livestock operations.
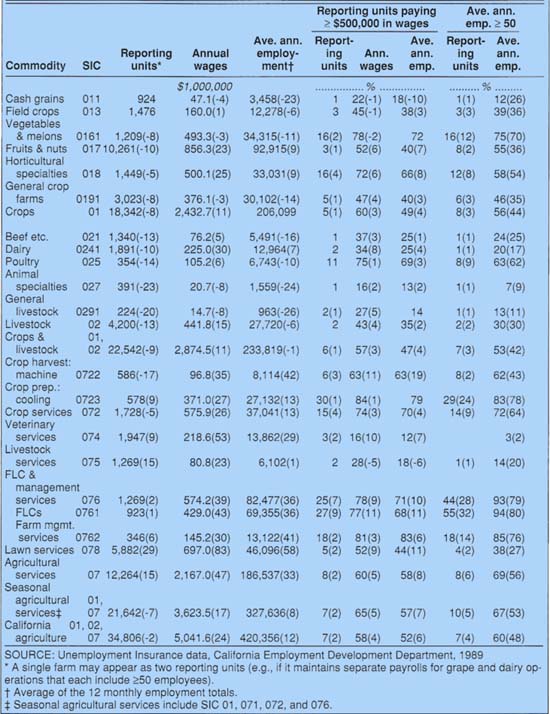
TABLE 1. California farm employment and wages paid in 1988, by commodity (percentage change from 1984, if any, is shown in parentheses)

Fig. 1. Agricultural wage and employment data for California, 1988.Source: Unemployment Insurance files, Employment Development Department, 1988
Table 1 lists the number of reporting units, annual wages, and average annual employment reported according to SIC code in 1988, and in parentheses shows the percentage of change in those figures from 1984 to 1988. The table distinguishes large and small employers on the bases of their wage bills and their average annual employment. Unemployment Insurance officials believe the wage data to be the most reliable, since they concentrate their enforcement efforts on making sure appropriate taxes are paid.
The concentration of farm wages and employment in a handful of commodities is evident from the data (table 1, fig. 1). About two-thirds of the crop wages are paid by fruit and vegetable farms, and more than half of the livestock wages are paid by dairy farms. Agricultural services data are harder to interpret because of the diversity of activities included in that category. Only half of the wages paid in that category go to persons who are likely to work on farms; most of the other half go to workers employed by lawn and garden services. Much of the agricultural service work on farms involves custom harvesting and farm labor contractors. The seasonal agricultural services that figure so prominently in new immigration regulations are approximated here as all crop reporting units (SIC 01) and farm-oriented agricultural services (i.e., those with SIC codes 071,072, and 076).
Within each commodity, a handful of large employers account for most of the wages paid and the farm employment. Generally, the largest 5% pay 50% or more of the wages and employ 50% or more of the workers. Even when a commodity shows a large number of reporting units, such as 10,261 fruit and nut employers, the 300 largest employers account for more than half of the fruit and nut wages paid. If measured by average annual employment, the 800 largest fruit and nut employers in the state—each of which employs the equivalent of a 50-worker crew year-round—account for 55% of fruit and nut employment. Even among labor contractors, the 50 largest account for more than half of the employment in that category.
Farm employment is also concentrated by region. The eight counties of the San Joaquin Valley include almost half of the state's crop and livestock employers, and account for 42% of the average annual employment; southern California coastal counties account for another 21%; and the seven central coast and bay area counties account for 17% — 80% in all. Regional employment by commodity is linked to areas of production. For instance, 98% of berry employment is in the central and south coastal regions, and 70% of grape employment is in the San Joaquin Valley.
In an agricultural county, a single activity or SIC code usually accounts for half or more of the wages paid in crops, livestock, or farm-oriented agricultural services. Employment in this dominant activity is usually concentrated on a handful of farms, so that 50 or fewer large farm employers account for 50 to 80% of a county's farm employment. Recognizing this phenomenon is important when interpreting farm labor patterns: both the number and the size of each employer contacted are important when determining the farm labor trends within an area.
This type of concentration is evident in major agricultural counties (table 2). In Monterey County, for example, more than two-thirds of the crop wages are paid by vegetable and melon farms, and the 50 largest vegetable farms pay almost 90% of the county's vegetable wages. Similarly, the largest 34 custom harvesters and the largest 30 labor contractors in Monterey County account for 95% of the wages paid by employers engaged in these activities.
Similar patterns can be observed in other farm counties. Imperial County agriculture is dominated by general crop farms (farms that do not get 50% or more of their revenues from a single crop category, such as vegetables and melons). In 1988, the 22 largest general crop farm employers accounted for almost two-thirds of the wages paid by general crop farms, and the 16 largest labor contractors accounted for 80% of FLC wages. In Fresno County, more than half of the crop employers are grape producers, and the 19 largest grape producers paid one-fourth of all grape wages. Fresno County includes 20% of California's farm labor contractors, and the 46 largest FLCs paid more than 75% of Fresno County's FLC wages.
Changes between 1984 and 1988
During the mid-1980s, the number of crop and livestock employers fell while the number of agricultural service firms rose. Since farm production was on the increase, these data indicate that California farmers hired more workers through custom harvesters and FLCs. There were decreases in the number of California vegetable and melon employers, fruit and nut employers (except berries), and horticultural and general crop farm employers, but these decreases were accompanied by increased total wages, indicating that more of the employment was concentrated on large farms. Livestock employment followed similar trends: the number of reporting units was down and wages were up.
Agricultural service employment trends were different. Instead of fewer and larger employers, there were more medium-sized reporting units that paid $50,000 to $500,000 in wages. This increased fragmentation of agricultural service employment into smaller units around the state stands in sharp contrast to the increased concentration of crop and livestock employment.
Between 1984 and 1988, the number of small employers decreased and the number of large employers increased in the crop category, indicating that crop employment was becoming more concentrated on a few large farms. Large employers accounted for an increased proportion of the direct-hire employment in citrus, tree fruits, and other fruits such as avocados, so that the 24 largest California citrus employers paid 52% of the direct-hire citrus wages in 1988 (additional citrus workers were hired through FLCs). If large size is measured as an average annual employment of 50 persons or more, the increased concentration of employment was especially pronounced in all fruit and nut crops except berries.

TABLE 2. Farm employment and wages paid in 1988 for three California counties, by commodity (percentage change from 1984, if any, is shown in parentheses)
There was little change in the concentration of livestock employment, but the trend was toward less concentration in custom harvesting and labor contractor employment. For example, the number of large labor contractors and their wages paid fell 14%; but since FLC wages rose sharply, the declining importance of large contractors indicated that there were more small and medium-sized FLCs in 1988 than in 1984. Custom harvesters exhibit a similar fragmentation — their number increased, but there were fewer large employers.
The increased concentration of employment on crop farms and the fragmentation of employment in agricultural services did not occur in all major agricultural counties. In Monterey County, the number of large vegetable employers rose from 54 to 57, but the total wages paid by these large employers fell slightly. An explanation for this shift from hiring workers directly to hiring workers through smaller labor contractors is that the smaller FLCs offer to do work more cheaply than large FLCs or workers hired directly.
In Imperial County, a similar decrease in the number of farm employers accompanied a sharp increase in the number of FLCs. The number of general crop farm employers fell from 165 to 139, but the wages paid by these farms rose 33%. The number of farm labor contractors and the wages paid by FLCs each climbed more than 45%.
The number of grape producers in Fresno County fell by more than 250, but the wages paid by the remaining producers increased 9%. Similarly, the number of farm labor contractors fell slightly, while FLC wages rose 17%. In Fresno County, large FLCs increased their share of total FLC wages.
Conclusions
Unemployment insurance data indicate that a two-tiered farm labor market is emerging. The workers hired directly by crop and livestock farmers are being concentrated on fewer and larger farms, while employment in the expanding labor contractor sector is being fragmented among an increased number of small and medium-sized contractors. These concentration and fragmentation patterns have important implications for the evolution of the farm labor market. For example, if smaller contractors are more likely to hire recently arrived undocumented workers, as has been reported, then their increased importance may make it harder to enforce recently enacted immigration reform legislation.
Farm employment and wage patterns in the mid-1980s

