


All Issues
Update on short-duration grazing study on irrigated pasture
Publication Information
California Agriculture 44(2):8-11.
Published March 01, 1990
PDF | Citation | Permissions
Abstract
Two-year results showed similar responses to two levels of pasture accumulation-grazing utilization management. Orchardgrass height and capacitance probe readings were both useful in monitoring forage availability, but stocking rate predictions using grass height were less variable and change in grass height during grazing was more closely related to seasonal liveweight gain.
Full text
If short-duration grazing systems are to be successful, the pastures must be intensively managed and closely monitored to prevent overgrazing or understocking. The manager must determine the optimum time to start grazing, the appropriate stocking rate and length of grazing time, and the number of days needed for pasture regrowth between grazing cycles.
Knowledge of the growth-regrowth pattern of a set of paddocks in a pasture allows the manager to rotate the animals, selecting paddocks with optimum height or weight of forage available for grazing needs. We have previously described the “S-shaped” (sigmoid) regrowth curve common to most grazed forages (California Agriculture, July-August 1989). Plant regrowth is slow at the bottom of the curve, increases rapidly as plants become taller (middle of the curve), and slows at the top of the curve as plants mature. Pasture quality and palatability changes also occur over this growth sequence.
The 2-year study reported here involved two management approaches. The “high accumulation-moderate utilization” (high A-U) approach used start and stop grazing points higher on the regrowth curve than did “low accumulation-high utilization” (low A-U) management. We used orchardgrass heights to define the conditions of low or high accumulation-utilization (table 1). Stocking rates were selected to use available forage between these “in” and “out” heights over a 3-day grazing period.
The study was conducted in a research irrigated pasture at the Sierra Foothill Range Field Station. Details of pasture field and paddock layout, design of the grazing experiment, and irrigation management were given in the previous report. These conditions were kept constant over the 2 years.
In 1988, ten paddocks each were assigned to the high and low A-U treatments for the grazing experiment, which began June 1 of each year. Just before the treatments started, the paddocks were maintenancegrazed so that grazing of paddock one would begin at the desired in-height.
The animals were rotated through the paddocks at a stocking rate that would remove forage to the desired orchardgrass out-height in 3 days We used the number of paddocks in the rotation that would allow forage regrowth to reach the target inheight by the start of the next cycle. In 1988, only eight paddocks were needed to give the desired regrowth. In 1989 ten paddocks were used during cycles 2 and 3 of the fourcycle season; cycle 4 was terminated at eight paddocks because of early fall rains.
We used a stocking rate estimator based on the total animal unit (1,000 pounds of body weight equivalent) days per acreinch of forage removed (AUD/IFR) in a 3-day grazing period. By trial and error during the first year, we developed an AUD/IFR of 7.5. The stocking rate was estimated as follows:
Predicted IFR = predicted forage in-height (current height + [days to entry × height increment per day]) minus the target out-height [1]Predicted AUD = IFR × 7.5/3 [2]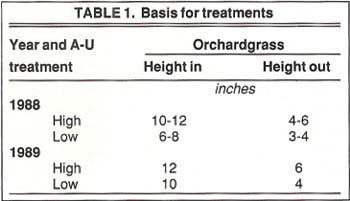
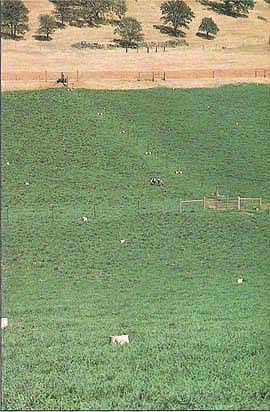
Short-duration, or intensive, grazing systems require monitoring of the pastures to ensure an appropriate stocking rate. Researchers above are examining the regrowth of irrigated pasture plants in a study paddock.
Since the average weight of the grazing animals differs from (above or below) 1,000 pounds, a correction factor (a) is required. The prediction equation for stocking rate for a 3-day grazing period then becomes:
Predicted stocking rate (SR) = IFR × 7.5/3 × a [3]For example, for an average animal weight of 650 pounds and a target IFR of 6 inches, SR=6×7.5/3×1.54=23 animals per acre.
The Gallegher single-probe capacitance meter was also used to estimate desired stocking rates. To convert the corrected meter reading (CMR) of the probe to forage weight, we used a pooled regression formula developed by Dr. Melvin George and student Marya Robbins (Y=[18.8xCMR]+380, where Y=forage pounds per acre). We then developed a stocking rate estimator for the probe based on AUD per 100 pounds weight of forage removed per acre (WFR). Intake equal to 3% of animal body weight was assumed. This estimator, 2.73 in both years, was used as follows:
Predicted WFR = predicted forage in-weight (current weight + [days to entry × weight increment per day]) minus the target out-weight. [4]Predicted AUD = WFR×2.73/3 [5]Predicted SR = WFR×2.73/3 × a [6]Following the previous example (equation 3) and using estimated forage in-and out-weights of 5,000 and 3,300 lbs, SR=17x2.73/3xa=24 animals per acre.
The between-species and between-plant variations in plant height and weight were minimized by monitoring only the uniformly distributed orchardgrass. A total of 40 heights and 200 probe readings were taken on permanent transects in each paddock before and after each paddock was grazed. We recognized that neither average whole-pasture height nor average whole-pasture forage weight was estimated by this technique, because it did not account for the variation attributable to low-growing clover or bare ground. Our objective was to compare the two indirect estimation techniques with minimum variation in how the data were collected.
The “tester-grazer” method was used to adjust stocking rate. Tester animals were maintained on the experiment throughout the grazing season; these were Hereford heifers in 1988 and English bred steers in 1989. The heifers' average initial weight was 450 pounds, with a final average weight at 96 days of 590 pounds. The steers' initial weight was 600 pounds, with a final average weight at 110 days of 710 pounds. The grazers were added and removed when necessary to increase or decrease consumptive demand to achieve the target out-heights at the end of a 3-day grazing period. The grazers maintained their A-U treatment identity throughout the experiment. Shrunk weights were taken at the beginning and end of the grazing season in 1988 and at the beginning, middle, and end in 1989. Liveweight gains per acre were calculated using tester average daily gain and grazing day totals obtained by adding grazing hours for all animals used.

TABLE 2. Botanical composition averaged for eight paddocks in the high and low accumulation-utilization treatments
Results
Botanical composition changes occurred during the three years after the pasture was planted (table 2). In the first year, pastures were legume-dominated (71%). Of the four major plant species, only perennial ryegrass percentages differed between A-U treatments. At the end of the first year's experiment, ladino clover had declined almost 30% and orchardgrass had increased by a corresponding amount. Ryegrass decreased from 10% to approximately 5% and other species increased from 1% to 3%. Ladino clover declined from 42% to 30% between September 1988 and March 1989.
A 5% increase in other species included a prominent increase in sour dock (Rumex crispus L.). This common irrigated pasture weed appeared in some of the paddocks in a pattern that suggested the seed was carried in by the irrigation water. Two of the irrigation blocks had a heavy infestation equally divided between both A-U treatments and spread uniformly throughout each paddock-that is, apparently unrelated to wet areas or poor drainage. On February 28, 1989, 2, 4-D amine was uniformly applied on all paddocks at 0.75 pound active ingredient per acre to control the sour dock. This could have resulted in the further reduction in the ladino clover percentage at the end of the second year.
There was a significant decrease in the percentage of orchardgrass and a significant increase in other species in the low A-U treatment by September 1989. The latter probably resulted from the opening up of the stand as the legumes decreased with the combination of selective grazing and low target out-heightNdashthat is, heavy grazing pressure.
Grass height patterns were similar in both years. Except for cycle 1, when an unexplained interaction occurred, both monitoring methods responded similarly in 1989 (fig. 1). Either measured grass height or probe-estimated forage weight could be used to follow relative differences in forage accumulation and utilization over successive grazing cycles.
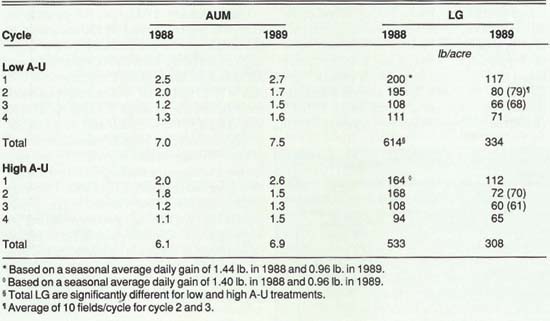
Animal unit days (AUD) per acre inch of forage removed (AUD/IFR) were nearly identical between A-U treatments in both years (table 3). However, the treatment average in 1989 (7.5) was higher than in 1988 (6.1). The average AUD/IFR for 1989 cycles 2 to 4 reflect a reduction in stocking rate made because of an overly high rate in cycle 1. The actual forage out-heights averaged 3.8 for the low A-U treatment and 5.5 for the high A-U treatment (very close to target) after this change.
The summary of AUD per 100 pounds per acre of forage removed (WFR) indicated bythe single-probe capacitance meter shows high variability for 1988 (CVs of 22% and 27%) and for the high A-U treatment in 1989 (CV=18%) (table 4). Across both years and treatments, the average CVs for AUD/IFR and AUD/WFR were 7.0 and 19.5, respectively, indicating higher variability with probe-estimated stocking rates. Probe-estimated averages for the two A-U treatments, however, were identical in 1989. This variability may have been caused in part by the partially reclining growth habit of orchardgrass. The taller plants had a higher percentage of leaves lying outside the area measured by the probe. This variability might be reduced by taking a larger number of probe readings per transect sample.
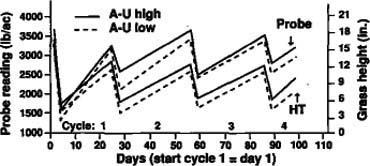
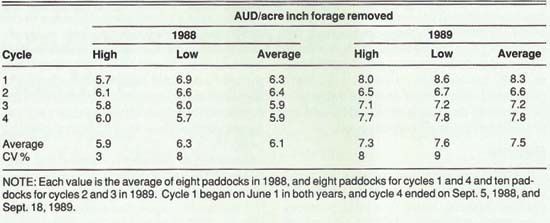
TABLE 3. Summary of AUD per acre inch forage removed (AUD/IFR) during 3-day grazing cycle and high and low A-U treatments
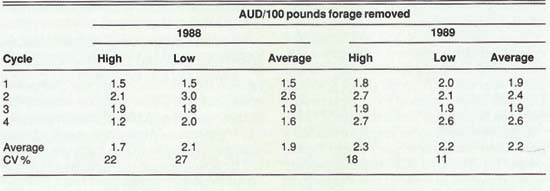
TABLE 4. Summary of AUD per 100 pounds of forage per acre removed (AUD/WFR) during 3-day grazing cycle and high and low A-U treatments
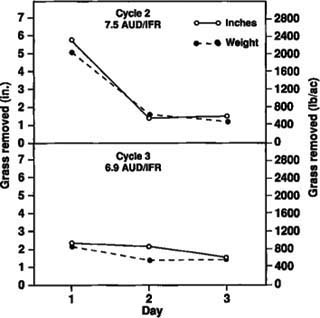
At the higher AUD/IFR value, up to twothirds of the forage was removed on the first day, and the cattle would wait by the gate on the third day ready to move to the new paddock. The lower forage intake on the second and third days could have reduced average daily gain (0.71 pound) at the midseason weight period. Forage intake was more evenly distributed after the AUD/IFR was lowered (fig. 2), and this may be reflected in the higher average daily gain (1.1 pounds) obtained in cycles 3 and 4. Obviously, there also was more total forage available in cycle 2 than in cycle 3 (fig. 2).
Comparison of pasture probe and height measurement techniques in estimating the stocking rate needed to properly graze the paddocks for 3 days showed the height measurement to be more accurate and consistent. The CVs for the height measurement were lower in 1989 than in 1988 and the actual out-heights were very close to target. Even though the accumulation-utilization patterns in figure 1 are similar for height and probe values, the required stocking rates predicted by the probe were more variable and averaged 22% lower than those predicted by grass height. On occasion, the probe-predicted stocking rates were much lower than those predicted by grass height.
Animal unit months obtained were calculated for each grazing cycle and for the season for both years. Liveweight gains per acre were calculated using tester animal average daily gain and tester plus grazer AUD (table 5). The low A-U treatment used 11 and 18 testers and high A-U treatment used 12 and 15 testers in 1988 and 1989, respectively. Numerically, the low A-U treatment was stocked 15% higher than the high A-U treatment in 1988. In 1989 this difference was 9%. Similarly, liveweight gain was a significant 15% higher in 1988 and a nonsignificant 8% in 1989. Liveweight gain in 1989 averaged 56% of that in 1988, in part because of the low average daily gain in 1989 (1.0 pound) for both A-U treatments. Stocking rates in 1989 averaged 110% of those in 1988. The lower 1989 liveweight gain probably resulted from the loss of legumes and an increase in pasture open area. Thus, in 1989, grazing pressure was higher (than in 1988) and available forage probably was less nutritious.
Conclusions
Within each year, average daily gains were nearly identical in the two forage accumulation-utilization treatments. The low accumulation-high utilization treatment resulted in higher animal weight gains per acre in both years, but the difference was not statistically significant in 1989. A lower liveweight gain per acre in 1989 resulted from a reduction in legume content and a lower forage availability. Overall, both A-U treatments probably were on the low to middle region of the regrowth curve.
The use of higher stocking rates typical for short-duration grazing and an initially patchy distribution of legume and grass created very heavy selective pressure against the legumes, which were additionally stressed by the herbicide used to control sour dock. Dallisgrass and other weedy, summer-growing annual grasses were prominent invaders in the second year.
Both the single-probe capacitance meter and orchardgrass heights adequately followed forage availability changes over the 3-day grazing and 21-or 27-day regrowth periods. The probe was less useful in predicting required stocking rates and was less well related to animal liveweight gain than was the case for orchardgrass heights. It should be borne in mind that our monitoring methods differed from those used by others.
Where pasture entry forage levels are moderate to high, the 3-day utilization profiles suggest that stocking for a 2-or even 1-day grazing period could be more efficient.
Update on short-duration grazing study on irrigated pasture

