


All Issues
Blue oaks withstand drought
Publication Information
California Agriculture 44(2):15-17.
Published March 01, 1990
PDF | Citation | Permissions
Abstract
Many blue oaks in California lost their leaves early in 1987 and 1988 after prolonged periods of low rainfall. A study found that summer defoliation had little short-term effect on growth or survival, suggesting that blue oaks are well adapted to withstand periodic droughts.
Full text
In mid-August 1987, many oak trees in California began turning brown and dropping their leaves. While most of the trees affected were deciduous species that normally lose their leaves each year, this event was unusual in that it happened about three months “ahead of schedule.” During most years, deciduous oaks don't change color until the short days and cold temperatures of November.
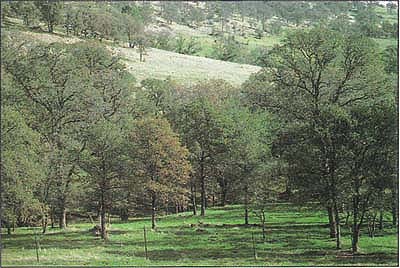
The occurrence of brown trees was widespread, ranging from southern California to the northern portions of the Sacramento Valley. Not all trees were affected, however. In general, dense stands were the most severely affected; trees in clumps or thickets began changing color while most single trees in the open remained green. It also appeared that trees in shallow, rocky soils, or on south-facing slopes, were affected more than those in valleys or swales. One of the principal species affected was Quercus douglasii, commonly called blue oak. This species occurs on vast ranges in the foothills surrounding California's Central Valley.
Because the winter of 1986-87-had been exceedingly dry (fig. 1), and there had been little or no precipitation in much of California since March, most observers felt the reason for the trees changing color so early was drought. This is consistent with knowledge of tree physiology. During drought, soil moisture becomes depleted more rapidly than usual, and by midsummer, little is available for plants. By dropping their leaves, trees greatly reduce their moisture requirements, minimizing the potentially disastrous consequences of dehydration.
Oaks have turned brown prematurely before, most recently during the drought of 1976-77. In the summer of 1976, after a dry winter, many oak trees reportedly changed color and lost their leaves early. The following winter was even drier than the preceding one, and many trees had little or no foliage during the next spring and summer. During the following winter, however, when rainfall returned to normal, most trees apparently recovered. By spring, normal growth patterns resumed, and green foliage remained on the trees throughout the summer and into the fall.

Although most oak trees that turn brown early survive and recover the following winter, the effects of drought on the trees are not known. It is reasonable to assume that severe moisture stress prompting leaf loss is not good for trees. Shedding foliage early eliminates the apparatus for photosynthesis. As a result, growth is reduced, and trees may become more susceptible to insect and disease attacks.
Since current photosynthate is also used for acorn development, the loss of foliage before acorns have fully ripened (usually in October) probably retards acorn development and maturity. This may negatively affect wildlife species that rely heavily on acorns for food. It probably also reduces the number of acorns that will become sufficiently mature to germinate in the soil and develop into seedlings.
A study was undertaken to identify some of the effects of drought on blue oak trees. The goal was to document what happens to trees in the Sierra foothills that turned brown so early in 1987 by monitoring survival, bud burst, and acorn production.
Methods
Two adjacent 100-tree plots of blue oaks were established in mid-August 1987 at the Sierra Foothill Range Field Station. these plots were selected because the oaks in them varied greatly in degree of browning from healthy looking green trees with abundant foliage to those that had turned completely brown or were bare. There were no obvious site factors such as slope, aspect, or soils to explain the differences in browning. The plots were at an elevation of approximately 600 feet and ranged in size from 0.6 to 1 acre.
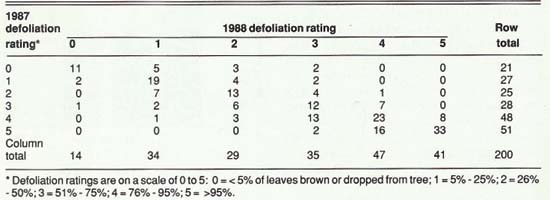
Within each plot, all trees larger than 3 inches diameter at breast height (DBH) were tagged with aluminum tags, and sequentially numbered from 1 to 100. As each tree was tagged, it was assessed for the degree of foliage browning, leaf loss, or both, and given a defoliation rating (table 1).
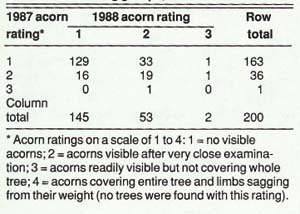
In September 1987, each tree was evaluated again. DBH was recorded and each tree was given a visual acorn rating according to a standard rating system on a scale of 1 to 4 developed by the California Department of Fish and Game for assessing California oaks (see table 2 footnote). In addition, the percentage of dead branches on each tree was recorded. Each tree was also given a dominance rating indicating whether it was suppressed, intermediate, dominant, or co-dominant.
Starting in February 1988, each tree was evaluated twice a week to determine leaf-out date and survival. Leaf-out was the date when green foliage could first be observed emerging through the bud scales.

Trees in the study plot showed extensive browning in mid-August 1987, following an extremely dry winter and little or no rain after March.
Normal rainfall patterns resumed in 1989, and the same trees were just beginning to turn brown toward the end of November.
All trees were evaluated again the following year. The rainfall season 1987-88 was also dry, and many of the trees within the plots began turning brown again prematurely, though several weeks later than during the preceding summer. In early September 1988, each tree was rated for defoliation, followed by an acorn evaluation later in the month and a leaf-out assessment the following spring. For each of these evaluations, the same rating criteria were used as in the previous year. In 1989, normal rainfall patterns resumed and all trees remained green into the fall.
Analysis
The initial analysis examined whether or not there were significant relationships between the degree of defoliation and subsequent growth and development, including survival, acorn production, and leaf-out date. Since the means of the variables were very similar for each plot, the data were combined and correlations between variables were calculated using 200 pairs of observations (one for each tree). An analysis of variance was also used to compare leaf-out date between trees from several of the defoliation groups. In addition, defoliation was correlated with DBH, the percentage of dead branches, and dominance rating to determine if size, health, or position in the stand influenced which trees turned brown early.
Since each tree was evaluated for two consecutive years, we also correlated defoliation rating, acorn production, and leaf-out data between years to find out if there was a consistent pattern in these variables over time. Cross-tabulation tables showing the number of trees in each defoliation and acorn category are provided. All differences reported as significant were at the p≤0.01 level.
Results and discussion
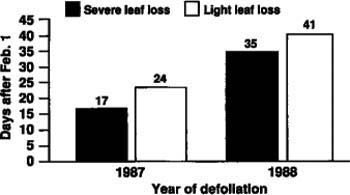
All 200 trees survived both years' defoliations and leafed out the following springs. There were marked differences in leaf-out date, however, depending on the severity of defoliation the previous summer. For both the first (r=-.43) and second year (r=-.42) there was a significant negative correlation between defoliation rating and leaf-out date. That is, defoliated trees tended to leaf-out earlier than those that remained green. The most severely defoliated trees (greater than 95% leaf loss) leafed out 7 days earlier than the least defoliated (less than 25% leaf loss) in 1988 and 6 days earlier in 1989 (fig. 2). Both of these differences were statistically significant.
There are numerous possible explanations for this surprising relationship. From an anthropomorphic stand point, one could hypothesize that trees that lost their leaves early were trying to “catch up” by beginning growth sooner. More likely, some trees were genetically more sensitive to changes in growing conditions. These trees may have responded to an unfavorable dry environment by losing their foliage, and responded to favorable spring conditions by rapidly developing new leaves. It is also possible that microsite conditions causing greater moisture stress for some trees in the summer also favored early bud burst in the spring. Perhaps those trees lost their leaves early because air or soil temperatures in their immediate environment were slightly warmer than for neighboring trees. If temperatures were also warmer the following spring, earlier bud burst could be stimulated. These trees are being evaluated for bud burst this spring to determine if these leaf-out patterns are the same after a normal rainfall year when no premature leaf loss occurred.
There was little relationship between tree size, percent dead branches, or dominance, and degree of defoliation. The only significant correlation in either year was between DBH and defoliation in the first year. In this instance, smaller diameter trees tended to have greater leaf loss, although the variability in DBH accounted for only about 5% of the variability in defoliation.
Efforts to compare acorn production with defoliation were hampered by the fact that overall acorn production was relatively low each year, with fewer than 30% of the trees having any visible acorns and no trees with a rating of 4. However, there was a significant negative correlation (r=-.27) between these variables the first year, indicating that greater defoliation was associated with less acorn production. It is possible that this relationship was even stronger than indicated, since the data may have been biased by the fact that it was easier to observe acorns on defoliated trees since the foliage did not obscure them. There was not a significant correlation the second year.
Trends
There were significant correlations between defoliation, leaf-out date, and acorn production from year to year. The strongest relationship was for defoliation (r=.87). The same trees that turned brown early in 1987 also did so in 1988 (table 1). This similarity may be due to physiological condition, microsite differences, genetic factors, or a combination.
There was also a consistent pattern of leaf-out date between years (r=.86). Trees that leafed out early the first year also did so the second. However, the average leaf-out date the second year was more than 2.5 weeks later than in the first year (fig. 2). Such a large difference in leaf-out date suggests that growth initiation and cessation in blue oaks are very sensitive to changes in environmental conditions.
The correlation of acorn production from year to year was weaker, but also highly significant (r=.32) (table 2). This supports the current view that certain trees are consistently better acorn producers in a stand, even though the actual magnitude can fluctuate greatly from year to year.
Conclusions
The results of this study suggest that summer defoliation of blue oaks from drought has little short-term impact on growth or survival. Even after two consecutive years of early leaf loss, not one of the 200 trees died. In early fall 1989, all trees were leafed out and appeared healthy with very little leaf loss. While size, dominance, or the percentage of dead branches had little relation to defoliation, trees that lost leaves early tended to leaf out early the following spring.
California's blue oaks are apparently well adapted to withstand the adverse effects of periodic droughts. It is still too early to tell if drought has longer term consequences on the susceptibility of blue oaks to insects or diseases. Plot trees will be monitored for another 3 years to evaluate these relationships.
Blue oaks withstand drought

