


All Issues
The CALeDNA program: Citizen scientists and researchers inventory California's biodiversity
Publication Information
California Agriculture 75(1):20-32. https://doi.org/10.3733/ca.2021a0001
Published online March 10, 2021
Abstract
Climate change is leading to habitat shifts that threaten species persistence throughout California's unique ecosystems. Baseline biodiversity data would provide opportunities for habitats to be managed under short-term and long-term environmental change. Aiming to provide biodiversity data, the UC Conservation Genomics Consortium launched the California Environmental DNA (CALeDNA) program to be a citizen and community science biomonitoring initiative that uses environmental DNA (eDNA, DNA shed from organisms such as from fur, feces, spores, pollen or leaves). Now with results from 1,000 samples shared online, California biodiversity patterns are discoverable. Soil, sediment and water collected by researchers, undergraduates and the public reveal a new catalog of thousands of organisms that only slightly overlap with traditional survey bioinventories. The CALeDNA website lets users explore the taxonomic diversity in different ways, and researchers have created tools to help people new to eDNA to analyze community ecology patterns. Although eDNA results are not always precise, the program team is making progress to fit it into California's biodiversity management toolbox, such as for monitoring ecosystem recovery after invasive species removal or wildfire.
Full text
The Earth is facing unprecedented threats to its ecosystems due to climate change, habitat destruction, pollution and other anthropogenic factors. With the sixth mass extinction of life upon us (see Ceballos and Ehrlich 2018), policymakers and the public need more information to address the grand challenges of how to protect, conserve and restore the health of vital ecosystems that provide food, medicines, raw materials, energy and cultural attributes essential to human survival and well-being.
In California, one of three North American biodiversity hot spots (Myers et al. 2000), 40 million people must find a way to thrive while protecting biodiversity. The economy of California, now ranked fifth in the world, relies heavily on natural resources industries; the state ranks first in recreation tourism out of the 50 states, second in seafood production, third in lumber production and has 39 mined minerals that occur in commercial quantities only in California (California Department of Conservation 2019). Inventories of California's biodiversity are needed to maintain the myriad ecosystem services residents rely on, but collecting detailed biodiversity data is costly and time consuming.
Fortunately, in the past decade there has been a rise in community-driven biodiversity monitoring integrated into public data archives (Pearce-Higgins et al. 2018) and data verification platforms (e.g., wildbook.org; Bird et al. 2014) that make data sets readily available for rigorous analysis (Hochachka et al. 2012). The motives for data collection are diverse, including self-education, which is one popular use of iNaturalist, a phone app for photographing, geotagging and identifying organisms maintained by the California Academy of Sciences (it contains nearly 318,000 species, recorded in 57,000,000 observations by 1.4 million people).

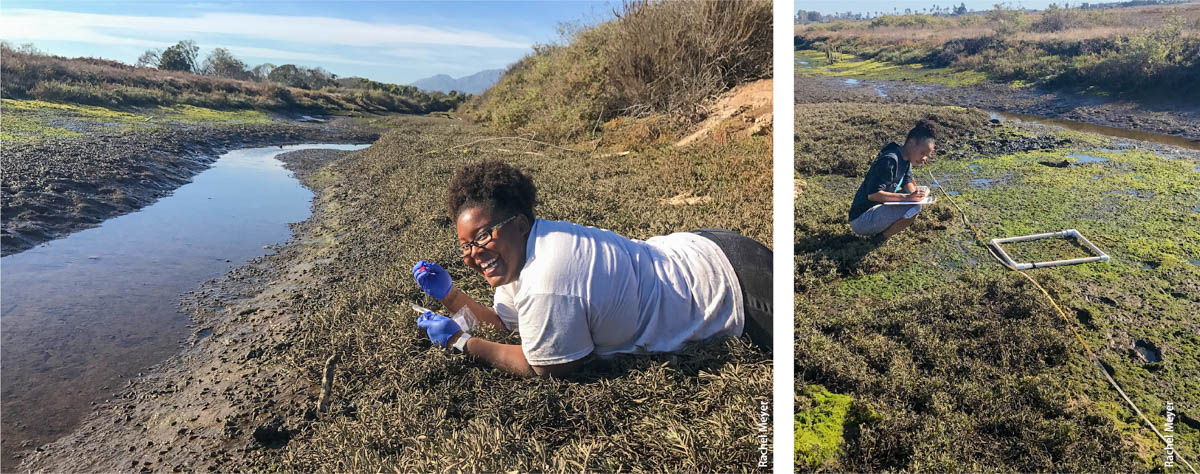
Paired burn eDNA samples from the Whittier Fire area, in the Santa Ynez Mountains, help CALeDNA researchers to track biodiversity change after wildfire.
Another motive for data collection is to help professional researchers with community-relevant research. Many of these programs build natural history museum collections and research (Ballard et al. 2017), monitor invasive species (e.g., mussels: Miralles et al. 2016; butterflies: the Pieris Project, Pierisproject.org; Ryan et al. 2019) or improve resiliency of local biodiversity resources of economic value, like fish stocks (Fairclough et al. 2014). Still, there are gaps, where closer interactions between the public and professional researchers could benefit from community-collected data (Theobald et al. 2015) and where closer interactions could bolster co-created or bottom-up participatory action research that has greater potential to address social justice challenges (Ryan et al. 2018).
Biodiversity research in California can increase the feedback loop between the public and researchers as both groups engage in data analysis and interpretation. The state has numerous world-class research institutions as well as curated living and ex situ natural history collections and 13% of the United States' colleges, with hundreds of thousands of residents already engaging with environmental sciences and research (Bureau of Labor Statistics 2019). In addition, the state has a strong naturalist certification program, California Naturalist (calnat.ucanr.edu), created by the UC Division of Agriculture and Natural Resources. Its curriculum includes participation in citizen and community science (CCS) (Merenlender et al. 2016). In 2016, the UC Conservation Genomics Consortium was launched to catalyze genomics tools and studies in California, funded by the UC President's Research Catalyst Award. As one of its activities, the Consortium aimed to capitalize on this public naturalist renaissance and available biodiversity expertise to create a program for community science and researcher-guided citizen science meant to equip people with a new biodiversity research toolkit.
Glossary
Beta diversity: Measure of diversity between areas; accounts for the number of taxa common to both areas and the number of unique taxa in each area.
Bioblitz: Hands-on, educational and fun community science activity such as a bird or wildflower survey; usually occurs in a day and often contributes to biological research, monitoring projects or research resources (e.g., iNaturalist).
DNA barcodes: Short DNA sequences of a region that vary in sequence among species and therefore can be used to match DNA to a species or strain.
DNA metabarcodes: Sequencing a specific DNA barcode region of a genome from multiple organisms within a single sample. The many resulting sequences are matched to known DNA barcodes, allowing variants to be assigned to identify species present.
eDNA (environmental DNA): DNA of organisms collected from environmental samples such as soil, air, plant surfaces or water.
Polymerase chain reaction (PCR): A technique used in molecular biology to make many copies of a region of DNA to allow for sequencing.
Voucher specimen: An organism or part of an organism, such as a plant cutting, that is preserved for scientific use and used as a reference to confirm identity. DNA barcodes are usually sequenced from voucher specimens.
CALeDNA (Cal ‘ee’ D-N-A) is a statewide community science program that the Consortium launched in 2017 to facilitate the collection and analysis of California environmental DNA (eDNA) for broad biodiversity inventory and assessment. Dozens of researchers, including students, staff and professors across California, connected online to develop a high-throughput pipeline for community science-driven habitat monitoring and characterization using molecular, DNA-based detection methods. They worked together to decide on how to collect and store environmental samples from eDNA, how to generate eDNA data, how to analyze it and how to share results with the public, in a way that would also enable comparative exploration results from different eDNA samples and grassroots projects.
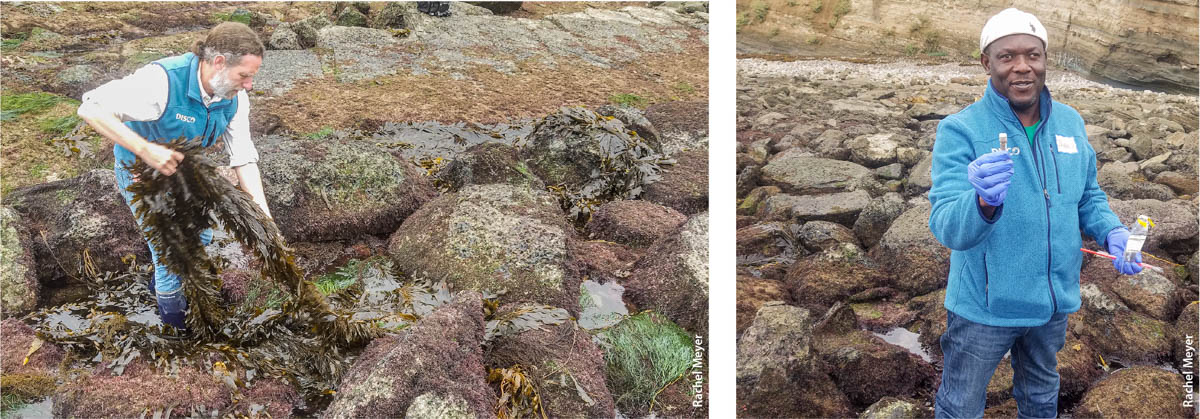
NHMLA program coordinator Dean Pentcheff, left, moves algae during low tide at Point Fermin Park in San Pedro, Los Angeles County, to uncover sediment for eDNA sampling by a Snapshot Cal Coast volunteer, right.
The workflow of the CALeDNA program enables biodiversity data collection and analysis using DNA-based technologies through a series of steps (fig. 1A). CALeDNA recruits and trains community scientists online and in-person, advertising field work events through different networks on the CALeDNA website, ucedna.com. Partnerships with groups such as California Naturalist and conservation/revitalization networks are key to recruitment. These community scientists partake in soil and sediment collection using sampling kits and a phone app, and they continue to connect with the researchers and students who process and study the samples in the lab by tracking project progress online. All participants are asked to explore eDNA results and think about how biodiversity connects to grand management questions (fig. 1B). Often, the availability of existing collections in an area inspires plans for future collections, particularly in the UC Natural Reserve System. Community scientists often propose other natural areas to sample to fill sampling or data gaps.
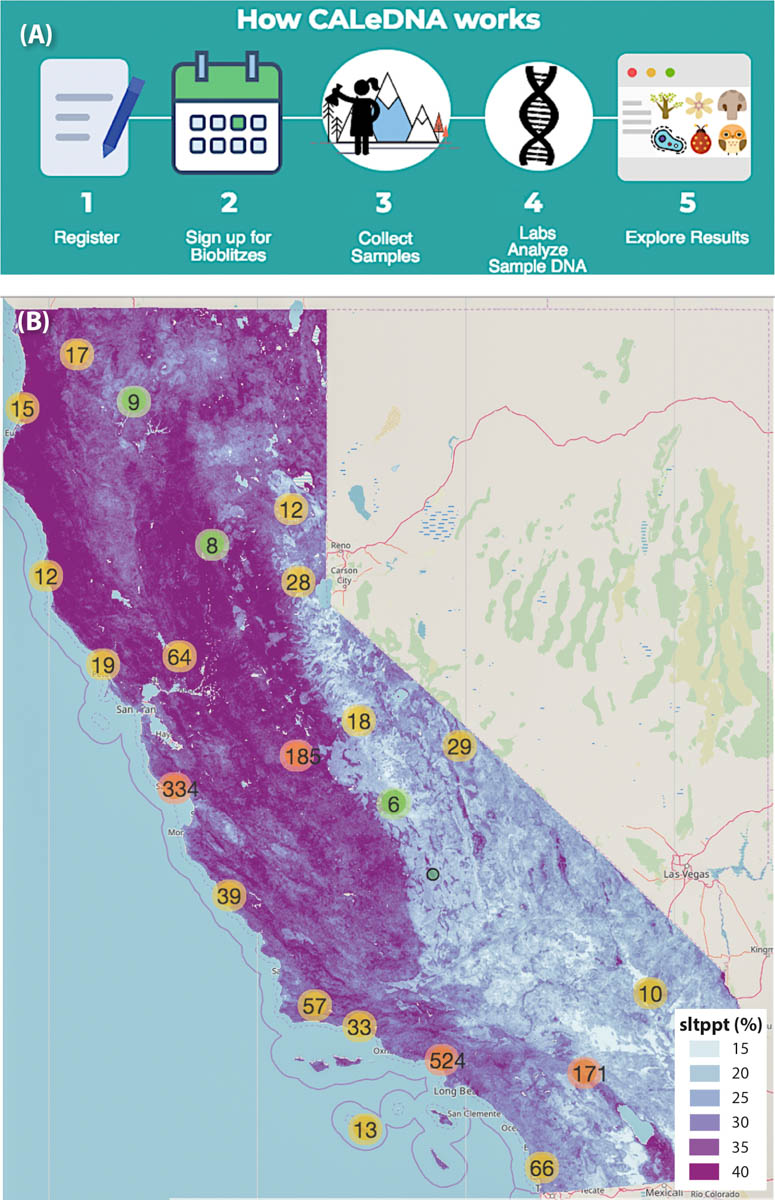
FIG. 1. Volunteers can participate in the CALeDNA process (A) by attending organized bioblitzes or by emailing a request for a kit and then collecting samples on their own. Volunteers have sampled sites in many regions of the state; eDNA results are made public as they become available so that anyone can explore them on the CALeDNA website, www.ucedna.com, and plot them (B) against different maps (such as this one, showing proportion of silt in soils, “sltppt %”) to generate hypotheses based on spatial patterns.
Diverse communities of researchers and the public have helped develop both the research questions and the functionality of CALeDNA by implementing the workflow for their own bioblitzes and eDNA research projects. From grassroots initiatives to projects funded by the state of California, DNA-based monitoring is being used in biosafety (e.g., by the California Water Quality Monitoring Council, mywaterquality.ca.gov/monitoring_council/mmw.html), in informing restoration (e.g., by the Protecting Our River project, protectingourriver.org, and the California Conservation Genomics Project) and in trials to complement or replace wildlife trawls (e.g., at the Port of Los Angeles and Port of Long Beach; Gold et al. 2019, unpublished). With eDNA and biodiversity genomics at the center, the CALeDNA community is growing collaborative partnerships with land managers, policy informers, naturalists, museums and government agencies to help realize the value of environmental samples, shared protocols and eDNA data itself to address the grand challenges of how to steward ecosystems.
eDNA metabarcoding: A different form of biodiversity monitoring
Probing eDNA for many kinds of organisms at once can help address the challenge of monitoring marine, terrestrial, freshwater and even airborne ecosystems on an ecological community level (Banchi et al. 2018; Bohmann et al. 2014; Thomsen and Willerslev 2015). All organisms shed DNA as they live and decay, and these DNA molecules can be isolated, sequenced and identified (Taberlet et al. 2012). DNA persists in surface soils and shallow sediments for variable lengths of time: mere days in the ocean (Lafferty et al. 2018), and usually for weeks or months in terrestrial environments (Barnes and Turner 2016). In all ecosystems, temperature, ultraviolet light, microbial metabolic activity and eDNA shedding rates play complex roles in the production, movement and degradation rates of eDNA (Barnes and Turner 2016; Deiner et al. 2017). Under certain conditions, like the bottom of a lake, eDNA may be protected from these physical and chemical threats and may also be sheltered from consumption by active microorganisms (Palchevskiy and Finkel 2006), leading to its persistence for thousands of years (e.g., Graham et al. 2016). CALeDNA researchers are striving to estimate what slice in space and time each local community they find in eDNA represents.
There are many ways to track species' eDNA. Some eDNA surveys are targeted, tracking a single species usually by means of quantitative PCR (polymerase chain reaction) (Biggs et al. 2015; Sutter and Kinziger 2018). However, a holistic eDNA-based inventory of a location's biodiversity is also possible and is akin to a kind of forensic reconstruction of the local organismal community (Thomsen and Willerslev 2015). This inventory involves next-generation high-throughput sequencing technologies such as with Illumina systems, or third-generation sequencing technologies such as PacBio and Oxford Nanopore Technologies, which all substantially reduce the cost of DNA sequence data and allow thousands to billions of different sequences to be retrieved in little time from hundreds of samples at a time.
Simply sequencing the DNA extracted from an environmental sample will overwhelmingly have microbial sequences. To capture more biodiversity without needing to sequence as deeply, eDNA is inventoried by “DNA metabarcoding”. Here, specific DNA regions, usually DNA barcodes, are targeted and copied from organisms in an environmental sample of mixed DNA. The copies are sequenced and matched to reference DNA barcodes that communities around the globe have generated from voucher specimens for over three decades.
Different barcoding regions of nuclear and organellar genomes are diagnostic for species in different lineages of organisms, so to broaden taxonomic biodiversity included in DNA metabarcoding surveys, multiple regions are often used simultaneously with multiplexed metabarcoding. This allows a simultaneous inventory of biodiversity across organismal kingdoms, for costs currently under $100 a sample, and likely less in the future as we optimize third-generation sequencing technologies (Hebert et al. 2018) and as sequencing prices continue to drop. For CALeDNA, typically six DNA regions are used to obtain metabarcodes from each environmental sample, yielding lists of well over 1,000 unique taxa per sample that span all kingdoms of life.
The promise of eDNA monitoring has led to its widespread development and application. It's in use in large-scale biodiversity monitoring networks, including the Group on Earth Observations Biodiversity Observation Network (GEO BON)/Marine Biodiversity Observation Network (MBON), in federal monitoring agencies, including the U.S. Geological Survey and National Oceanic and Atmospheric Administration, in local agencies such as the Southern California Coastal Water Research Project, and in research institutions, including the Natural History Museum in Los Angeles (NHMLA).
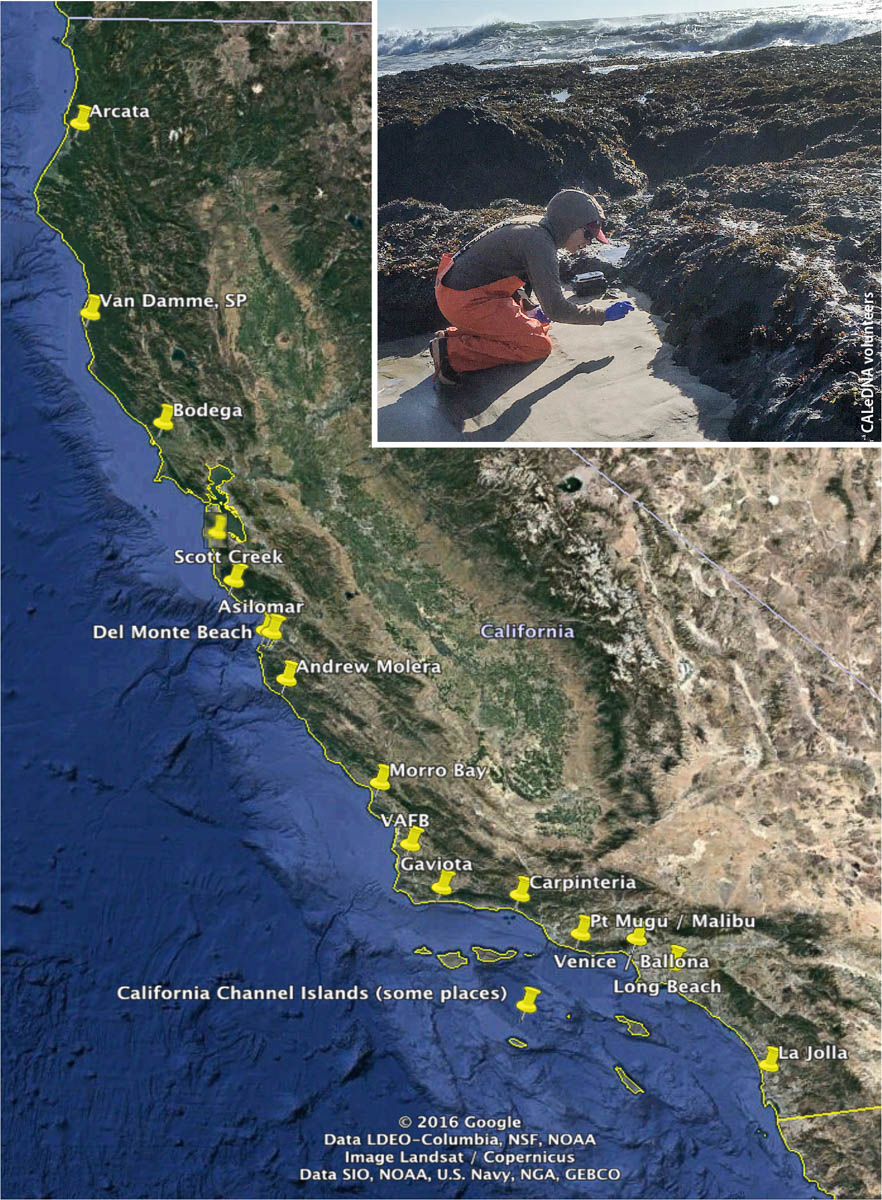
In 2017 and 2018, CALeDNA coordinated a weekend bioblitz to sample along a 1,200-kilometer span of coast from Arcata to San Diego. Inset: A volunteer collects samples at the beach.
California's research communities have pioneered DNA-based environmental assessments, such as the teams at Southern Sierra Nevada Critical Zone Observatory and the Aronson Lab (see Aciego et al. 2017) and Stanford's Center for Ocean Solutions (see Andruszkiewicz et al. 2017). Diverse researchers and resource managers have been using eDNA approaches to detect and monitor endangered species, track the emergence and spread of invasive species, and inventory biodiversity in a wide range of habitats from submarine canyons to alpine forests, demonstrating the breadth of applications of this emerging technique. Work thus far has still largely focused on water sampling or on limited groups of taxa, such as bacteria or fish.
The CALeDNA approach to inventorying biodiversity across kingdoms poses its own set of challenges. Although eDNA approaches appear to be ideally suited for intensive and taxonomically broad biodiversity monitoring programs, we've found little overlap in the taxa identified in eDNA surveys and those identified in traditional field surveys (direct observations, usually by a trained taxonomist or with tools like iNaturalist), which suggests eDNA-broad biodiversity monitoring captures other angles of biodiversity that may complement but not necessarily replace targeted surveys. The reasons for the limited overlap are many, but a lack of published reference DNA of all species certainly limits DNA metabarcoding. CALeDNA researchers are expanding collaborations to test whether the patterns of biodiversity variation over space and time that were established with traditional data are reinforced with eDNA data. The improvement of eDNA metabarcoding assays, the availability of more reference sequences, and an optimization of eDNA sampling to have the best chances of including species' DNA, will help explain how molecular methods can complement traditional field surveys (Bohmann et al. 2014; Thomsen and Willerslev 2015).
CALeDNA study sites
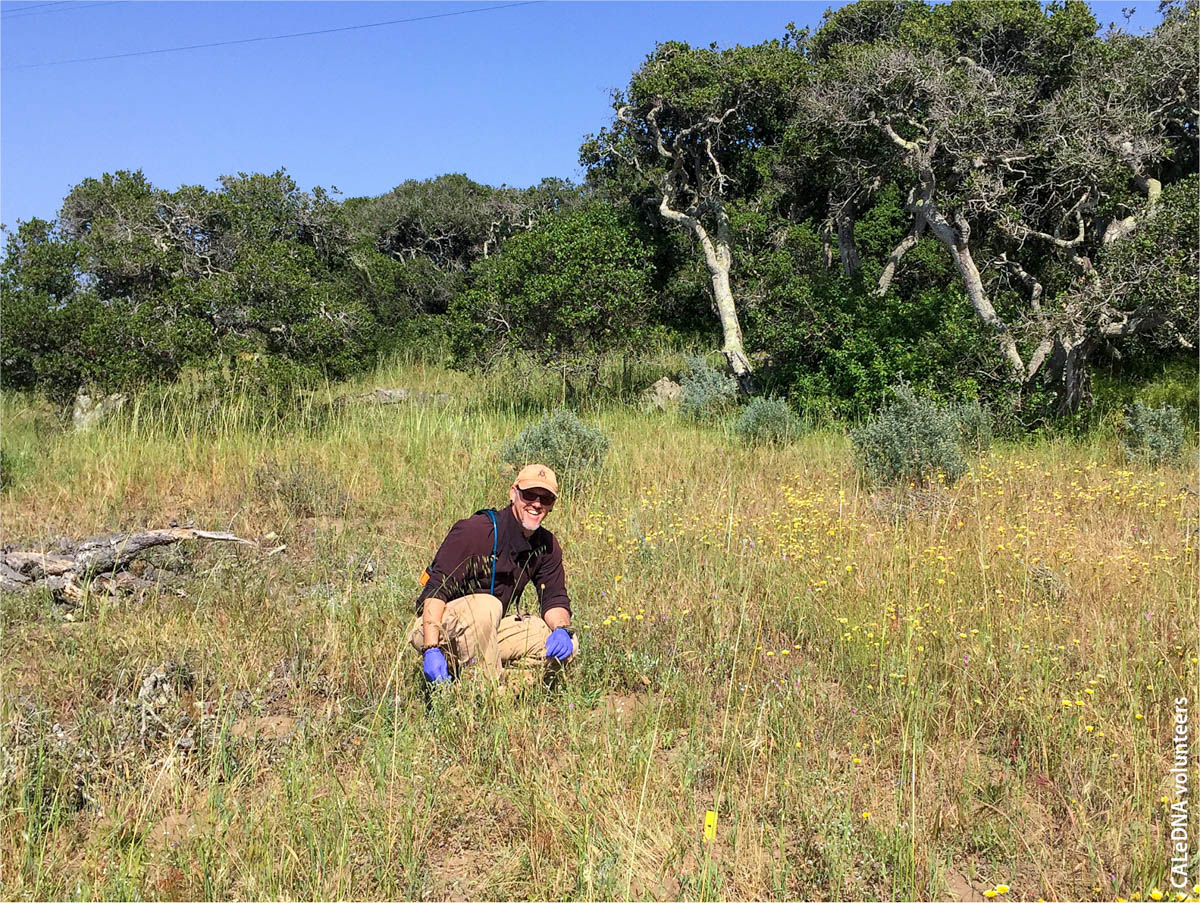
Study sites are chosen in three ways: by researchers with projects under way who need eDNA collection in certain areas or habitat, by natural areas managers who request eDNA data and can offer some funding to process samples, and by community science volunteers who email CALeDNA and offer to collect at sites. Volunteers can collect for CALeDNA anywhere they please, as long as they have proper permission, such as collection permits or written permission from a landowner. Obtaining permission to collect eDNA may take time, but it has not discouraged volunteers interested in adding an area of their interest to the CALeDNA map (fig. 1B). CALeDNA, at present, reimburses all permitting fees incurred. This can also benefit groups; for example, one volunteer, a teacher, independently obtained a permit for collecting at a local park in summer 2018 and brought the Youth Science Institute summer camp students to collect. In 2020, when stay at home orders restricted public participation in some collections, CALeDNA researchers used Go-Pros and Zoom to aid virtual participation, allowing students and public volunteers to still choose sites to sample.
At the time of writing, one-third of CALeDNA samples are from UC natural reserves. UC boasts the largest university reserve system in the world: 41 reserves totaling over 756,000 acres of land and 50 miles of coastal shoreland (UC Natural Reserve System 2020). Most of these reserves aren't open to the public, but UC researchers may visit, accompany volunteers or send volunteers to hike through and sample eDNA. The reserves are ideal for providing a biodiversity baseline for the state because they include coastal to montane biomes.
eDNA is being studied at five vernal pools on the UC Merced Vernal Pools and Grassland Reserve. Dr. Andy Aguilar (left), professor at California State University Los Angeles, talks to volunteers about fairy shrimp.
All reserves have hosted numerous traditional biodiversity surveys, and we use these to assess the extent of overlap between eDNA metabarcoding and traditional sampling, which can illuminate the bias as well as complementarity in eDNA and visual/observational surveys. The reserves offer additional abiotic data that may strengthen statistical analyses and models to describe eDNA patterns. Weather station and flux tower data are often available from reserves; such data have been used by the Institute for the Study of Ecological and Evolutionary Climate Impacts (iseeci.ucnrs.org). Since 2012, NASA has flown planes with sensors over parts of California, with priority over UC natural reserves, to collect high-resolution hyperspectral and LiDAR data that describe the abiotic and biotic features of the local environment. These data inform the design of their large Surface Biology and Geology study that includes new biodiversity observation capacity from space.
Volunteers' samples
Volunteers may join a bioblitz or sample a site on their own. In either case, they receive a sampling kit of gloves and prelabeled cryovials in bags of three, and an optional meter for collecting abiotic data (fig. 2A). Each sampling kit is used with an electronic web form for smartphones and tablets or with a paper form, where the volunteer provides critical collection metadata (fig. 2B). The metadata fields were designed to collect more information than required for current sample description standards (e.g., in NCBI's BioProject); the additional data make samples more likely to be used as a research resource (e.g., Darwin Core, dwc.tdwg.org; Global Genome Biodiversity Network, ggbn.org).
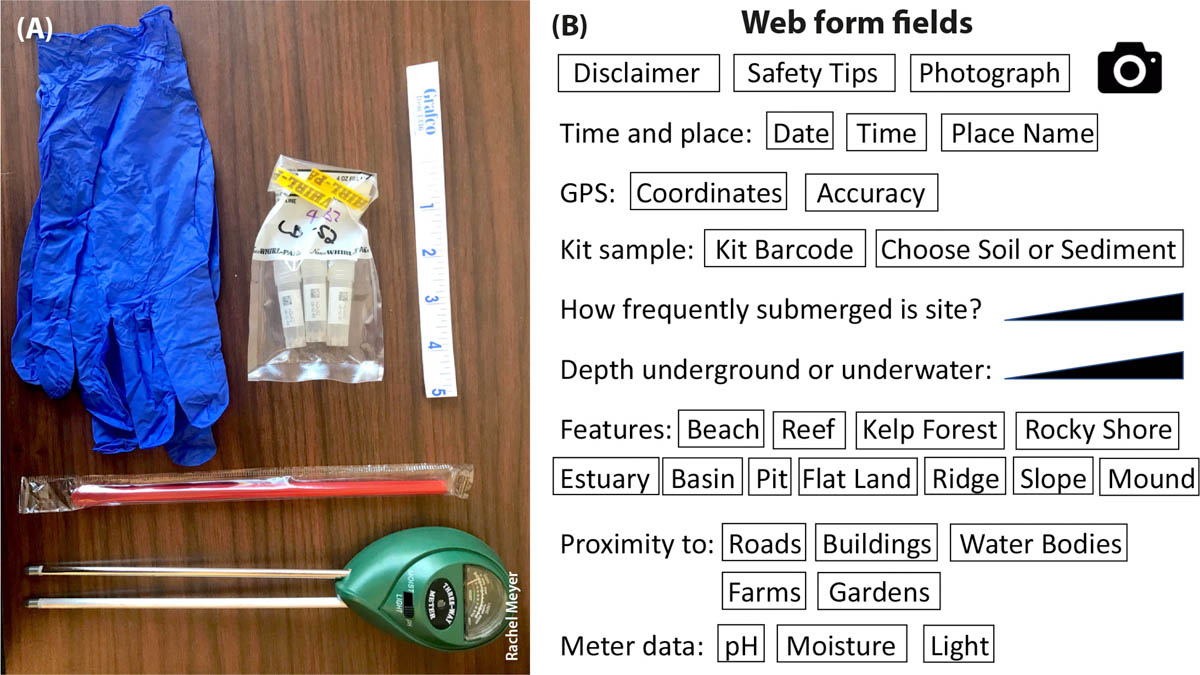
FIG. 2. (A) The CALeDNA kit includes gloves, three vials for biological replicates inside a protective Whirl-Pak bag, a straw to sample sediment or to move debris to expose topsoil, and a ruler. The three-way pH/moisture/light meter is optional and mainly used for classroom-based research and education. Collectors complete a web form (B) on their smartphone or tablet, or use a paper form, to provide important metadata for the site they are sampling.
We use the KoBoToolbox (kobotoolbox.org) platform to create the web form and curate the information. Results are backed up in real time. CALeDNA metadata needs are dynamic because of different research projects needs and because data standards continue to change. KoBoToolbox allows multiple forms to be created with the same minimum essential questions.
The eDNA archives
Each eDNA sample tube is treated as a valuable biological research collection and is archived in a −80°C freezer in the permanent Donald R. Dickey Bird and Mammal Collection at UC Los Angeles (UCLA) or in a freezer at another UC campus as part of a satellite collection. We intend for the CALeDNA samples to be used to track environmental change over the next 100 years. When samples are processed and results are published online, the physical locations of the archived samples are reported and archived as part of the sample metadata. CALeDNA became a member of the Global Genome Biodiversity Network in 2019, which means we will be sharing our collections with researchers worldwide as a public research resource.
The research collections that CALeDNA volunteers make are usually shipped with FedEx, which allows us to email shipping labels to volunteers. If the samples have not yet been frozen, we ask volunteers to keep the samples refrigerated until they are ready to ship, or to keep the samples at room temperature if they are going to be shipped within 1 week of collection. Tests have shown that freezing and thawing samples causes DNA profiles to vary, but maintaining a stable temperature helps to preserve the balance of DNA profiles (Earth Microbiome Project 2019; Thompson et al. 2017). We chose to avoid adding stabilizing buffers to the environmental samples, which may pose unknown effects to the sample integrity and limit their downstream use as research resources. Once archived in the freezer, the sample is available to be subsampled and shipped for a plethora of research purposes.
Sample collection and processing
CALeDNA staff and interns continuously generate DNA data as sample collections increase. Under current funding, we are sequencing 10% of the samples received and make these results immediately open to the public.
Sample collection involves collecting three vials from a site; these are treated as biological replicates. The replicates are thawed on ice, and a subsample of soil or sediment from each is pooled into a single tube, mixed and used for DNA extraction. Since CALeDNA is a dynamic program, our collection methods are already diversifying. For example, the Aronson Lab at UC Riverside is engineering rollers as eDNA surface collectors, along with wearable passive eDNA samplers. UCLA undergraduate interns are testing whether swabs from flowers provide enough eDNA to inventory invertebrate pollinators and the flower microbiome, with seed funding provided by the Golden Gate National Parks Conservancy. UCSC researchers are partnering with Cornell University and NASA to swab grapevine stems and leaves for biodiversity that may indicate plant health.
UCSC graduate student and expert entomologist Jon Detka hikes at UC Fort Ord Natural Reserve to collect for CALeDNA.
DNA is processed through a series of steps to generate metabarcoding libraries. Because contamination from the collector or from the lab is a common problem in eDNA research, sometimes field blanks are collected, which allow researchers to parse from the sample DNA most contaminants from the collector, equipment and supplies, and air. When extracting DNA, an additional lab blank sample is also extracted as every batch of samples are processed. Researchers use a variety of methods to informatically remove the contaminants observed as blank sequences or taxa from the study so they don't bias the analyses. The details of the DNA preparation pipeline and CALeDNA protocols can be found on our website, ucedna.com, in the “methods for researchers” space.
In brief, each barcode region we target requires three separate PCR reactions as technical replicates, which helps reduce reaction bias in the results, meaning for six barcoding regions, there will be minimally 18 reactions per sample if all are successful. Metabarcode libraries are sequenced on a MiSeq machine that generates paired reads each 300 nucleotides long, allowing us to sequence through a 600-nucleotide-long piece of DNA, which exceeds the length of most DNA barcodes. For a lengthier barcode, such as the CO1 locus, we typically sequence only a portion of it, which is usually sufficient to inventory animals (Leray et al. 2013). Each barcode region we use to probe DNA diversity in a soil, sediment or water sample is sequenced to between 25,000 and 100,000 reads.
These DNA data are processed through software in the Anacapa Toolkit (Curd et al. 2019), which was developed for multilocus metabarcoding. It combines state-of-the-art methods and is flexible enough to handle many kinds of eDNA data. The raw, unprocessed DNA data are eventually deposited in the National Center for Biotechnology Information's (NCBI's) Sequence Read Archive, while processed results and detailed metadata are shared on our website and in other long-term archiving platforms such as Dryad, datadryad.org.
Wai-Yin Kwan, who developed many CALeDNA web tools, at her first eDNA bioblitz in the Mojave Desert.
Results from each barcode region are a list of taxa and the number of sequences that matched each one in each sample. The taxa may be identified to the level of species or limited to a higher rank, such as genus or family, depending on the completeness of DNA barcode reference databases and the number of diagnostic DNA bases for that particular organism. An analysis of California coastal taxa, for example, shows 20% of organismal families still have no published DNA sequences at all. CALeDNA scientists in the Nielsen Lab at UC Berkeley are working to minimize the effects of missing data, but while matches aren't perfect, researchers manually check the results to identify errors and consider these in planning downstream research.
Despite the data gaps and limitations, plenty of biodiversity patterns can be gleaned from using the taxon lists of the best assignments we can currently obtain, or from summarizing taxa to higher levels, like family. A disclaimer on our website educates participants about the state of eDNA technology, to help prepare them to interpret that a species found is a “best hypothesis” of the true species there, given limited reference data. Many of the taxa we report, for example, are not ever found in California, and this is probably because the California species has not been sequenced, but a related species somewhere else has been. To help the public scrutinize results, we include the Global Biodiversity Observation Facility (GBIF) occurrences map on our website for each taxon under the eDNA result. GBIF is a database of all species observations and collections. Taken together, we hope online eDNA data exploration will encourage enthusiasm for biodiversity genomics, and ideas about what we may expect in the future if much more biodiversity sequencing across the tree of life is accomplished (e.g., Lewin et al. 2018).
Open data
To allow community scientists to track our progress once samples are received, we put the field data online shortly after we receive them and strive to put the sequencing results online within a month of their generation. Our impetus for committing to open data is other scientists' around the world increasingly committing to the 2014 FAIR (FORCE11.org) guiding principles for managing research data to benefit data providers and data consumers: findability, accessibility, interoperability and reusability.
There is, however, one area where we obfuscate results: endangered and threatened species. Because endangered species may more easily be poached with eDNA leads, the CALeDNA website omits the specific sites where species on the IUCN (International Union for Conservation of Nature) Red List of Threatened Species and other endangered species lists have been found.
Processed eDNA results can be shared and explored with an interactive results analysis platform called ranacapa (Kandlikar et al. 2018), which allows users to execute the same first-pass biodiversity data analyses of research projects as professional community ecologists typically do, without needing to code or learn to use advanced statistical software. Plots and statistics are produced with explanations aimed at the undergraduate level. This enables community science users to reproduce results reported by CALeDNA on the website or in scientific journals. Because data and tools are shared early in the analysis stage, community and citizen scientists may make some discoveries first, report them to CALeDNA, and through this feedback loop earn coauthorship on research publications while bringing attention to the biodiversity in areas they care about.
CALeDNA research projects
Pillar Point: eDNA, DNA, human observation
Our first bioblitz, in early 2017, was in collaboration with the California Academy of Sciences (CAS) and the NHMLA to explore a potential complementary trifecta for biodiversity monitoring: human visual observation (CAS), DNA barcode sequences from local species (NHMLA) and eDNA (CALeDNA). We chose Pillar Point, in San Mateo County, because CAS has been running monthly bioblitzes since 2012 at the Pillar Point Harbor tidepools and adjacent areas within Half Moon Bay (inaturalist.org/projects/intertidal-biodiversity-survey-at-pillar-point). Their and other observation data, along with voucher specimen records, are shared in GBIF, where we accessed it for this study.
We found considerable overlap in the monitoring results, with 127 families observed visually and by eDNA. However, this number declines at genus and species levels, suggesting both visual observation and eDNA have limitations in making correct assignments. Working closely with NHMLA, we were able to identify errors and then focus on total-biodiversity patterns (fig. 3). We created a web interface for this project to help people compare eDNA and observation data from the area (data.ucedna.com/research_projects/pillar-point).
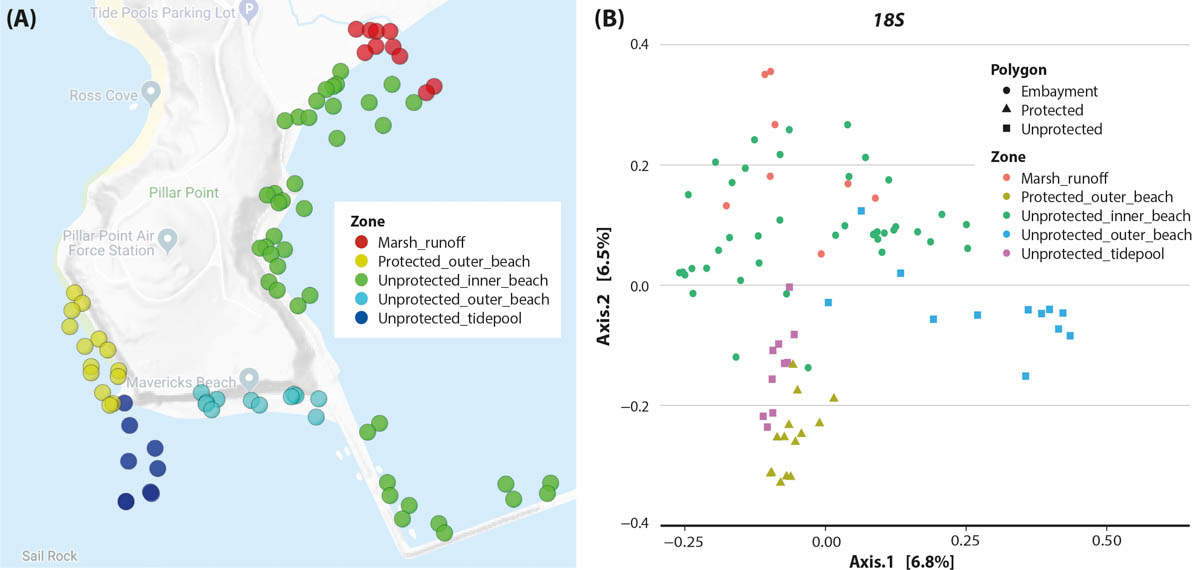
FIG. 3. (A) Pillar Point project map of sampling areas. (B) Site compositional ordination with a Jaccard principal coordinate analysis shows more similar sites plotted closer together. This analysis is a standard way to explore beta diversity across multiple samples. The metabarcoding results used were from the 18S locus that captures eukaryotic diversity. The protected outer beach and the unprotected tidepools look similar through the lens of eDNA. This suggests the tidepools, which are easily accessible, may be useful as surrogate monitoring sites to understand the outer beach biodiversity health and change.
Point Fermin: eDNA, local DNA barcoding
NHMLA runs semiannual bioblitzes as part of Snapshot Cal Coast (calacademy.org/calcoast) during low tide at Point Fermin Park in San Pedro, Los Angeles County. They take photographs and make voucher collections, which later are DNA barcoded for the CO1 region as part of the DISCO (Diversity Initiative for the Southern California Ocean) project, research.nhm.org/disco/disco.html. CALeDNA runs annual bioblitzes at Point Fermin to build eDNA collections concurrent with NHMLA specimen collections to help us assess how much eDNA results improve with very local DNA barcoding.
California macroecological patterns
From April to July 2017, a series of bioblitzes and independent community science activities in parks and reserves brought in thousands of soil or sediment samples to the CALeDNA collection. CALeDNA scientists selected 278 sites that represented latitudinal transects along forest, shrub/scrub and coastal areas. Sequencing results revealed more than 25,000 unique taxonomic entries. UCLA doctoral student Meixi Lin led the team in performing different kinds of biodiversity analyses, including zeta diversity (Simons et al. 2019), and gradient forest (Ellis et al. 2012) statistical modeling that incorporated NASA satellite data, to study which environmental factors shape local communities (Lin et al. 2020).
Coast biodiversity patterns
In 2017 and 2018, with over two dozen colleagues from UC, California State University and coastal reserves, CALeDNA coordinated a weekend bioblitz to sample along a 1,200-kilometer span of coast from Arcata to San Diego. The sample collectors iteratively collected from dune or bluff, swash, and estuary zones. The research questions, led by Drs. Dannise Ruiz and Michael Dawson at UC Merced, are testing whether classic theories of terrestrial and marine biodiversity patterns, which were developed with macrobiota such as animals, stand with eDNA-based microbial unicellular and macrobiotic multicellular inventories. Results thus far show that eDNA biodiversity follows expected patterns along the California coast.
eDNA in vernal pools
Vernal pools are temporary wetlands, filled by substantial rainy seasons, snowmelt or groundwater. The pools host many California endemic species with special adaptations to pool depth, morphology and geochemistry. CALeDNA researchers from the UC Merced lab of Dr. Jason Sexton are studying eDNA of five vernal pools on the UC Merced Vernal Pools and Grassland Reserve to build a more comprehensive taxon inventory. Hundreds of volunteers from California Naturalist programs and the UC Merced Carson House supported the bioblitzes. Preliminary results suggest that when we see an eDNA signal of endemic endangered plants that only sporadically emerge, such as Colusa grass (Neostapfia colusana), it forecasts their emergence in the pools that year.
Invasive grasses, species patterns
Invasive plants alter the community composition of fungi (Hawkes et al. 2006), plants (Gaertner et al. 2014) and microbiota (van der Putten et al. 2007) in the systems that they invade. The Fort Ord Natural Reserve has supported multiday bioblitzes that have added nearly 200 samples to the CALeDNA collection with associated metadata of which sites have invasive grasses. UC Santa Cruz (UCSC) graduate student Sabrina Shirazi is identifying associations between invasive grasses and the rest of the community by examining microbiota detected with eDNA. Dense sampling at reserves like Fort Ord, which has a mosaic habitat of forb, shrub, native or invasive grass-dominated, and tree-dominated land, provides the critical data for developing hypotheses about species patterns that we can test more generally with statewide CALeDNA data.
Lagoon biodiversity and stress
Dr. Tiara Moore, while pursuing her Ph.D. in the Fong Lab at UCLA, worked with CALeDNA to bring community scientists to Carpinteria (Santa Barbara County) and Upper Newport Bay (Orange County) to sample sediment from different areas of lagoons. She used eDNA to inventory community species and track their responses to environmental stress related to formation of macroalgal blooms dominated by sea lettuce (Ulva spp.). To accomplish this, she combined eDNA metabarcoding with the GeoChip 5.0 (Glomics, Norman, Okla.), which quantifies the presence of more than 22,000 genes involved in stress response and ecosystem functioning. Her findings, in preparation for publication, detail the metabolic processes in the eutrophication of lagoons.
Dr. Tiara Moore, left, samples eDNA along a lagoon to inventory community species and track their responses to environmental stress. A volunteer, right, helps count organisms using traditional ecology methods.
Burn sites, plant resilience
California has experienced an increase in wildfires and wildfire burn intensity, which have devastated areas that are normally spared as climate refugia, such as wetlands. CALeDNA community science volunteers and UC undergraduate classes began sampling paired burned and unburned sites in late 2018, and continue to resample sites that were affected by fire. In 2019 and 2020, we have increasingly received samples from many UC students and UCNRS staff to archive the soil in burned areas, like items in a time capsule, so they may be used for future wildfire ecological research.
The many samples have enabled CALeDNA researchers to track biodiversity change after fire and to identify plant-microbe networks (fig. 4) that may help explain the resilience of some California native plant species to fire disturbance. Data sets are being used by CALeDNA staff in undergraduate education modules, and by students for their own research. UCLA undergraduate Eric Beraut (now alumnus) used Klamath Mountains postfire eDNA samples, collected by volunteer initiative, to quantify how much the time since the last wildfire predicts soil fungal diversity.

FIG. 4. Ecological co-occurrence networks can be made using multilocus metabarcoding data. Habitats that experienced wildfire up to 12 years ago are co-analyzed using all markers (16S, 18S, fungus ITS1 “FITS”, plant ITS2 “PITS” and CO1). Focusing on plant-fungal interactions (the PITS and FITS only plot), we found that Ceanothus thyrsiflorus, a fire-responsive plant (Davis et al. 2010), was associated with Rhizopogon, a fungus also known to be fire responsive (Glassman et al. 2015). Source: Eric Beraut.
Desert eDNA
UC's Burns Piñon Ridge Reserve and Anza Borrego Reserve, as well as the Wildland Conservancy's Pioneer-town Mountain Preserve, and Center for Natural Lands Management's Thousand Palms Oasis, have hosted eDNA bioblitzes to describe and compare biodiversity in desert ecosystems. Community scientists, including John Frazier from Friends of the Desert Mountains, have contributed substantial collections to CALeDNA. Results have revealed first observations in the United States of exciting single-celled eukaryotic extremophiles and desert-adapted bacteria and provide rich records of invertebrate occurrences, including hard-to-observe taxa such as tardigrades. We are developing deeper collaborations with desert nature reserves to monitor invasive species and track habitat restoration processes.
eDNA methodology study
The Shapiro Lab at UCSC has tested how different approaches in preparing eDNA libraries influence results, which will help us improve methods to make CALeDNA research more efficient and reduce costs and technical bias. The lab's results have identified enzymes that amplify DNA with less bias (Nichols et al. 2018). Graduate student Sabrina Shirazi has recently completed a study to determine how few PCR replicates and how little sequencing depth are needed to assign an unknown sample to a site in California (Shirazi et al. 2020). This work will be instrumental in helping researchers do high-throughput processing of CALeDNA collections to detect habitat change over time.
eDNA undergraduate studies
In microbiology classrooms
In winter 2017, CALeDNA began a partnership with the UCLA Microbiology, Immunology, and Molecular Genetics (MIMG) department on its Course-based Undergraduate Research Experience (CURE) curriculum. CUREs have been demonstrated to provide a more inclusive avenue for students who might not otherwise have the opportunity to participate in research (Auchincloss et al. 2014). The MIMG CURE is a two-quarter research immersion curriculum in which upper-division undergraduates work in teams to formulate and test their hypotheses regarding soil microbial ecology, using eDNA and traditional bacterial cultivation methods (Shapiro et al. 2015). Graduate students doing related eDNA research visit the classrooms, which we hope encourages undergraduate students to consider scientific careers.
With the CALeDNA sample collection kits and eDNA analysis tools, CURE undergraduates have compared the soil microbiomes of California native and invasive plant species, natural and managed ecosystems, and studied the effects of human impact and burning on microbiomes. The partnership between CALeDNA and MIMG has also inspired graduate students and instructors to spearhead the development of eDNA and microbiology analysis tools, such as ranacapa (Kandlikar et al. 2018) and PUMA (Program for Unifying Microbiome Analysis; Mitchell et al. 2018). Several MIMG students have joined the CALeDNA labs as research interns.
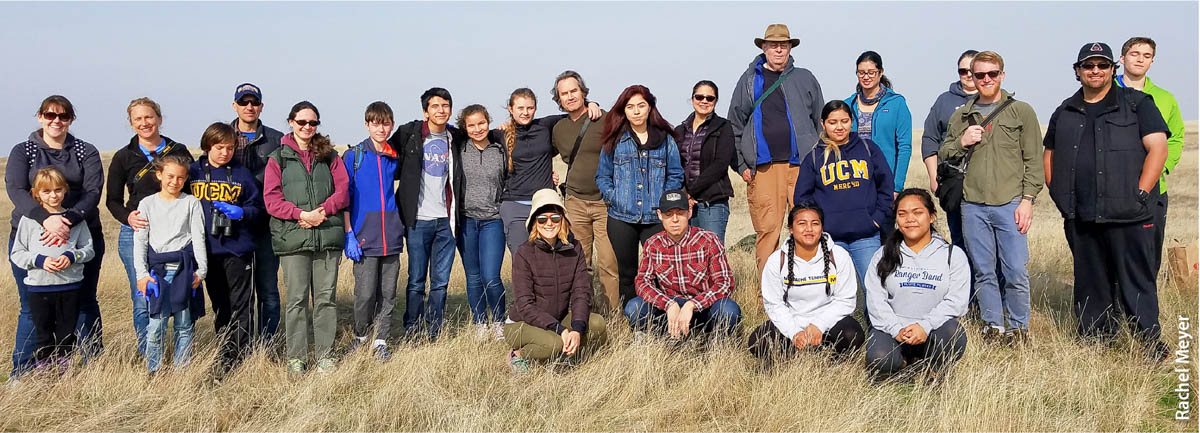
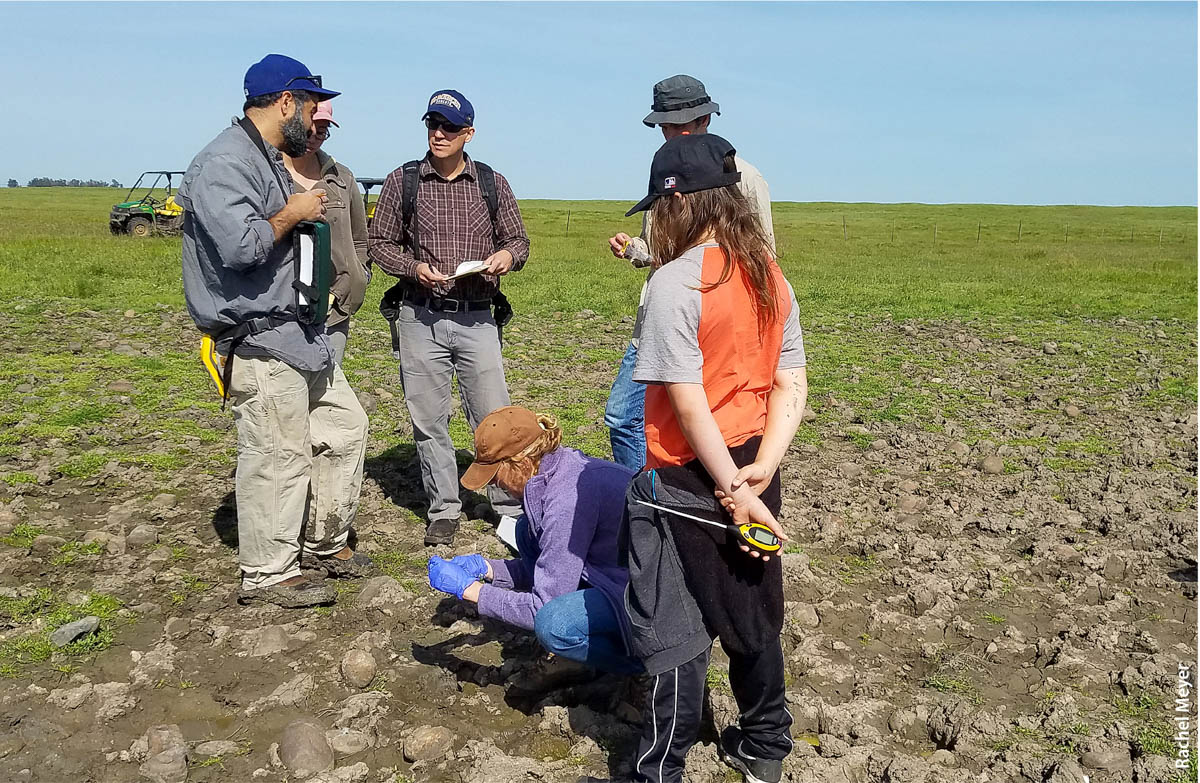
Group photograph of volunteers in Merced after sampling grasslands.
eSIE project
In 2018, the Howard Hughes Medical Institute (HHMI) funded a novel project, eSIE (Environmental DNA for Science Investigation and Education), led by professors Bob Wayne (UCLA) and Beth Shapiro (UCSC). This program aims to educate and encourage undergraduates to enter STEM fields through field-based and flipped learning courses, workshops and research, with eDNA providing entrée into the diversity of natural and social sciences. California's DNA: A Field Course, an introductory course for first-year students and transfer students, debuted in fall 2018. Biodiversity in the Age of Humans, a five-credit course, debuted on both campuses in spring 2019. Four postdocs, Kim Ballare, Chloé Orland, Ana Garcia-Vedrenne and Maura Palacios Mejia, are improving the course content and publishing it for others to implement (Garcia-Vedrenne et al. 2020).
In summer 2018, we launched annual short-term CALeDNA Summer Research Institute sessions, in the Santa Monica Mountains and in Santa Cruz, on the UCSC campus. They were open to UCLA and UCSC undergraduates and students at two California State University campuses: Los Angeles and Dominguez Hills. Activities were designed to prepare participants for beginning research projects in molecular labs. UCLA and UCSC are offering 10-week paid summer research internships for students to work on eDNA with many different faculty (through 2022 with HHMI support).
Building a stronger eDNA community
We hope to make breakthroughs in what community and citizen scientists can do by inviting them to participate in all parts of the research process. We are continuing to build resources for diverse groups to use CALeDNA results and connect with university researchers through our web interface and bioblitzes.
Several of our team members participate in working groups, facilitated by the Southern California Coastal Water Research Project, to build an eDNA projects map of California, which will grow out from the CALeDNA web tools. Seed funding from the Metabolic Studio foundation is helping CALeDNA work across nonprofit organizations and government agencies to plan bioblitzes and data analysis strategies that more directly integrate with social community values. Through these grassroots projects, we're developing ideas for what an eDNA science and technology center should look like: a place where the public has a physical and virtual space to engage in eDNA research and innovation. We are currently soliciting feedback on how CALeDNA may serve the community and how eDNA science may inform policy.
In the next phase of the program, we will tie CALeDNA into the Earth BioGenome Project (EBP) (Lewin et al. 2018). EBP is a “moonshot” to sequence the genomes of all eukaryotic species on Earth. There are approximately 9,000 eukaryotic taxonomic families on Earth and at least 35,000 species in California. By partnering with DNA barcoding and genome sequencing initiatives, CALeDNA can overcome weaknesses in diagnosing taxa with DNA metabarcoding, and, in turn, will provide information on where unsampled species occur so that they may be sampled for EBP collections. We are also using our experience organizing public bioblitzes to design genome collection events for EBP, including partnership work with NHMLA's Urban Ocean Expedition. In this next phase, we will work with EBP to advance ethical policies around eDNA and genomic collections as well as data management.
The future will require a tremendous task force of community scientists, naturalists, observers, local scientific societies, biological collections and information curators to help eDNA work lead to concrete findings and translate to new solutions. We echo the messages of Biggs et al. (2015) and Buxton et al. (2018) that eDNA for community and citizen science projects needs investment in research coordination and volunteer support. An engaged public will be able to translate big biodiversity data into innovation if it is sufficiently detailed, systematically collected, relatable and accurate. Research scientists also need to have more opportunities to step out of insular communities and the grind of rapid research to listen to different communities who share a connection to their research sites.
CALeDNA's projects in the first year were not easy, and often frustrated volunteers, because protocols were not yet optimized around participants' experience. For instance, initially participants were tasked to collect too many samples with too many conditions and too little of the preplanning needed to be successful while having fun (after all, bioblitzes are usually on the weekend). We reduced the number of samples needed to fulfill a collection kit from six to one, and substituted some of the preplanning needs by collecting more metadata during sampling through our KoBoTools app. This has helped us retain volunteers because they have an enjoyable outdoor experience. Further, having learned from our shift to more virtual engagement because of the COVID pandemic, we are investing more effort in developing online participation that meaningfully connects volunteers and research scientists after sampling completes, rather than emphasizing the bioblitz experience.
As researchers who are committed to attributing work appropriately, while working with the public on a level that is new for many of us, we recognize there is a huge need for new ways of showing contribution to a research publication that are more considerate of community and citizen scientists. New progressive journals, such as Advanced Genetics (Wiley), are paving the way, crediting contributors who play more diverse roles than traditional authors. Giving credit is critical, especially when we use community-collected data in research publications (Theobald et al. 2015; Ward-Fear et al. 2020).
Citations
The CALeDNA program: Citizen scientists and researchers inventory California's biodiversity

