


All Issues
Agricultural managed aquifer recharge — water quality factors to consider
Publication Information
California Agriculture 74(3):144-154. https://doi.org/10.3733/ca.2020a0020
Published online October 20, 2020
PDF | Citation | Permissions
Abstract
The resilience and productivity of California's agriculture is threatened by groundwater overdraft, reduction in aquifer water quality, increased land subsidence damage to infrastructure and an irreversible reduction in groundwater storage capacity. Intentionally flooding agricultural fields during winter — a practice referred to as agricultural managed aquifer recharge (AgMAR) — can help counteract overdraft. However, the potential for AgMAR to exacerbate nitrate/salt leaching and contamination of at-risk aquifers remains a critical concern. To quantify the risk of groundwater contamination with AgMAR, we took 30-foot-long soil cores in 12 almond orchards, processing tomato fields and wine grape vineyards on low- and high-permeability soils, measured nitrate and total dissolved solids concentrations and calculated stored nitrate-N. Wine grape vineyards on permeable soils had the least nitrate leaching risk observed. However, almond orchards and tomato fields could be leveraged for AgMAR if dedicated recharge sites were established and clean surface water used for recharge. Historical land use, current nitrogen management and soil permeability class are the main factors to consider before implementing AgMAR.
Full text
Agricultural managed aquifer recharge (AgMAR) is a concept in which farmlands are leveraged to capture legally and hydrologically available flood flows to recharge groundwater (Kocis and Dahlke 2017). In semi-arid regions, including much of California, there is great interest in AgMAR among water management and conservation districts. Although California contains some of the most productive agricultural regions in the United States, with over 400 crops, 9.8 million acres of cropland and $46 billion in agricultural output (CDFA 2018; USDA NASS 2017), much of the state is severely water limited. Many growers rely on groundwater to meet their irrigation needs, especially during drought years, when surface water is less available.
Groundwater supplies 40% of total water demand in California during nondrought years, and demand for groundwater is increasing as perennial crop acreage, such as almonds, increases (DWR 2014; Massoud et al. 2018). From 2005 to 2010, the Central Valley aquifer experienced between 5.5 and 13 million acre-feet of groundwater overdraft, and, in many locations, groundwater levels declined more than 100 feet below previous historic lows, driven by the 2007–2009 drought (DWR 2014).

Flooding agricultural fields can help recharge depleted aquifers. Of the three crops the authors studied, wine grapes grown on highly permeable soils had the least risk for nitrate leaching.
These water challenges are expected to increase in the coming decades as climate models predict more variation in average precipitation, resulting in earlier snowmelt, more precipitation as rain, increased frequency of extreme events, including droughts and floods, and earlier and more extreme runoff events (Thorne et al. 2012). Some of these changes are already apparent in the observational record, including a larger fraction of annual precipitation falling in a smaller number of more intense events (Russo et al. 2013). It is imperative that California's water infrastructure be able to capture and convey sufficient water to meet municipal, agricultural and environmental water needs.
In 2014, California passed the Sustainable Groundwater Management Act (SGMA) in response to dropping groundwater levels exacerbated by the 2012–2016 drought. The aim of the legislation was to maintain adequate groundwater resources in perpetuity. SGMA mandates that groundwater sustainability agencies, responsible for 95% of statewide groundwater pumping, develop and implement plans for critically overdrafted groundwater basins to achieve sustainable groundwater use by 2040. These plans will provide new opportunities for groundwater recharge and storage.
Traditional recharge methods such as dedicated infiltration basins and injection wells are usually costly, time consuming to construct and spatially limited. For those reasons, and because there is a large amount of irrigated cropland acreage available in California, many water management and irrigation districts are considering AgMAR as a more cost effective and potentially higher impact form of groundwater recharge than traditional methods. Additionally, AgMAR has many potential benefits, including increasing water tables, which would decrease pumping costs for growers, flushing salts from the root zone, mitigating subsidence and increasing groundwater storage capacity, which could act as a buffer through future droughts.
Recently, the California Department of Water Resources (DWR) established a research advisory committee to develop expertise to aid in the expansion of AgMAR. The Kings River Conservation District plans to enroll 16,000 acres, with the capacity to divert 500 cubic feet per second of flood flows, potentially diverting 30,000 acre-feet of water monthly (Bachand et al. 2016). To assist planners and water agencies in targeting appropriate lands to implement AgMAR, O'Geen et al. (2015) developed the Soil Agricultural Groundwater Banking Index (SAGBI), which identifies potentially suitable agricultural land for AgMAR based on NRCS (USDA Natural Resources Conservation Service) digital soil survey data. SAGBI determines soil suitability based on five factors: deep percolation, root zone residence time, topography, chemical limitations (such as salts) and soil surface condition. These five factors were used to classify lands into six categories ranging from “very poor” to “excellent.” Absent from SAGBI, however, are the factors of historical land use and current management practices, which deserve consideration before implementation of AgMAR.
Only a few pilot studies of AgMAR, limited to collaborative research projects between UC Davis, local water management and conservation districts, environmental consulting companies and landowners, have been conducted (Bachand et al. 2016; Dahlke et al. 2018). However, although small, those studies (on alfalfa, tomatoes, wine grapes, almonds and pistachios) found promising results for AgMAR in terms of its cost effectiveness, scaling potential, capacity for increasing groundwater storage and compatibility with grower operations.
Effects on groundwater quality
Uncertainty remains on how AgMAR efforts could impact groundwater quality. Residual contaminants, such as nitrates (NO3−), from historical fertilizer applications (i.e., legacy contaminants) could be mobilized and transported to groundwater. AgMAR could also mobilize salts present in the vadose zone of agricultural fields, the unsaturated portion between the surface and the water table; and, if the groundwater is already contaminated, AgMAR could also mobilize contaminated pore water left in the vadose zone by falling groundwater levels.
Contaminants may also be moving past the root zone as a result of poor fertilizer management in a current season. Crop nitrogen (N) use efficiency varies across crop type, soil type, fertilizer application method and irrigation practice, with plants typically taking up less than 50% of N applied and the rest leaching below the root zone (Tomich et al. 2016). Additionally, inorganic fertilizers and manure provide N in the form of salts, such as sodium nitrate, ammonium chloride or ammonium sulfate. These salts, combined with naturally occurring salts and salts from irrigation water, increase residual total dissolved solids (TDS) in the soil pore water and could leach to the groundwater.
Harter et al. (2012) quantified nutrient loading to groundwater in the Tulare Lake Basin and the Salinas Valley from various agricultural crops and other sources, such as septic systems, animal corrals and manure storage lagoons. In total, the study concluded that 215,000 tons N/year is leached from cropland to groundwater, accounting for 94% of all NO3− leaching in the study area. Furthermore, they estimated NO3− leaching intensity by crop, with vineyards leaching, on average, 31 pounds N/acre/year, tree crops leaching 80 to 90 pounds N/acre/year and vegetables leaching over 90 pounds N/acre/year (Harter et al. 2012).
In the Central Valley, three significant regulatory programs have been implemented to regulate groundwater quality: the Central Valley Dairy General Order, the Irrigated Lands Regulatory Program and the Central Valley Salinity Alternatives for Long-Term Sustainability. All three programs necessitate groundwater quality monitoring and development of management plans to reduce contaminant discharge to groundwater. With efforts under way to increase groundwater recharge on agricultural land, understanding the effect of AgMAR on NO3− and salt leaching and the risk of increased groundwater contamination is essential for growers to benefit from this practice while remaining in compliance with regulations.
To determine the potential risk of NO3− and salt leaching under AgMAR, we analyzed soil core data from 12 fields, with significant differences in soil texture and crops, within the Kings groundwater subbasin. Our goal was to quantify the potential risk of groundwater contamination from legacy and current concentrations of NO3− and TDS that different cropping systems and soils could pose under AgMAR. The study focused on three common specialty crops — almonds, processing tomatoes, wine grapes — and two different soil groups — low- and high-infiltration soils. Our two central hypotheses were (1) vadose zone chemistry is affected by crop type and land management and (2) soil infiltration characteristics affect residual NO3− and TDS concentrations in the vadose zone and overall leaching potential.
Kings subbasin
The study area is within the Kings groundwater subbasin west of Fresno, which was designated as critically overdrafted by DWR in 2014. Depth to groundwater in the basin is 20 to 220 feet, with an estimated annual decrease in storage of 288,000 acre-feet based on changes in storage from 2003 to 2014 (KRCD 2014). DWR determined that 20% of wells sampled were above the 10 milligrams nitrate–N (NO3−–N)/liter and 16% were above the 500 milligrams TDS/liter recommended drinking water quality standard (SWRCB 2018).
The subbasin is characterized by fertile, alluvial soils supporting over 500,000 acres of irrigated land. Fresno County grows a diversity of crops with a gross total value of $6.58 billion (CDFA 2017). In this study, we targeted the three specialty crops with the largest acreage, which are in the top 10 agricultural commodities in the area: almonds, processing tomatoes and wine grapes.
Soil cores, analysis
Replicate cores (n = 3) were collected to 30 feet in depth in fields planted in almonds, tomatoes and wine grapes, and representing two different NRCS hydrologic soil classes: Class A and Class C/D. Class A soils are defined as having low surface runoff potential and a relatively high saturated hydraulic conductivity, greater than 5.67 inches/hour (USDA NRCS 2016); Class C soils have moderately high surface runoff potential and relatively low to medium saturated hydraulic conductivity, of 0.14 inch/hour to 1.42 inches/hour. Class D soils have a high runoff potential and a low saturated hydraulic conductivity, of less than 0.14 inch/hour.
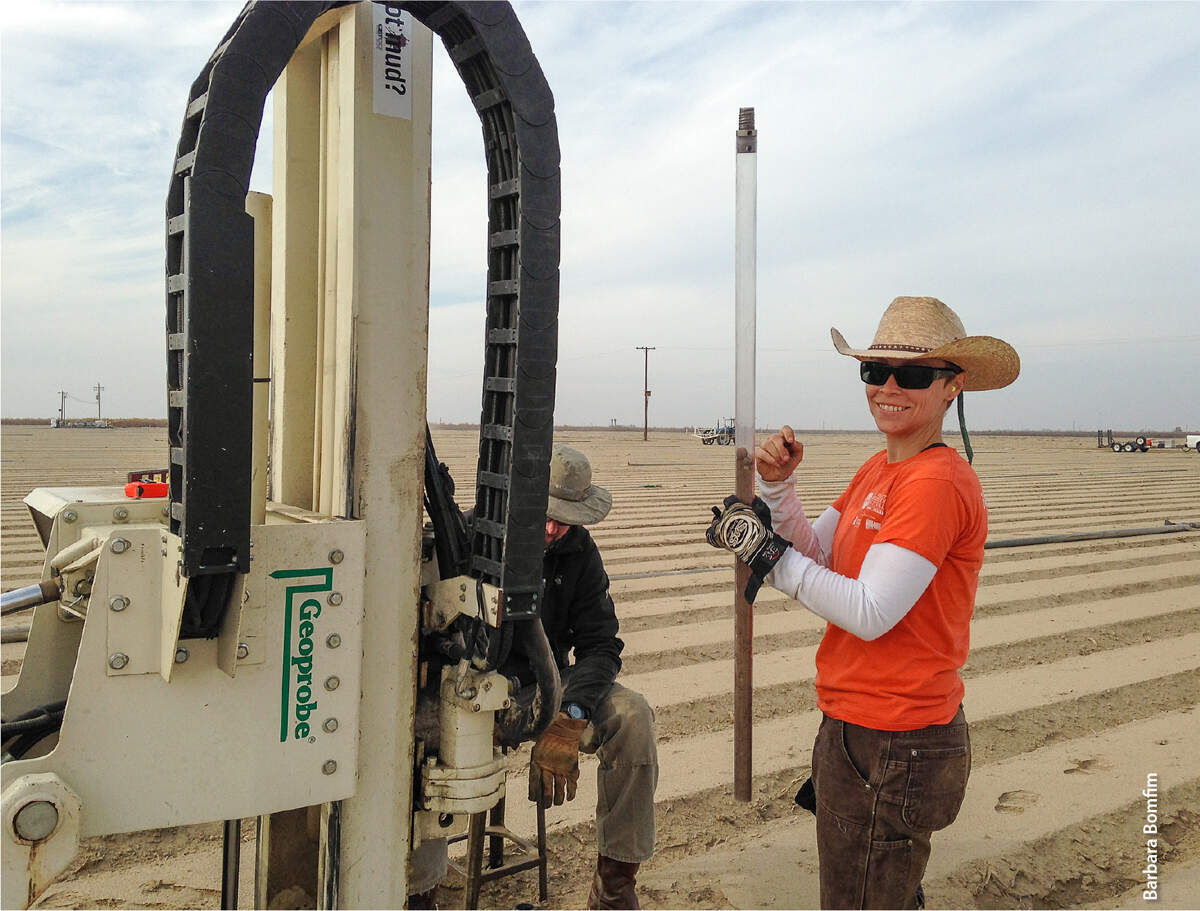
A Geoprobe push-drill system was used to collect soil cores to 30 feet in depth in fields planted in almonds, tomatoes and wine grapes in the Kings groundwater subbasin.
Class A soils correspond to SAGBI soils rated as “excellent,” “good” and “moderately good,” whereas Class C and Class D soils correspond to “very poor,” “poor” and “moderately poor.” C and D soils were included in this study because in farmland situations — especially in orchard and vineyard systems, which were considered in SAGBI — they are often deep tilled to remove restrictive soil horizons and to increase infiltration and deep percolation (O'Geen et al. 2015).
A total of 36 soil cores were collected with the following sampling scheme: three cores from each of the three crops and two soil classes with two field replicates. The cores were collected from six farms in total, not uniformly distributed by grower but collected based on field accessibility. Cores were taken with a Geoprobe push-drill system (Geoprobe Systems, Salina, Kansas) and analyzed in the lab for soil NO3−–N, texture, water content and salts. Stored NO3−–N was calculated on a per-acre basis considering the entire 30-foot profile.
Farm practices survey
Grower surveys were conducted to understand historical and current agricultural management practices, including previous cropping systems, irrigation practices and amount, and fertilizer sources and amount of N applied (table 1).

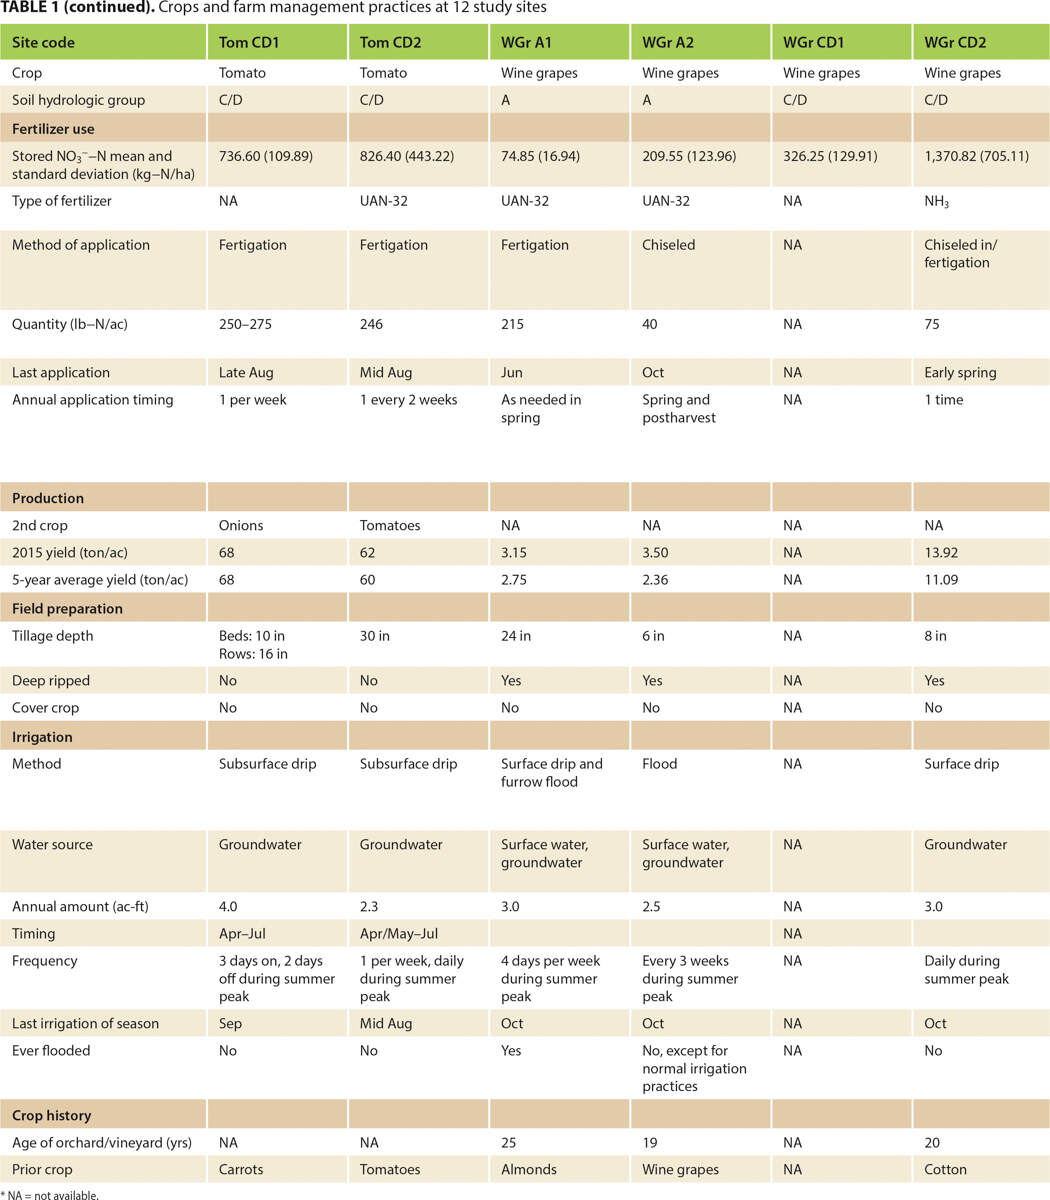
Annual applied N loads and irrigation amounts in almonds ranged from 180 to 300 pounds N/acre and 3.0 to 3.9 acre-feet water applied; in tomatoes, 50 to 275 pounds N/acre and 2.3 to 4.0 acre-feet of water applied; and in wine grape systems, 40 to 215 pounds N/acre and 2.5 to 3.0 acre-feet of water applied. Most sites used microirrigation systems such as buried drip irrigation or microsprinklers; however, a few sites still used flood irrigation.
Soils effects on NO3− distribution
Soils vary in their ability to convey water and solutes to the vadose zone, and ultimately groundwater, and thus will behave differently under AgMAR. We found that C/D soils had significantly higher stored NO3−–N (732 pounds N/acre) than A soils (542 pounds N/acre) across the entire 30-foot profile (fig. 1). The same pattern was found in the root zone only (0 to 3 feet), with C/D soils having statistically higher stored NO3−–N (291 pounds N/acre) than A soils (164 pounds N/acre). However, no statistical difference was found between soil classes below the root zone (3 to 30 feet), as the classifications are applicable only to 3.0 to 6.6 feet.

FIG. 1. (A) Mean stored NO3−–N (lbs/ac) with standard error bars shown (n = 36) and (B) TDS concentrations (mg/L) with bars representing range of data (n = 36) by soil class at varying sections of the profile: across the 30-foot profile, within the root zone (0 to 3 feet) and below the root zone (3 to 30 feet). Letters represent significant differences (p < 0.05) between soil classes within each section.
Class A soils may be well suited for conveying large amounts of recharge water to an underlying aquifer due to their high infiltration rates, but these soils tend to be more prone to NO3− loss below the root zone during normal irrigation events (Bergström and Johansson 1991). These coarser-textured soils are also associated with lower microbial biomass and thus lower fertility compared to finer-textured soils (Chau et al. 2011). Together, these factors may lead to overfertilization of A soils, and over many growing seasons higher rates of NO3− loss to the vadose zone and a greater impact on underlying groundwater than with C/D soils.
In contrast, C/D soils are characterized by low infiltration rates and low permeability due to their higher clay content, so they hold more water and thus retain more NO3− in small pores (Thomas 1970). These finer-textured soils are also associated with higher microbial biomass and often higher fertility, with the potential for less N inputs, if budgeted for, and lower compounding rates of overfertilization (Chau et al. 2011). However, they may be less suitable for conveying large amounts of water to the underlying aquifer.
With efficient methods of irrigating (drip and sprinkler), water movement and NO3− leaching below the root zone are limited. During AgMAR events, however, the infiltrating water can bring soils quickly to field capacity, allowing for faster water flow and movement of the stored NO3− into deeper depths, as the soil macropores are activated (Harter et al. 2005; Jarvis 2007; Thomas 1970). Both classes of soil have distinct challenges with respect to mitigating NO3− loss, necessitating specific growing season nutrient management guidelines tailored to soil type prior to an AgMAR event, as well as careful management of the flooding event. To minimize NO3− contamination of groundwater, further studies (table 2) are needed on how the amount and the frequency of floodwater applications affect NO3− movement in contrasting soil types.
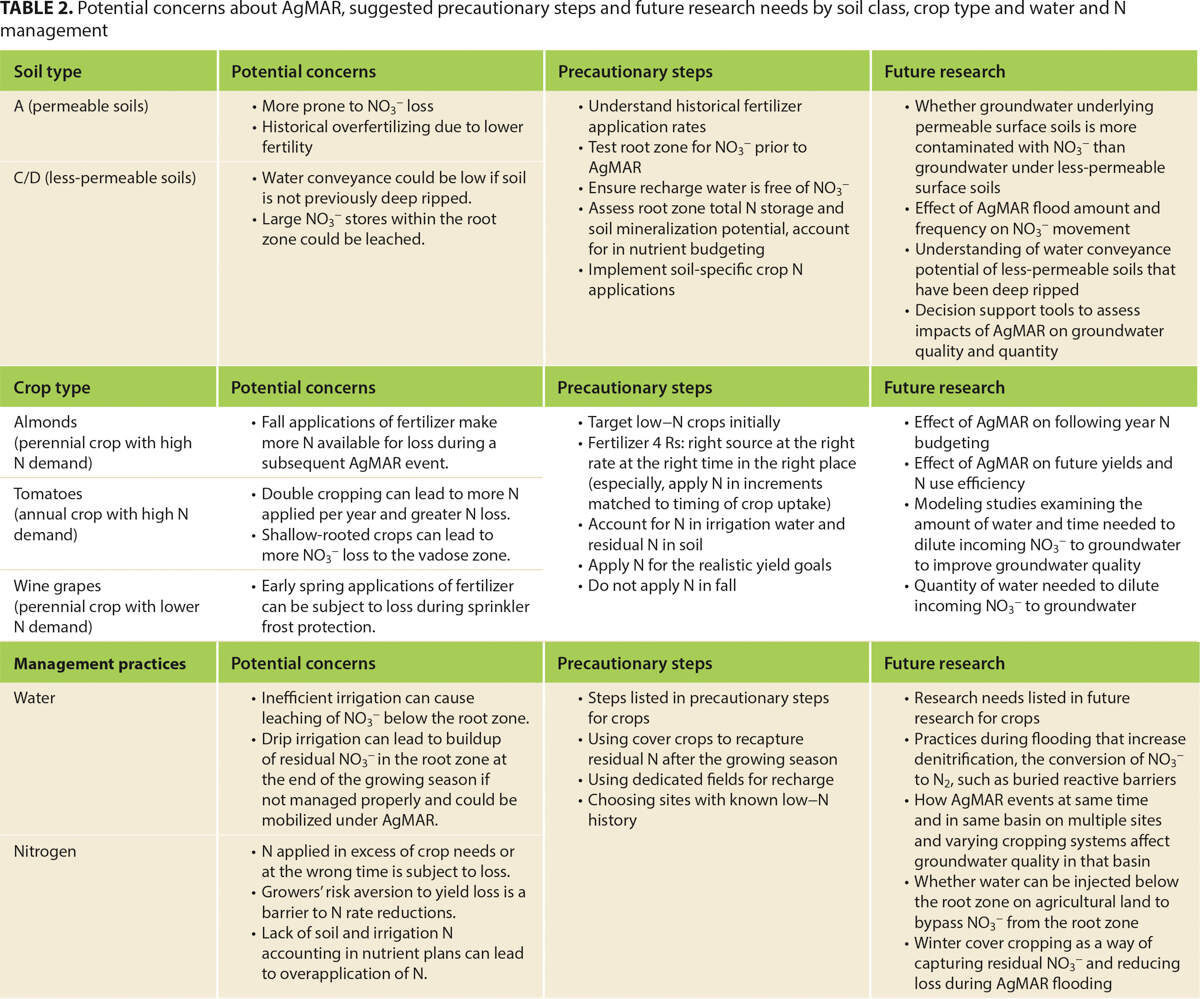
TABLE 2. Potential concerns about AgMAR, suggested precautionary steps and future research needs by soil class, crop type and water and N management
Crop effects on NO3− distribution
Crop systems vary in their nutrient and water use efficiencies and requirements, which affects the concentration of NO3− in the vadose zone. It's essential before implementing AgMAR to understand the complex set of variables that interact to affect NO3− leaching and to target those crops with the lowest NO3− footprints.
While NO3−– N concentrations decreased with depth across both soil classes and all crops, 17% of all samples were above the 10 milligrams NO3−–N/liter EPA drinking water quality limit, a majority of which were below 3 feet (fig. 2). We found that mean stored NO3−–N in almond (740 pounds N/acre) and tomato (729 pounds N/acre) cropping systems were significantly higher than in wine grape (442 pounds N/acre) cropping systems throughout the entire 30-foot profile, with no significant statistical difference between almonds and tomatoes (fig. 3A). Within the root zone (0 to 3 feet), wine grapes (182 pounds/acre) had statistically lower stored NO3−– N than tomatoes (269 pounds/acre); however, no statistical difference was found between wine grapes and almonds (164 pounds/acre), or almonds and tomatoes. Below the root zone, the same pattern as the entire profile was observed, with almonds and tomatoes having significantly higher stored NO3--N than wine grapes. In summary, we found that land use at the surface affects the nitrate footprint in the vadose zone.
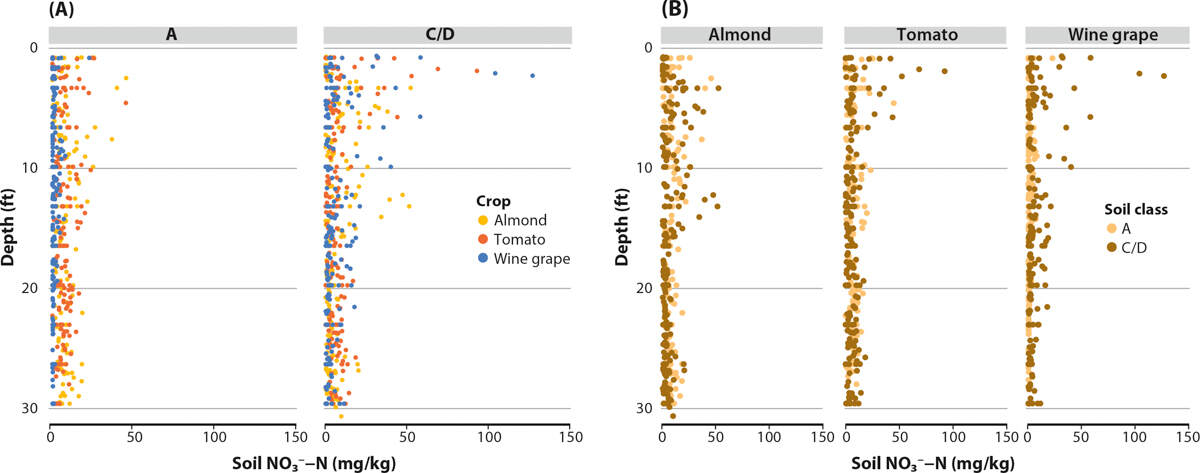
FIG. 2. Soil NO3−–N profiles (ug NO3−–N/g soil) down to 30 feet by (A) crop and (B) soil class (n = 1,058).
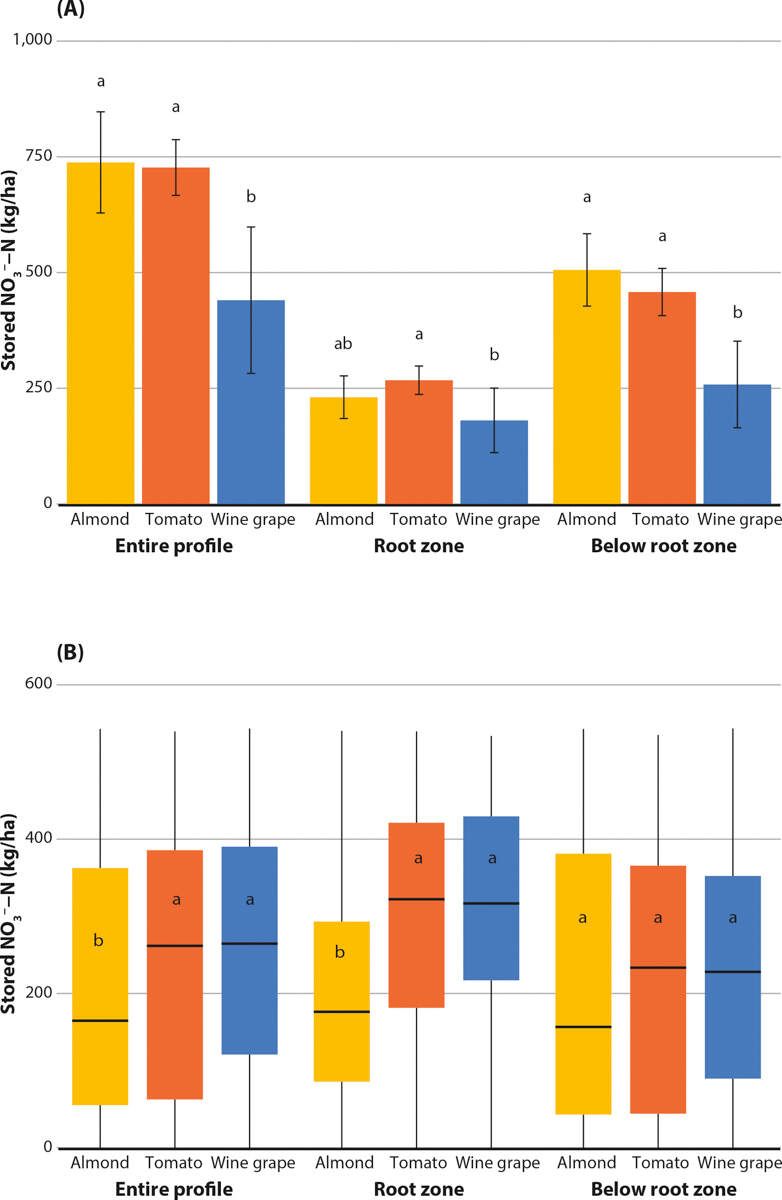
FIG. 3. (A) Mean stored NO3−–N (kg/ha) with standard error bars shown (n = 36) and (B) TDS concentrations (mg/L) with bars representing range of data (n = 36) by crop at varying sections of the profile: across the 30-foot profile, within the root zone (0 to 3 feet) and below the root zone (3 to 30 feet). Letters represent significant differences (p < 0.05) between crops within each section.
Cropping systems have unique nutrient and water requirements that need to be considered in relation to AgMAR. For example, almonds are generally fertilized in multiple applications, including a fall application. This practice should be avoided or delayed if AgMAR is to be implemented. Similarly, annual cropping systems, such as tomatoes, allow for double cropping, which can intensify the yearly N load to the land surface and over time compound the legacy NO3− in the vadose zone. Furthermore, annual crops have shallower rooting systems compared to perennial crops, making them more prone to NO3− loss to the vadose zone below the rooting depth. Wine grapes require protection from frost in early spring, which is achieved by sprinkler irrigation; however, applications of NO3− from fertilizer during this time could be subject to loss. These practices may need to be adjusted under AgMAR (table 2).
Rooting depth and water/nutrient uptake could also influence the depth of NO3− leaching (Dzurella et al. 2015). From our results, wine grape cropping systems, with low N inputs and deep roots (5 to 6.5 feet, Smart et al. 2006), were found to have the lowest amounts of N stored in the vadose zone and therefore would be the crop with the least NO3− leaching risk among the three crops we studied. Deep-rooted crops extend the zone for recapturing NO3− and more efficiently reduce the amount of NO3− lost to the vadose zone, perhaps explaining the differences seen below the root zone between the wine grapes and the almonds and tomatoes (Machado and Oliveira 2005). This finding is consistent with the UC Nitrate Groundwater Pollution Hazard Index, which rates wine grapes lower on the hazard index due to the crop's deep roots and low N inputs (Dzurella et al. 2015).
TDS concentrations differed significantly across cropping systems (fig. 3B). Comparing the 30-foot profiles, almonds had the lowest TDS concentrations, with a median value of 166 milligrams/liter, whereas tomatoes and wine grapes had the highest TDS concentrations, with median values of 259 milligrams/liter and 264 milligrams/liter, respectively; there were no significant differences between wine grapes and tomatoes (fig. 3B). Within the root zone, the same pattern existed: almonds showed lower TDS concentrations (176 milligrams/liter) than tomatoes (322 milligrams/liter) and wine grapes (316 milligrams/liter). However, TDS concentrations below the root zone did not show significant differences between cropping systems, indicating that the significant differences found for the entire profiles were influenced by root zone TDS. A potential reason for the TDS differences found between cropping systems could be the fertilizer source, especially those fields which historically used or currently use manure, which contain relatively high levels of salts. Other sources could include irrigation water. However, the reasoning is speculative, as we did not have enough data to test this hypothesis.
Total TDS stored in the entire profile for almonds, tomatoes and wine grapes were 66,000 pounds/acre, 62,000 pounds/acre and 64,000 pounds/acre, respectively. Only 7% of TDS concentrations in our study were above the California State Water Resources Control Board's (2017) recommended secondary maximum contaminant level of 500 milligrams/liter, with almonds, tomatoes and wine grapes having 29, 22 and 20 samples, respectively, above the recommended level.
When considering AgMAR, choosing cropping systems that have the lowest potential for NO3− and TDS loading to the underlying aquifer is an important consideration. These cropping systems could be targeted first as more research on AgMAR and water quality is conducted. Well established practices to increase N uptake and reduce NO3− loss should be emphasized; such as the fertilizer “4 Rs” (right source of fertilizer, at the right rate, at the right time, and in the right place), accounting for N in irrigation water and residual N in the soil and adjusting fertilizer inputs accordingly, fertilizing for realistic yield goals, and not applying nitrogen in the fall should help reduce N loss under normal conditions and under AgMAR management. Furthermore, using surface water that is relatively free of NO3− for recharge on dedicated fields could dilute the incoming NO3− to groundwater, even in systems with higher NO3− footprints such as almonds and tomatoes (table 2). Future research should focus on the effect of AgMAR on future yields and N use efficiency, on the N budget of the following growing season, and the quantity of water needed to dilute incoming NO3− to groundwater. Modeling studies could be well suited to assist groundwater sustainability agencies in determining the timing and quantity of NO3− reaching groundwater under AgMAR in varying cropping systems and the effect on groundwater quality.
Management effects on NO3− distribution
While this study did not examine the effect of specific agricultural management practices on NO3−occurrence below the root zone, we did find that NO3−-N varied by grower, and a hierarchical mixed-effects model determined that individual farms accounted for the largest portion of the variation in the NO3− data (table 3). This suggests that management practices, such as irrigation management, fertilizer type and fertilizer application amount, timing and frequency, are the most important variables in affecting NO3− losses below the root zone and suggest opportunities to adjust management to reduce leaching.

Between the two sampled almond sites on C/D soils, there was a significant difference in mean NO3−N storage down to 30 feet (fig. 4A). While the reasons behind this difference are speculative, we observed that the farm with the lower stored NO3−–N in the 30-foot profile (Alm CD2) had higher yields and potentially higher N use efficiency than the other farm (Alm CD1), which applied a similar amount of N but had half the yield, indicating the importance of adjusting N applications to realistic yield goals (table 2).
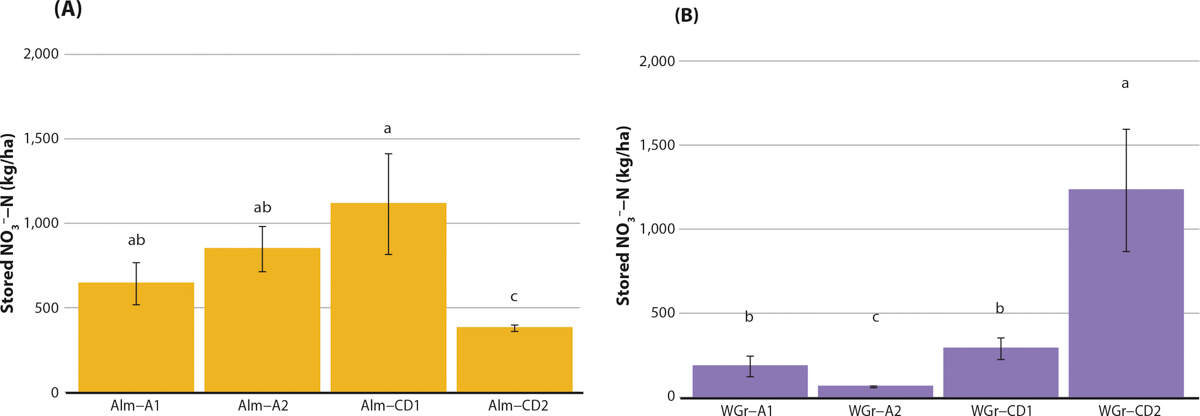
FIG. 4. Mean stored NO3−–N (kg/ha) by grower in (A) almonds and (B) wine grapes across the 30-foot profile. Error bars are standard errors. Letters represent significant differences (p < 0.05) between growers within each section.
Differences in NO3− were also found in the wine grape cropping systems, with WGr CD2 having statistically higher levels than all other farms, highlighting the importance of the impact of individual management on NO3− leaching (fig. 4B). This site differed from the other sites in that N fertilizer was applied all at once at the beginning of the season, whereas the other sites fertigated their fields, allowing for better dosage and timing of N availability to crop N demand, potentially increased N use efficiency, and mitigating NO3− loss below the root zone (Bar-Yosef 1999). Identifying which management practices lead to increased N use efficiency is imperative under normal irrigation management and in the context of AgMAR. Further studies are needed to examine the relationship between specific agricultural management and the effect on NO3− footprints in the vadose zone.
Furthermore, N fertilizer type, rate and method of application, type of irrigation system and amount of water applied in semi-arid and arid climates affect losses of NO3− below the root zone (Bar-Yosef 1999; Karandish and Šimůnek 2017; Kirchmann and Bergström 2001; Klocke et al. 1999). NO3− leaching was found to be higher in sprinkler-irrigated systems than drip-irrigated systems, with more residual NO3− in the root zone at the end of the season in the drip system (Barakat et al. 2016). Residual NO3− in a cropping system could be recaptured by a cover crop or accounted for in the following growing season's nutrient budget, improving the N efficiency of the system. Testing for root zone N after a growing season could be implemented prior to AgMAR to help decide whether the site is suitable for AgMAR or if a site with lower residual N would be more appropriate.
Establishing dedicated AgMAR sites for “clean recharge,” using water with a low NO3− concentration such as snowmelt or rainfall runoff from the Sierra Nevada, may mitigate the impact on groundwater quality of the legacy NO3− and residual root zone NO3− (Harter and Dahlke 2014). Bachand et al. (2014) estimated that 39 acre-feet of high-quality, low-salinity surface water would be needed to move 2.25 pounds TDS per square foot through the vadose zone into the groundwater (assuming a mean electrical conductivity of 1 decisiemen/meter), and an equal amount of recharge would be needed to return the groundwater to its original background concentration. Assuming NO3− leached below the root zone behaves similarly to salts, application of low–N surface water could have similar impacts on NO3− concentrations in groundwater.
However, the timing and amount of high-quality surface water needed until groundwater dilution is achieved depends on the initial groundwater quality and management history of the site in relation to N lost below the root zone, and thus the land use and history of the site should be taken into consideration. In a Washington Orange orchard in Riverside County, Pratt et al. (1972) found 100% of soil NO3−–N concentrations were above the 10 milligram NO3−–N/liter drinking water quality standard set by the EPA. Similarly, Lund et al. (1974) found high levels of soil solution NO3−–N under a manure disposal site in Southern California, previously cropland, where beef feedlot manure was disposed of for 4 years, with all soil solution NO3−–N concentrations above 10 milligrams NO3−–N/liter. In contrast, Harter et al. (2005) found only 10% of soil NO3−–N concentrations were above the drinking water quality standard in a nectarine orchard in Fresno County. These legacy NO3− differences could be attributed to differing land use and management practices and the history of the site, which have important implications for the selection of groundwater recharge sites. Estimating both historical and current N mass balances could be one approach to understand the NO3− footprint of that particular site and the risk it poses to groundwater quality under AgMAR management.
Loss of NO3− from the root zone under AgMAR is a concern for growers and other stakeholders with regards to potential reduced yields and water quality. This concern represents a barrier for growers wanting to implement AgMAR on certain soils and with certain cropping systems while remaining in compliance with the Irrigated Lands Regulatory Program's waste discharge requirements. Furthermore, there is potential to compound the NO3− leaching problem if NO3−, which could have been accounted for in a grower's nutrient management plan, is lost below the root zone during AgMAR, and must be added as an additional external N fertilizer input the following growing season after AgMAR has been implemented. Strategies that reduce N applications (including nutrient management budgets that account for soil and irrigation water NO3−), improve the timing between N availability and crop N demand, improve N use efficiencies, promote conversion of NO3− into less harmful forms such as dinitrogen gas, and recapture residual NO3− in the root zone (i.e., cover cropping) should be implemented to reduce NO3− leaching below the root zone and mitigate additional NO3− leaching under AgMAR (table 2). Ultimately, careful N management leading up to an AgMAR event, combined with dedicated recharge sites, could reduce the risk of NO3− leaching.
AgMAR going forward
AgMAR is a promising practice for replenishing California's groundwater after decades of overdraft. However, historic NO3− buildup in the vadose zone and current rates of NO3− loss below the root zone represent a potential threat to groundwater quality and a barrier to adoption of AgMAR. We found that wine grapes grown on highly permeable soils have the lowest NO3− footprint of the three cropping systems and two soil classes we studied. While wine grapes potentially represent the best candidate cropping system for AgMAR, other cropping systems could be leveraged for AgMAR if dedicated “clean recharge” sites are established. If only Central Valley grape cropping systems were leveraged for AgMAR and adequate excess flooding water was available, roughly 460 million acre-feet of water per day could be recharged on lands rated by SAGBI as “excellent” and “good,” assuming 1 foot per day of infiltration (O'Geen et al. 2015).
Barriers to implementation across cropping systems include a lack of scientific evidence for how AgMAR may affect yields, a lack of capacity to move water from irrigation canals to fields, and floodwater being available only when AgMAR might interfere with growing season operations. Future studies examining the effects on a site's NO3− footprint of land use history, climate, or specific management practices such as tillage or irrigation system could be used to improve our understanding of NO3− leaching risk under AgMAR. Furthermore, work should be conducted on management of floodwater during an AgMAR event and the interactive effect with soil type on NO3− movement to groundwater.
Agricultural managed aquifer recharge — water quality factors to consider

