


All Issues
Ratio of farmworkers to farm jobs in California increased to 2.3 in 2016
Publication Information
California Agriculture 73(2):73-78. https://doi.org/10.3733/ca.2019a0002
Published online May 31, 2019
PDF | Citation | Permissions
NALT Keywords
Abstract
California Employment Development Department data suggest that almost 5% of California's workers were employed in agriculture, in 2016. In that year, monthly average employment in agriculture was 425,400, but the number of workers with at least one job in agriculture was 2.3 times that figure, 989,500. The number of hired farmworkers, including supervisors and office personnel, rose almost 20% between 2015 and 2016. Most workers employed in agriculture do not work year-round, so there is a gap between the average earnings of a full-time equivalent job in agriculture ($32,316 in 2016) and the average earnings of actual agricultural workers ($19,800 in 2016). This gap was widest for the third of all farmworkers employed by farm labor contractors (FLCs). Over half of the workers whose maximum earnings were in agriculture had only one farm job. Almost 20% of farmworkers received unemployment insurance benefits in 2016, including half of those whose maximum earnings were in logging and cotton ginning. Public policy has long favored a farm labor market in which most workers are employed year-round; these data indicate that the farm labor market in California is, on average, heading in the opposite direction.
Full text
The ratio of workers to full-time-equivalent (FTE) jobs in an industry is one important measure of the nature of the labor market. The ratio is high if there is seasonality and high rates of turnover. Over the last several decades, seasonal industries such as construction have restructured in ways that have reduced the ratio of workers to FTE jobs.
To evaluate this aspect of the agricultural labor market in California, we analyzed data collected by the California Employment Development Department (EDD) in 2016 and compared key findings with our earlier analysis of similar data from 2015.
Farm jobs and farmworkers
How many people work for wages in California agriculture? Answering this question has been surprisingly difficult, largely because most farm jobs are seasonal, lasting from several weeks to several months, and there is high turnover, with many workers trying farm work and soon quitting.

California has a complex farm labor market in which nearly 1 million workers fill an average of 425,000 full-time equivalent jobs. Between 2015 and 2016, the number of hired farmworkers increased almost 20%.
EDD publishes data on farm employment for the payroll period that includes the 12th of the month; in 2016, EDD data indicated that average monthly farm employment was 425,400. This 425,000 average is not a count of all individuals employed in agriculture, because some workers were employed but not during the payroll period that includes the 12th of the month. Including these not-on-payroll during the 12th of the month workers provides a count of all workers employed in agriculture.
EDD does not report the total number of unique farmworkers. This article fills this information gap, finding that there were about 2.3 workers for each average or FTE job.
All California employers who pay $100 or more in quarterly wages are required to report each quarter their employees for the payroll period that includes the 12th of the month and the wages paid to all workers during the quarter, and to submit appropriate unemployment insurance (UI) taxes. In 2016, some 16,150 California agricultural establishments — North American Industry Classification System (NAICS) code 11, including farming, forestry, fishing and hunting — hired a monthly average 425,400 workers and paid them a total of $13.7 billion. The data also show that over the past decade, the number of agricultural establishments fell over 10%, average employment rose over 10%, and total wages rose 50%.
Over 99% of the agricultural establishments that report employment are farms or firms supporting farms such as farm labor contractors (FLCs). There are very few workers who had their maximum earnings in forestry, fishing and hunting, only 0.8%. We use “farmworker” in this paper to mean all workers employed in agriculture, including supervisors and accountants employed by farms, acknowledging that a few are employed in forestry, fishing and hunting.
The average monthly employment of 425,400 reported by EDD represents 12 monthly snapshots of persons on the payroll during the payroll period that includes the 12th of the month. As such, it is a measure of the number of FTE positions in agriculture in California. Employers do not report hours of work, so some of the workers on the payroll may have worked full time and others part time.
The $13.7 billion total wage figure represents payments to all workers, including those who were employed at other times of the month but not during the payroll period that includes the 12th. Dividing $13.7 billion by 425,400 gives $32,316, which would be the average annual salary of a full-time farmworker. However, since many farmworkers are employed fewer than 2,080 hours a year, average earnings for the individuals who do farm work are significantly less; our analysis of earnings by individual workers (see below) indicates that the average earnings from all jobs of all workers with at least one job in California agriculture was $19,762 in 2016.
To investigate this difference, we captured all workers reported by an agricultural employer, tallying a total of 989,500 individual workers in 2016. This process allows us to compare the total number of farmworkers with the monthly average number of farm jobs. Figure 1 shows that this ratio has been rising from two workers per average job in 2014 and 2015 to 2.3 workers per average job in 2016, suggesting more workers tried farm work.

FIG. 1. Average FTE employment versus actual number of workers in California agriculture, 2014–2016.
The analysis is based on Social Security numbers (SSNs) reported by agricultural employers when paying UI taxes. Because we had data on all of the California jobs (both farm jobs and other jobs) associated with each individual SSN reported by an agricultural employer, we could assign each worker (that is, each SSN) to the NAICS code in which he or she had their highest earnings. This procedure identified 804,200 workers who worked primarily in agriculture (“primary farmworkers” hereafter). This total includes H-2A guest workers whose highest earnings were from an agricultural employer. Primary farmworkers accounted for over 80% of all workers with at least one job in California agriculture. Another 185,000 workers, or almost 20% of all agricultural workers, had at least one job with an agricultural employer but earned more from a nonfarm employer.
EDD does not verify SSNs submitted by employers unless the worker applies for UI, which 20% of agricultural workers did in 2016. We do not know how many workers used multiple SSNs in 2016 and how many times several workers shared one SSN, but we did drop from the analysis SSNs (and their associated earnings) used by more than 10 employers, which eliminated one-tenth of 1% of SSNs.
FTE and actual earnings
Table 1 compares the earnings of a FTE worker with the actual earnings of primary farmworkers by commodity in California in 2016. For example, an FTE primary farmworker would have earned $32,316 from all farm and nonfarm jobs (“All ag” category), but the average annual pay of primary farmworkers from all jobs was $16,142, half as much. The implied hourly wage of an FTE worker who was employed 2,080 hours was $15.54.
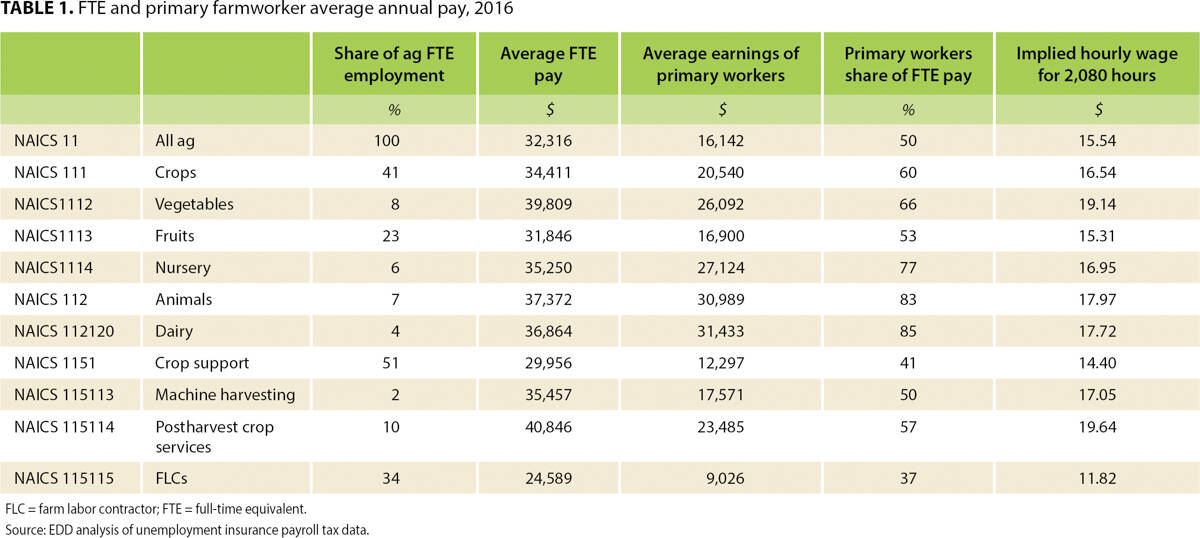
California's minimum wage was $10.00 an hour in 2016, so the $16,142 earned by primary farmworkers reflects a combination of lower hourly wages and fewer hours or weeks of work (employers do not report hours or weeks worked). A worker employed 2,080 hours in 2016 at the $10.00 minimum wage would have earned $20,800. Farmers reported to USDA National Agricultural Statistical Service that the average earnings of the workers they hired directly were $13.81 an hour in 2016, so a primary farmworker earning $16,142 would have worked 1,166 hours at $13.81 an hour.
Over 40% of FTE agricultural workers (40% of the EDD monthly average employment numbers) were hired directly by crop farms (NAICS 111, Crops). They had average annual earnings of $34,411 per FTE, equivalent to over $16.50 an hour. The actual earnings of workers whose maximum earnings were with crop employers were $20,540, or 60% as much. An FTE position in animal agriculture (NAICS 112, Animals) paid $37,372, while workers whose maximum earnings were from animal agriculture averaged $30,989, 83% as much as a full-time position or FTE job.
More workers are brought to crop farms by nonfarm support service firms such as FLCs than are hired directly by crop farmers. A full-time crop support position via an FLC (NAICS 115115) earned $24,589 in 2016, equivalent to almost $12.00 an hour. However, workers whose maximum earnings were with FLCs earned an average $9,026, or 37% as much, which is equivalent to 900 hours of work at the minimum wage of $10.00 an hour or 750 hours at $12.00 an hour.
These comparisons of average FTE earnings and average actual earnings for individual workers have three major implications. First, except in animal agriculture, average FTE pay can be a misleading indicator of what most farmworkers earn, since most primary farmworkers earn less than the $32,300 or $15.54 per hour that is implied by dividing total wages by average employment across all agricultural commodities (NAICS 11).
Second, the largest categories of workers have the lowest wages and the largest gaps between average FTE earnings and actual individual worker average earnings. FLCs employ a third of primary farmworkers, and their employees have the lowest average FTE and average actual worker earnings. Fruits and nuts (NAICS 1113, Fruits) account for almost a quarter of FTE positions and they too have low average FTE and average actual worker earnings.
Third, the ratio of average actual worker earnings to average FTE earnings fell between 2015 and 2016 (Martin et al. 2018). For all workers whose maximum earnings were in agriculture, the ratio of average actual worker earnings to average FTE earnings fell from 58% to 50%. For workers hired directly by fruit farmers, the ratio fell from 62% to 53%, and for workers hired by FLCs from 44% to 37%.
Such falling ratios of FTE to actual earnings suggest that more workers may be trying farm work, but many have relatively low farm earnings. At the same time, some experienced workers could be working more hours. In 2000, a fifth of crop workers were newcomers who had entered the country illegally that year; in 2018 fewer than 2% of crop workers were newcomers who had entered illegally (Gifford Center 2018).
It is possible that workers are concentrated at both ends of the work and earnings spectrum; the averages reported here would not capture such a bimodal distribution.
Migrancy, contractors and other employers
Farmworkers are still sometimes imagined to be migrants who follow the ripening crops from south to north, changing employers as they follow the sun. In fact, follow-the-crop migration is rare: The National Agricultural Workers Survey finds that fewer than 5% of workers employed on California crop farms have two farm employers at least 75 miles apart. However, the FLCs who employ a third of California farmworkers often move crews of workers in buses and vans from farm to farm or have the workers transport themselves from farm to farm (Martin 2018). A worker may have only one FLC employer during the year but nonetheless work on many farms.
Table 2 shows that 55% of farmworkers had only one farm job in 2016, followed by a quarter with two farm jobs and a fifth with three or more farm jobs. There was a jump in the number of workers with three or more farm jobs between 2014 and 2016, from 13% to 19%, almost mirroring the fall in the number of one-employer workers from 60% to 55%.
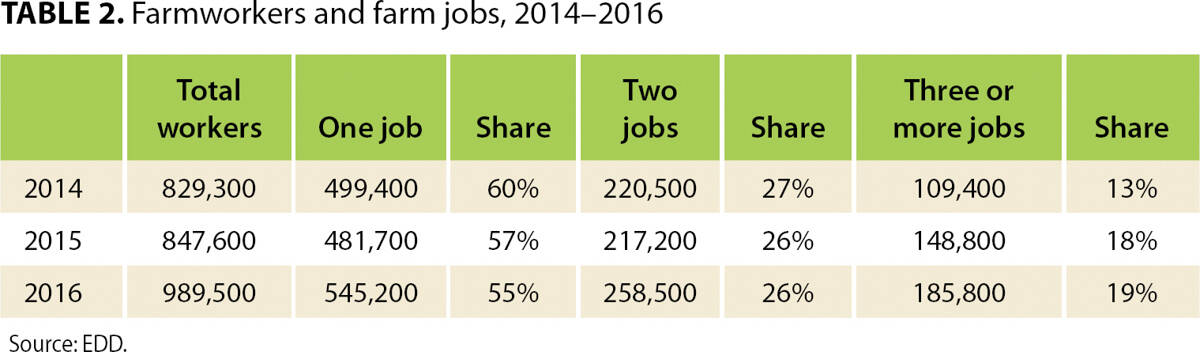
One explanation for more three-job workers is rising worker bargaining power. Fewer new foreign workers without authorization means that some employers who in the past refused to rehire workers who in a previous year had quit mid-season to pursue higher wages elsewhere now rehire such workers.
Table 3 shows the share of workers who had only one California farm job in 2016 by commodity. The highest percentage of one-job workers was on sheep and hog farms, where 92% of workers had only one job in 2016. In most animal agriculture, mushroom production and nursery crop production, about three-fourths of workers had only one farm job.
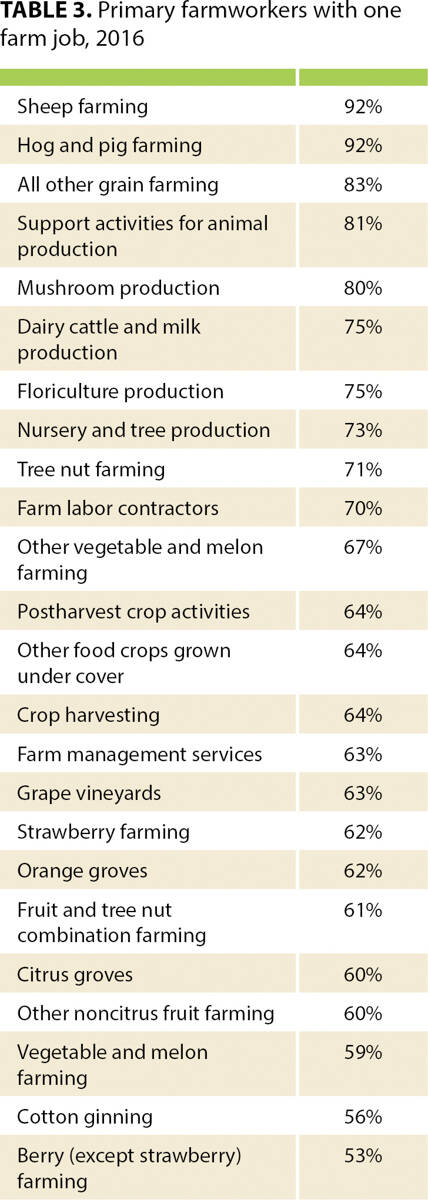
The lowest percentage of one-job workers was in other berries (not strawberries), where 53% had only one farm job in 2016. Between 60% and 65% of workers whose maximum earnings were in citrus, strawberries and grapes had only one farm employer, while 70% of those employed by FLCs had only one farm employer in 2016.
Unemployment insurance
Agriculture is a seasonal industry and laid-off workers who are residing legally in the United States may apply for UI benefits. In 2016, some 185,410 laid-off farmworkers in California received $446 million in UI benefits, an average of $2,405 each (table 4). Almost three-fourths obtained two or three quarters of UI benefits, and about 84% of recipients collected $500 to $5,000. Half of those receiving UI benefits had only one farm job in 2016.

Table 5 shows that almost half of those whose maximum earnings were in logging and cotton ginning received UI benefits, although these sectors employed relatively few workers.
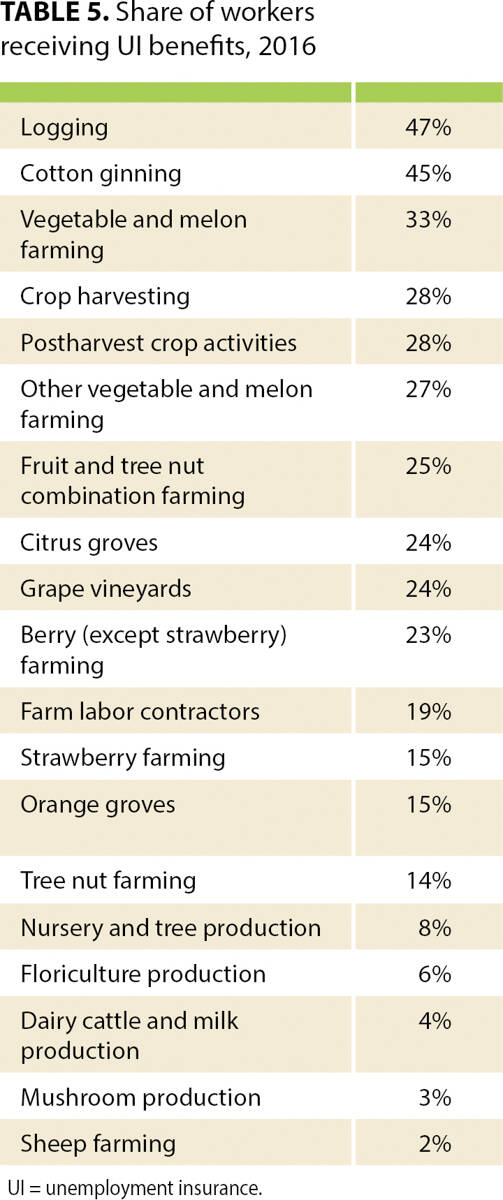
The largest sector with at least a quarter of primary workers obtaining UI benefits was grape vineyards, where 24% of the 44,000 workers received UI benefits, more than the average 19% of all primary workers who received UI benefits. Few primary workers in animal agriculture received UI benefits — for example, only 4% of primary dairy workers and 2% of primary sheep production workers. Most of those employed to herd sheep are H-2A guest workers who are not allowed to remain jobless in the United States to collect UI benefits.
Counties and commodities
Figure 2 shows that Kern County had the most workers, 150,300, with at least one farm job in 2016, followed by Fresno County, with 111,800, and Monterey County, with 101,300. These three counties had almost 37% of the state's almost 1 million farmworkers.
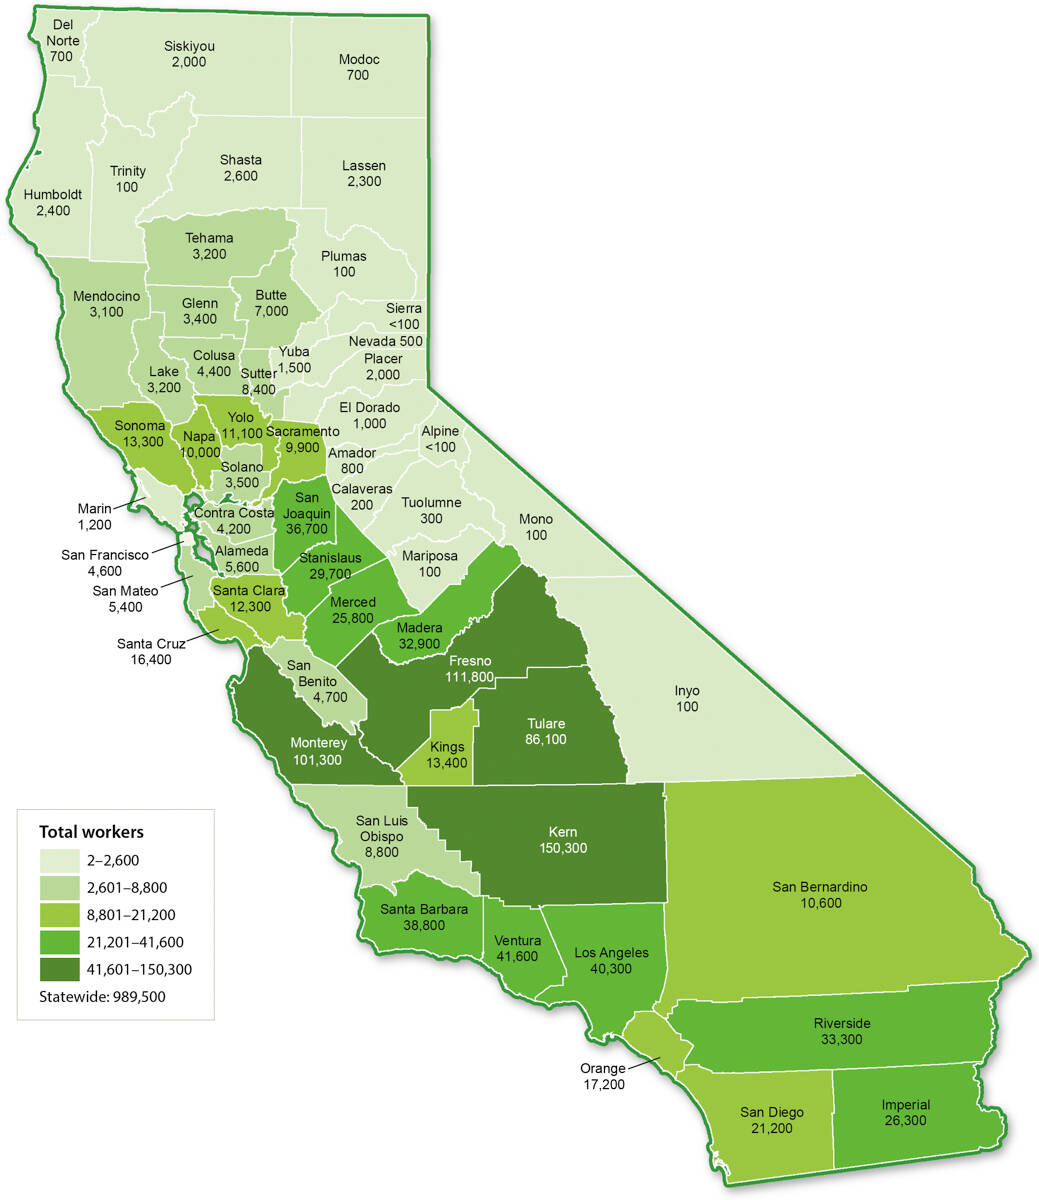
Using the EDD data, we assigned farmworkers to the county in which they had their maximum earnings and grouped them by type of farm work. In most commodities, the leading five counties included half to three-fourths of workers. For example, 73% of the 354,000 workers employed by FLCs (NAICS 115115) were in five counties: Kern, Fresno, Tulare, Monterey and Madera, including 28% in Kern. The second-largest commodity, postharvest crop activities (NAICS 115114), included 70,000 workers, 71% of whom were in five counties: Monterey, Fresno, Imperial, Tulare and San Joaquin.
Table 6 shows the leading sectors of farm employment by county. For example, 97,900 of the 150,300 farmworkers in Kern County were reported by FLCs, followed by 11,800 workers in tree nut farming and 11,300 in grape vineyards; these three categories accounted for over 80% of the farmworkers employed in Kern County. In Fresno County, 56,400 workers were reported by FLCs, 13,700 in postharvest crop activities and 10,100 in grape vineyards; these three categories accounted for 72% of the workers reported in Fresno County.

In Monterey County, FLCs employed over 40% of primary farmworkers, followed by postharvest crop activities with 16% and strawberries with 13%. Over 57% of Tulare County workers were employed by FLCs, followed by 8% in postharvest crop activities and 6% in dairies. In Ventura County, almost 30% of primary workers were employed in strawberry farming, followed by 23% employed by FLCs and 13% in other berries.
The number of farmworkers rose from 847,600 in 2015 to 989,500 in 2016, up 17%. In Kern County, the number of farmworkers rose 25%, in Fresno County by the statewide average of 17% and in Monterey County by 7%.
California has a complex farm labor market that involves almost a million workers filling an average 425,000 FTE jobs; the total number of farm jobs is much larger than 425,000, since many farm jobs last only a few days or weeks. The number of farmworkers rose faster than average employment between 2015 and 2016, so that there were 2.3 workers per FTE job in 2016, up from 2.0 workers in 2015.
The fastest growing sector of agricultural employment, FLCs, is also the sector that offers the lowest average earnings. If the expansion of FLC employment continues, the ratio of workers to jobs could continue to increase, moving the farm labor market away from what public policy has long tried to achieve, a farm labor market with fewer workers who are employed most of the year.
Ratio of farmworkers to farm jobs in California increased to 2.3 in 2016

