


All Issues
Managed winter flooding of alfalfa recharges groundwater with minimal crop damage
Publication Information
California Agriculture 72(1):65-75. https://doi.org/10.3733/ca.2018a0001
Published online January 16, 2018
NALT Keywords
Abstract
It is well known that California experiences dramatic swings in precipitation that are difficult to predict and challenging to agriculture. In times of drought, groundwater serves as a crucial savings account that is heavily relied upon. However, few tools exist to proactively refill this crucial reserve in wet years. We explored the idea of intentional winter flooding of agricultural land to promote on-farm recharge of the underlying groundwater. Field experiments were conducted on two established alfalfa stands to determine the feasibility of groundwater recharge and test realistic water application amounts and timings and potential crop damage. We studied soils with relatively high percolation rates and found that most of the applied water percolated to the groundwater table, resulting in short-lived saturated conditions in the root zone and minimal yield loss. While caution is appropriate to prevent crop injury, winter recharge in alfalfa fields with highly permeable soils appears to be a viable practice.
Full text
Groundwater is a vital resource in California, providing approximately 38% of the state's water supply in normal years and at least 46% in dry years (DWR 2014). During the recent drought (water years 2011–2012 through 2015–2016), the majority of groundwater wells (90%) experienced a drop in groundwater levels of at least 10–50 ft (3–15 m) while some wells (8%) showed declines in groundwater level of more than 50 ft (>15 m) (DWR 2017). Groundwater overdraft persisted for most of the 20th century but the rate has dramatically increased since 2000 to about 7.2 million acre-feet (ac-ft), or 8.9 cubic kilometers (cu km) per year between 2006 and 2010 (Faunt 2009; Scanlon et al. 2012). State legislation now requires the implementation of groundwater sustainability plans to ensure that all groundwater basins are managed sustainably by 2040 (SWRCB 2014).
Managed groundwater recharge on agricultural lands in winter, when surplus surface water often is available, is one promising strategy for replenishing overdrafted aquifers (Bachand et al. 2014). This practice may also be beneficial to agriculture by recharging soil water profiles before an irrigation season. However, challenges and concerns remain regarding the effects of wintertime flooding of fields, particularly in perennial cropping systems such as alfalfa or tree and vine crops. Risks include excessive anaerobic conditions that may damage roots, increased risk of root diseases, excess aboveground humidity affecting insects or diseases, excessively high water tables, nutrient and herbicide leaching, and inability to perform field operations due to wet conditions.
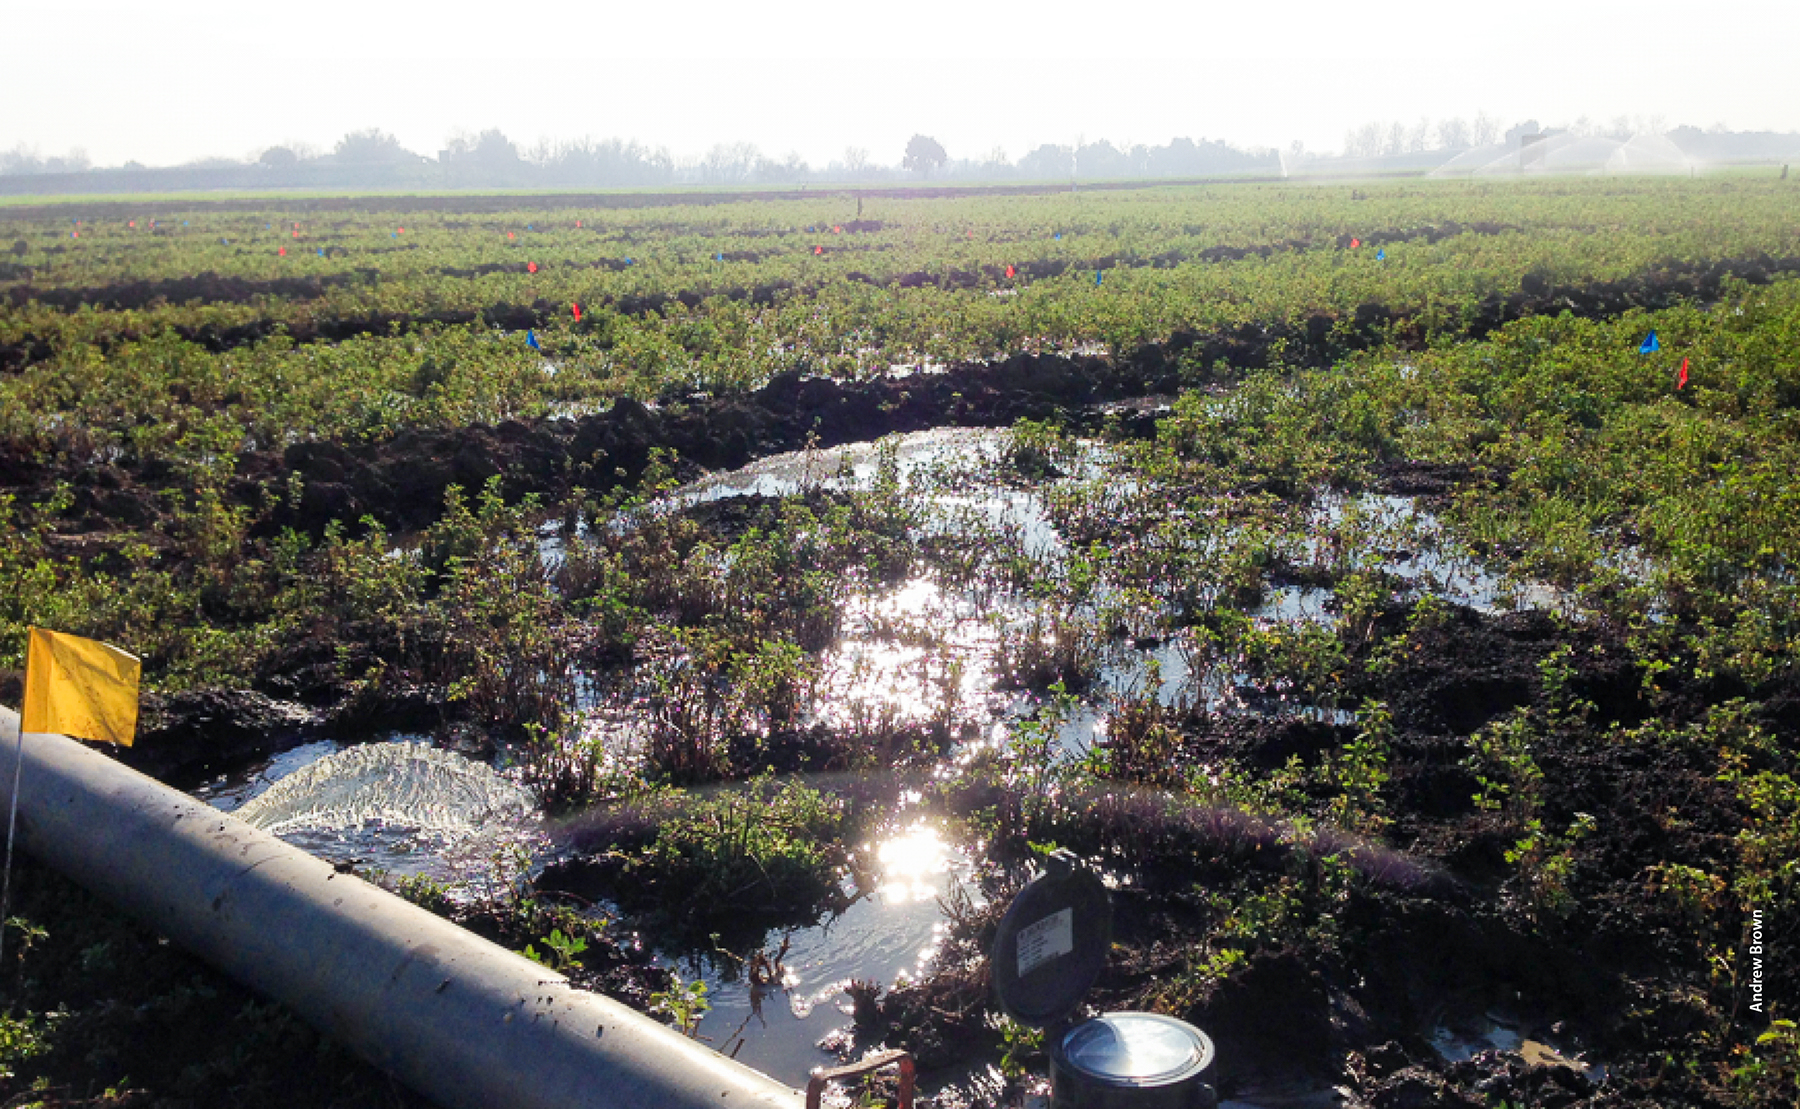
An experimental alfalfa plot at the UC Davis Plant Sciences Field Facility is flooded to evaluate crop impacts and groundwater recharge potential. The majority of alfalfa acreage in California is watered with flood irrigation systems capable of conveying large amounts of surface water to fields, many of which likely also have soil and underlying aquifer conditions suitable for recharge.
Alfalfa is a promising candidate for groundwater recharge. It is a short-lived perennial that is widely grown in the western United States, with approximately 800,000 ac, or 3,237 square kilometers (sq km) planted in California (USDA NASS 2017). Because alfalfa is a nitrogen-fixing plant, it seldom receives nitrogen fertilizer. Therefore, environmental concerns associated with water application beyond crop needs (i.e., leaching of nitrate to groundwater) are considerably lower than for other crops (Putnam and Lin 2016; Walley et al. 1996).
Approximately 80% to 85% of the alfalfa acreage in California is irrigated with flood irrigation systems (Schwankl and Pritchard 2003) capable of conveying large amounts of surface water to fields for groundwater recharge. Thus, given the large acreage of alfalfa in the Central Valley with suitable irrigation infrastructure, there are likely to be many fields that also have the soil and underlying aquifer conditions suitable for recharge.
Additionally, on a per-acre basis, average revenue from alfalfa is substantially lower than that for other perennial crops, such as grapes, almonds and walnuts, that are also candidates for managed winter groundwater recharge. For alfalfa, establishment costs are $500 to $600 per ac (Orloff et al. 2012), with average annual yields across the state of 7 tons per ac, or 17.3 tons per hectare (ha), and recent market prices from $140 to $375 per ton (Geisseler and Horwath 2016; USDA AMS 2017). As such, economic incentives designed to offset the risks associated with winter groundwater recharge would be comparatively affordable for alfalfa.
Winter flooding of alfalfa presents risks of crop injury, yield reduction or stand loss under saturated conditions. Alfalfa can be damaged by lack of oxygen in the root zone from prolonged saturation; however, the extent of crop damage is temperature dependent (Barta 1988; Barta and Sulc 2002; Drew and Lynch 1980). Alfalfa is less susceptible to injury when temperatures are cooler, even after prolonged saturation (Barta and Schmitthenner 1986; Cameron 1973; Finn et al. 1961; Heinrichs 1972).
To evaluate the suitability of alfalfa fields for groundwater recharge, we conducted on-farm experiments to measure the amount of groundwater recharge possible and assess crop response to excess winter water applications. Two on-farm experiments were conducted, one at the Plant Science Research Farm at UC Davis (Yolo County) in 2015, and one at Etna, in Scott Valley (Siskiyou County) in 2015 and 2016. In both experiments, the effects of different water amounts, timings and durations of water application were evaluated (fig. 1).

Fig. 1. Field layout of the experimental sites at (A) Scott Valley, in Siskiyou County (see also Table 1), and (B) Plant Sciences Field Facility, Davis. For the Davis site, a randomized complete block design consisting of seven treatments with three replicates was implemented. The table above summarizes the treatments for the Davis site. C is the control, H and L stand for high and low water amounts of 4 ft and 6 ft, respectively, and J, F and M indicate the month in which the winter recharge was performed (i.e., January, February, March).
Davis and Scott Valley sites
The Davis site is on a Yolo silty clay loam with an available water capacity of 11 inches (in), or 28.1 centimeters (cm), for a 100 cm pedon, underlain by a sandy substratum within 3 ft of the soil surface. The field was an established alfalfa stand (entering its fifth growing season in 2015) with a fall dormancy rating of 8 (variety WL 550.RR). The depth to groundwater at the site was approximately 15 ft (4.5 m) in January 2015. Total rainfall and mean temperature for the experimental period (January to April) in 2015 were 7.7 in (19.6 cm) and 53.9°F (12.1°C).
The Scott Valley site is in the Klamath Mountains at an elevation of 2,784 ft (848 m). The experiment was conducted on a 15 ac (6 ha) field. The alfalfa variety planted was not known definitively, but was either BlazerXL (fall dormancy rating 3) or Xtra-3 (fall dormancy rating 4). The soil type is a Stoner gravelly sandy loam with an available water capacity of 4.9 in (12.5 cm). The alfalfa stand was entering its ninth growing season in 2015 and depth to groundwater was approximately 24 ft (7.3 m) at the beginning of the experiment (January 2015). Mean temperature during the experiment (February–May in 2015 and 2016) was 47°F (8.3°C); total precipitation over the course of the experiment in both years was 3.3 in (8.5 cm) and 6.8 in (17.3 cm).
Experimental layout
The UC Davis experiment was a replicated study with two winter water application amounts (low = 4 ft (120 cm); high = 6 ft (180 cm)) and three water application timings (January, February, March) and the control (i.e., winter precipitation only). The treatments were replicated three times using a randomized complete block design (fig. 1B) resulting in 21 individual 20 by 50 sq ft (93 sq m) plots.
One irrigation check (435 ft by 50 ft) of a 3 ac field was divided into 21 plots for the experiment (fig. 1B). Plots were separated from one another by berms approximately 1 ft high and 2.5 ft wide, which were established in November 2014. Repeated irrigation events of approximately 1 ft of water per day were used to apply the total treatment quantity. Irrigation treatments began on Jan. 26, 2015, and continued until March 19, 2015 (fig. 1).
At the Scott Valley site, winter recharge experiments were conducted for 2 years (2015 and 2016). The treatments evaluated were (1) a continuous recharge treatment: application of water every day, continuously except for the times when water was being applied to other treatments; (2) a high recharge treatment: three to five water applications per week; (3) a low recharge treatment: one to three water applications per week; and (4) the control, receiving winter precipitation only.
Total amounts applied in each treatment are shown in table 1 for both years. These treatments were each applied to three contiguous irrigation checks (fig. 1A). All treatments received the standard irrigation amount of 3 in before the first cutting and 5 in between the first and the second cutting. Winter recharge treatments lasted from Feb. 17 to April 9 in 2015 and from Feb. 4 to March 21 in 2016.
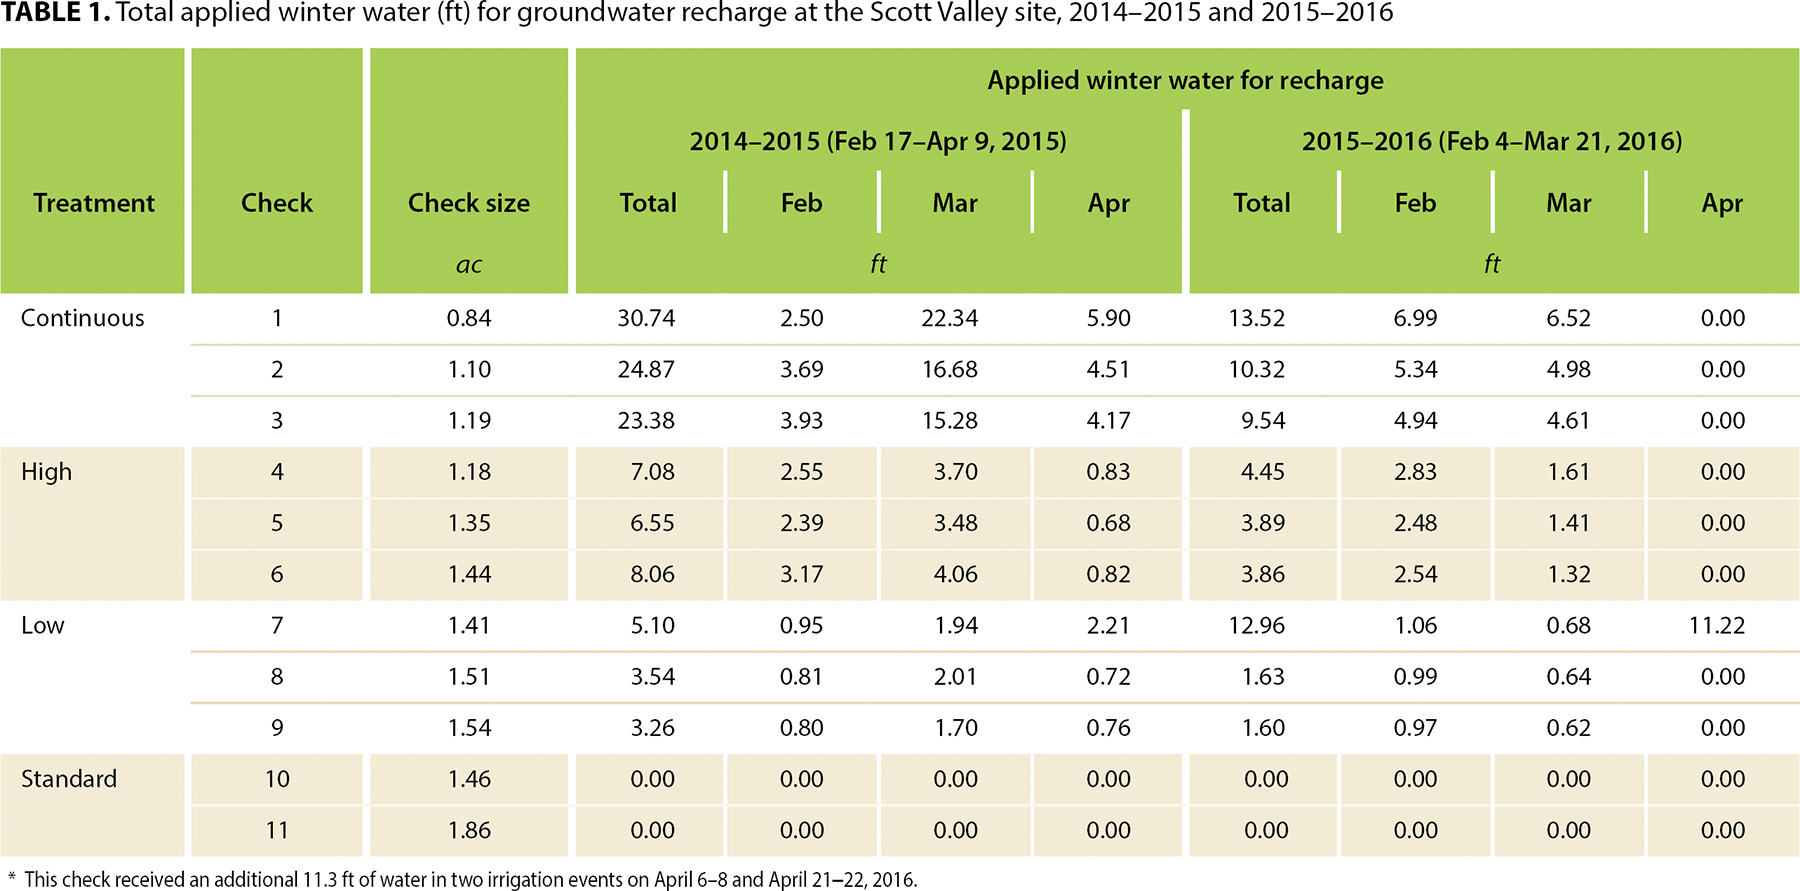
TABLE 1. Total applied winter water (ft) for groundwater recharge at the Scott Valley site, 2014–2015 and 2015–2016
Water balance modeling
A water balance model based on the Thornthwaite-Mather procedure (Steenhuis and Van der Molen 1986) was set up for each site to estimate the fraction of applied water going to deep percolation (i.e., groundwater recharge) versus to evapotranspiration and to storage in pore space. The model was applied only to the root zone (upper 2 ft), where most evapotranspiration demand takes place.
Attenuation of applied water in the deeper soil profile (transmission zone, 2 to 5 ft) was modeled with a one-dimensional vertical flow model capable of simulating saturated and unsaturated flow (fig. 2). More detailed information on field measurements, statistical analyses and soil water balance measurements are provided in the technical appendix.
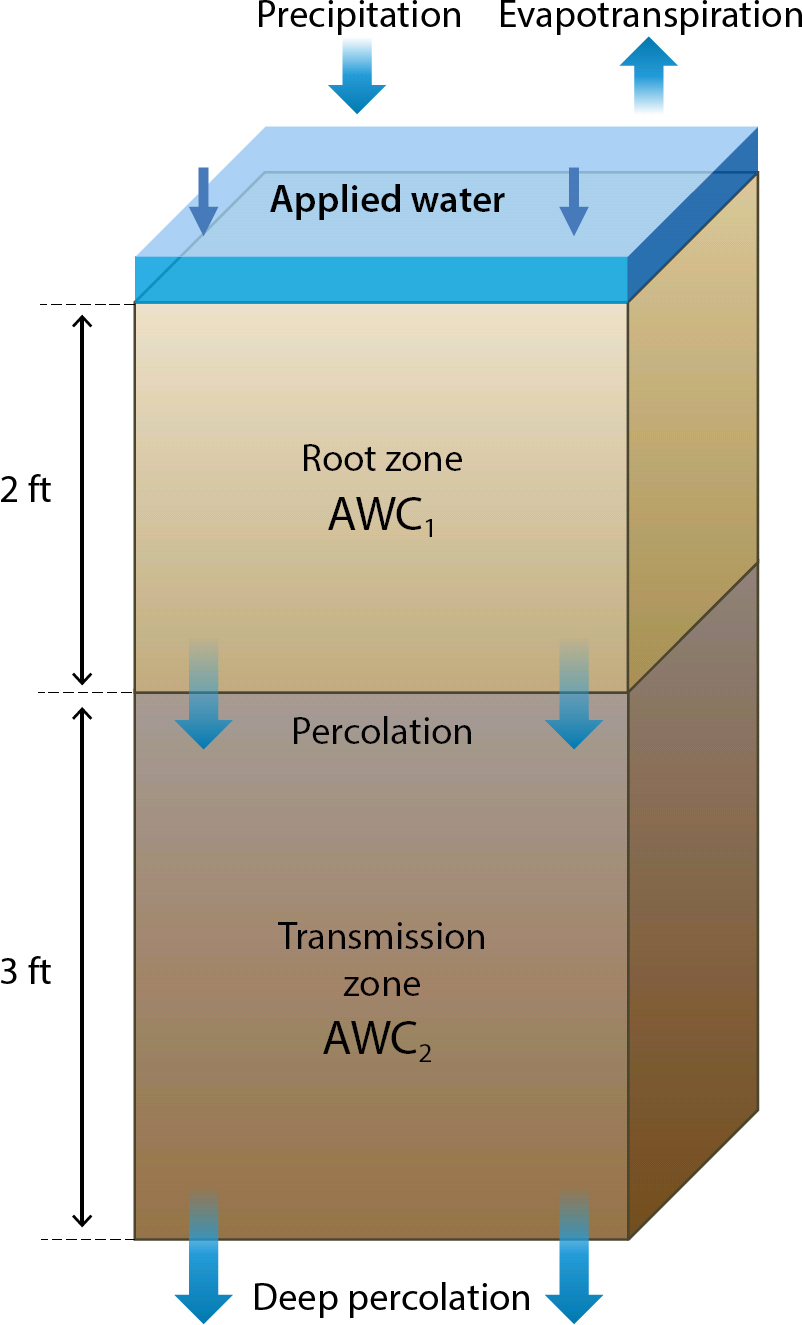
Fig. 2. Conceptual diagram of two-layered soil water balance model. The root zone is modeled with the Thornthwaite-Mather procedure and includes the loss of soil water by evapotranspiration. Saturated and unsaturated flow in the transmission zone is modeled with a one-dimensional vertical flow model receiving only the deep percolation from the root zone as water input. AWC is the soil-specific available water capacity. Variables are explained in the technical appendix.
Winter rainfall
The winter of 2014–2015 had below average precipitation in both Davis and the Scott Valley. Total November to April precipitation for Davis was 12.3 in (31 cm) — the 1981 to 2010 average was 17.55 in (44.5 cm) — with most rain, 8.2 in (20.8 cm), falling in December (fig. 3A). Total November to April precipitation in the Scott Valley was 16.9 in (43 cm), of which 5.9 in (15 cm) fell in December and January (fig. 4A). At both sites, December rainfall abruptly increased available soil water in the root zone to field capacity, followed by a short dry-out period in January. Volumetric water contents were above 75% of available water capacity at both sites before water applications occurred between January and April.
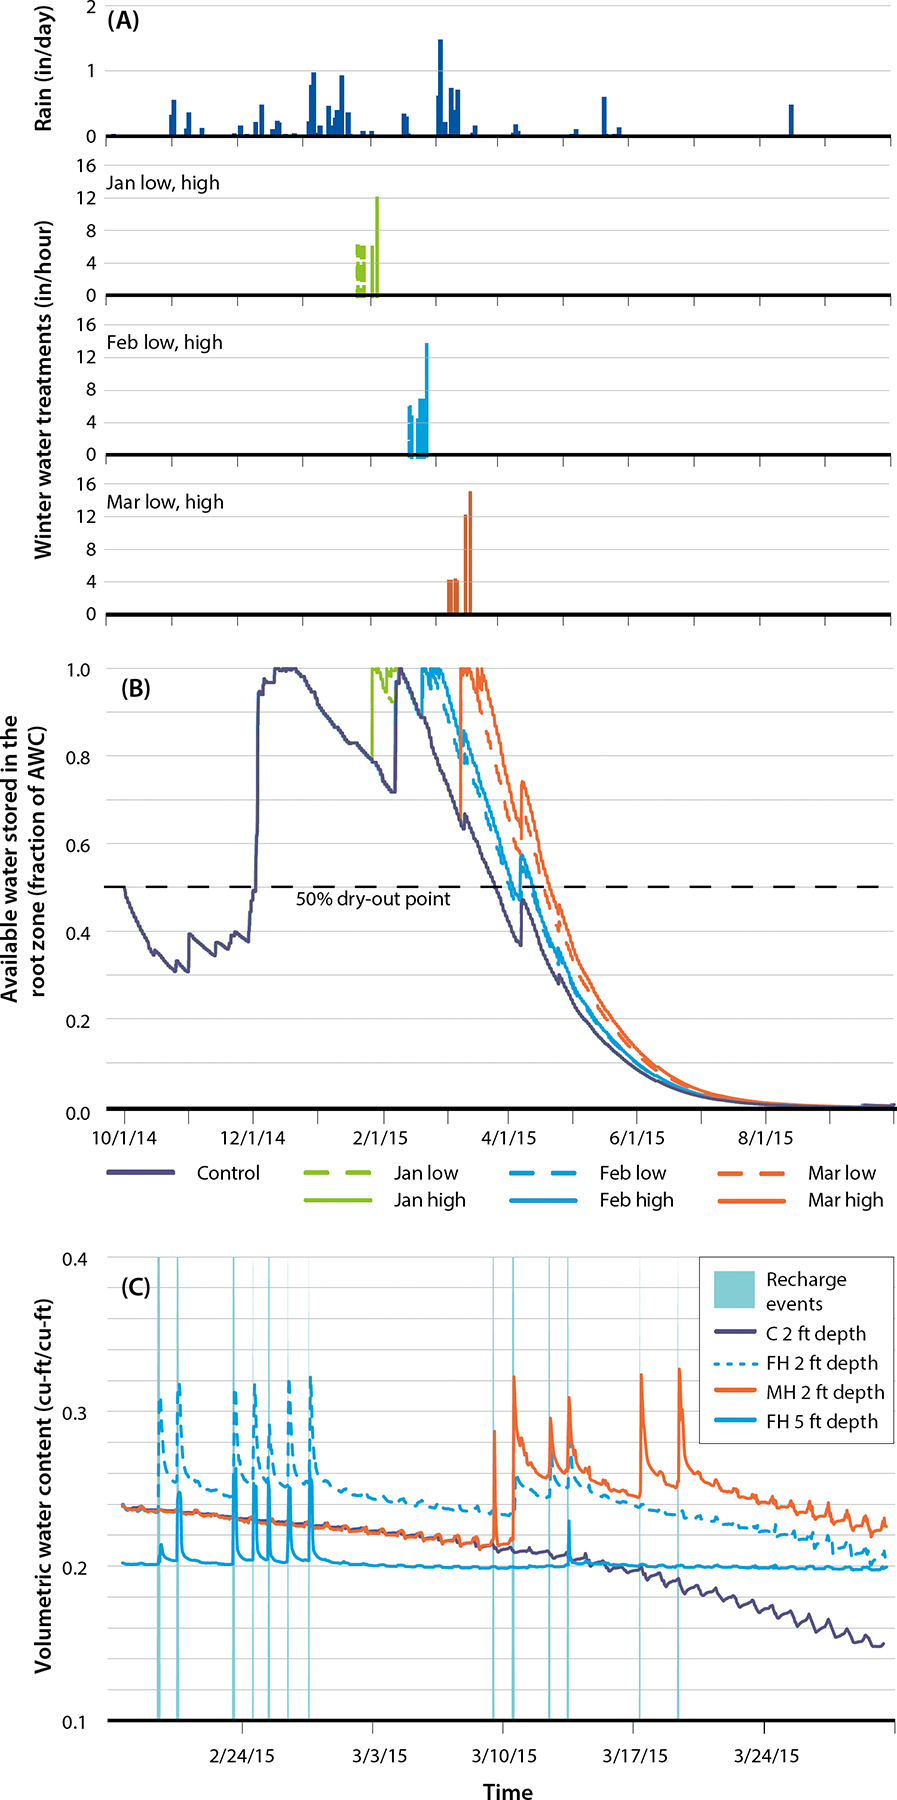
Fig 3. Water balance summary for the Davis site. (A) Daily precipitation and timing of winter water treatments. (B) Change in available soil water in the root zone (0–2 ft) as fraction of the soil-specific available water capacity (AWC). (C) Measured change in soil water content at 2 ft and 5 ft depth. Deep percolation occurred when volumetric soil water content was at a maximum.

Fig. 4. Daily precipitation and timing of winter water treatments for the Scott Valley site for 2015 (A) and 2016 (B). Change in available soil water in the root zone (0–2 ft) as fraction of the available water capacity (AWC) (C, D).
Davis site percolation amounts
At the Davis site, a small portion of the applied water for each treatment (low: 4 ft; high: 6 ft) was used to fill empty pore space in the soil profile, and as the water application progressed, water-filled pore space increased from field capacity (water retained in soil by gravity) to saturation (freely drainable water) (O'Geen 2012). Saturated conditions prevailed for up to 12 hours in the loamy root zone (upper 2 ft) and up to 4 hours in the transmission zone.
Total deep percolation amounts (i.e., including recharge from rainfall) for the 5 ft pedon were similar across treatments and ranged from 48.2 to 53.5 in (122 to 136 cm) for the low treatments and from 76.8 to 82.2 in (195 to 209 cm) for the high treatments (table 2). About 95% to 98% of the applied winter water left the root zone (upper 2 ft) as deep percolation, and 92% to 96% left the transition zone as deep percolation, indicating small losses to soil storage and evapotranspiration. Depending on the timing of the winter water application with respect to antecedent rainfall, about 0.9 to 3 in (2.3 to 7.6 cm) of the applied winter water was used to bring the water content in the root zone to field capacity. This contribution to soil storage increased to about 2.7 to 4.7 in (7 to 12 cm) when the transmission zone (2 to 5 ft) was included in the water balance.
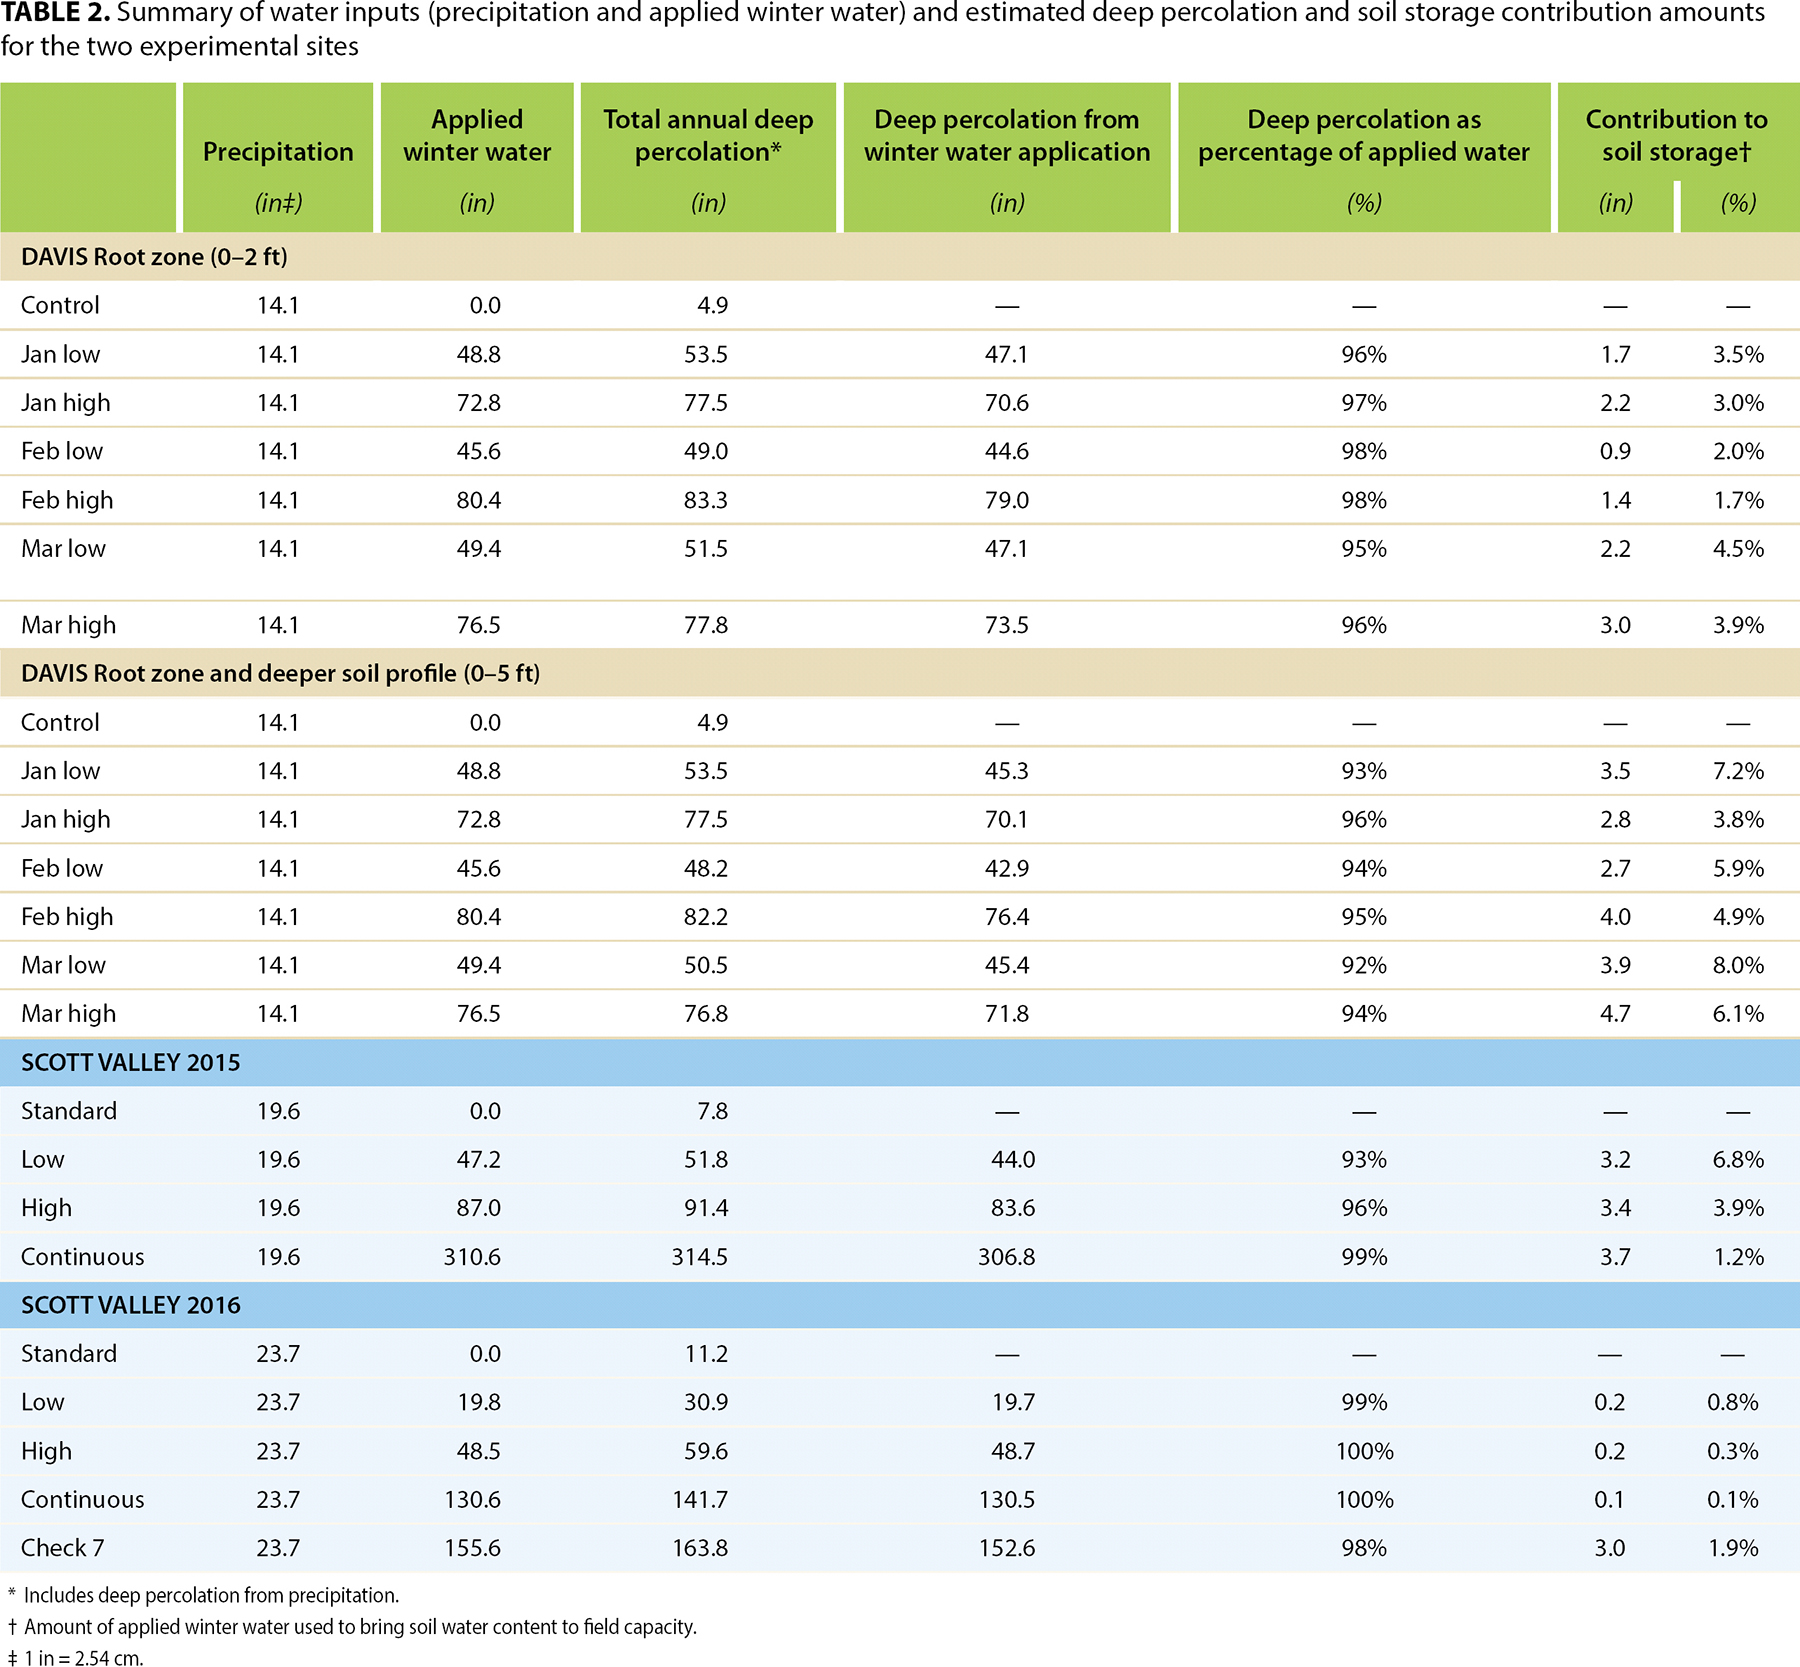
TABLE 2. Summary of water inputs (precipitation and applied winter water) and estimated deep percolation and soil storage contribution amounts for the two experimental sites
Although water application timing had little effect on total deep percolation amounts, it played a vital role for the root zone water balance at the onset of the growing season. In the control plot at Davis, available water in the 2 ft root zone reached field capacity only in December and early February, after which it steadily declined (fig. 3B). It would have reached the wilting point in early June without irrigation. A similar dry-out dynamic was observed for January low and high treatment plots, in which winter water was applied between Jan. 26 and Feb. 4, 2015 (fig. 3B), indicating that applying winter water for recharge 4 to 6 weeks before the onset of the growing season provides little advantage for the growing season water balance because most of the plant-available water is supplied naturally by precipitation in a normal or wet year.
In both the control and January treatment plots, available water stored in the root zone reached 50% of field capacity on March 23, 2015 (alfalfa irrigation management guidelines, e.g. Orloff and Hanson (2000), recommend maintaining a water content of 80% to 90% of field capacity in the root zone; allowable depletion is 50% of field capacity in the root zone — below that point plants could be damaged) (fig. 3B). In contrast, water applied in February and March resulted in a clear increase of plant-available water during the first month of the growing season (end of March). In February treatments, the root zone stayed saturated between Feb. 19 and Feb. 27, 2015, and then began to lose water, reaching 50% of field capacity on April 1 and 2, 2015. In March treatments, the root zone was saturated from March 9 to March 19, 2015, and dried to 50% of field capacity on April 18, 2015. In contrast to the control, the plots receiving additional water for winter recharge had more plant-available water stored in the soil profile at the beginning of the growing season; it amounted to about 1.3 in and 1.7 in (3.3 to 4.3 cm) in the February low and high treatments and 2.6 in to 3 in (6.6 to 7.6 cm) in the March low and high treatments.
Scott Valley site percolation amounts
At the Scott Valley site, in 2015 and 2016 a total volume of 135 ac-ft (166,520 cu m) and 107 ac-ft (131,982 cu m) of water, respectively, was applied for recharge on the 15 ac field. Table 2 summarizes the amounts of applied winter water for each check and treatment for both years.
During the first year, the low, high and continuous treatment plots received a total of 47 in (120 cm), 87 in (221 cm) and 311 in (789 cm) of winter water, of which 44 in (112 cm), 83.6 in (212 cm), and 306.8 in (779 cm) percolated to the water table, respectively (table 2). These winter application amounts translate to about 4, 7.3 and 25.9 ac-ft per ac of water, which is equal to 1.25, 2.4 and 8.6 times the annual growing season water demand of alfalfa in Scott Valley (assuming a water demand of 36 in). Low, high and continuous treatment plots received winter water for a total of 2.7, 6.3 and 31.6 days, respectively. The late-winter water application (mid-February to April) kept soils near field capacity, allowing about 93% to 99% of the applied winter water to go to deep percolation. Roughly 3.2 to 3.7 in (8.1 to 9.5 cm) of the applied water filled empty pore space to bring the water content in the root zone to field capacity.
During the second year (2016), water was applied for 11, 20 and 46 days, respectively, on low, high and continuous treatment plots between Feb. 4 and March 21. The low treatment plot received a total of 20 in (51 cm) of winter water, which is slightly over 50% of the annual growing season water demand of alfalfa in the Scott Valley. The high treatment received 48 in (123 cm) of winter water, which equals about 1.25 times the annual growing season water demand of alfalfa in the Scott Valley. The continuous treatment received 131 in (332 cm) of winter water, or about 3.5 times the growing season demand in 2016 (table 1). In addition, check 7 received 135 in (11.3 ft) of water on April 6–8 and April 21–22, 2016.
These numbers highlight that during one wet winter the growing season's water demand for about 3 years could be recharged. Nearly 100% of the applied water went to deep percolation in 2015–2016, likely because of the wet winter-spring season (table 2). Only 0.15 in (0.4 cm) of the applied water was used to bring the water content of the root zone to field capacity. For irrigation check 7, which received most of the winter water in April, the contribution of applied winter water to soil storage was 3 in (7.5 cm).
Because of the dry winter in 2014–2015, the available water in the root zone of the grower's control plots increased to field capacity only during the winter months (December to February). Dry-out started early in 2015, around mid-February, and progressed rapidly, reaching 50% of field capacity on April 23, 2015 (fig. 4C). Dry-out in the winter water application plots was delayed by about 1 month; all treatment plots remained nearly saturated until mid-April and reached 50% of field capacity either on May 10, 2015 (low and high treatment), or on May 14, 2015 (continuous).
Because of the late-winter water application, low, high and continuous plots had about 2.5 in (6.5 cm) of additional plant-available water stored in the root zone at the beginning of the 2015 growing season (April) compared to the control (fig. 4C). This amount is almost equal to one growing season irrigation event (3 in). In contrast, because of the wet winter and spring in 2015–2016 (total November to April precipitation was 130% of normal: 22.5 in) and the earlier timing of winter water applications, winter recharge did not provide an advantage for the root zone water balance at the onset of the 2016 growing season (fig. 4D). Irrigation check 7 was an exception; it had an additional 2.5 in (6.5 cm) of plant-available water stored at the end of April (fig. 4D). In 2016, dry-out to 50% field capacity of the control occurred about 1 month later than in the drought year of 2014–2015, indicating the generally wetter conditions in 2016.
For the first two winter recharge events conducted in February and March 2015, the groundwater table rose notably within 11 to 18 hours after water application started, indicating that the applied water moved through the 25 ft (7.6 m) vadose zone in less than 24 hours. The applied winter water in conjunction with natural precipitation caused a rise in the groundwater table of approximately 6 ft (1.8 m) in 2015 and 4.5 ft in 2016 (fig. 5). Although surface water was applied nearly continuously at the Scott Valley site, the applied water never created prolonged ponded conditions after water application ceased. Often, the application was supply limited and water moved only two-thirds to three-quarters down each check. Based on the duration and amount of winter water applied at the Scott Valley site, we estimated an infiltration rate of 0.9 ft (27 cm) per day.
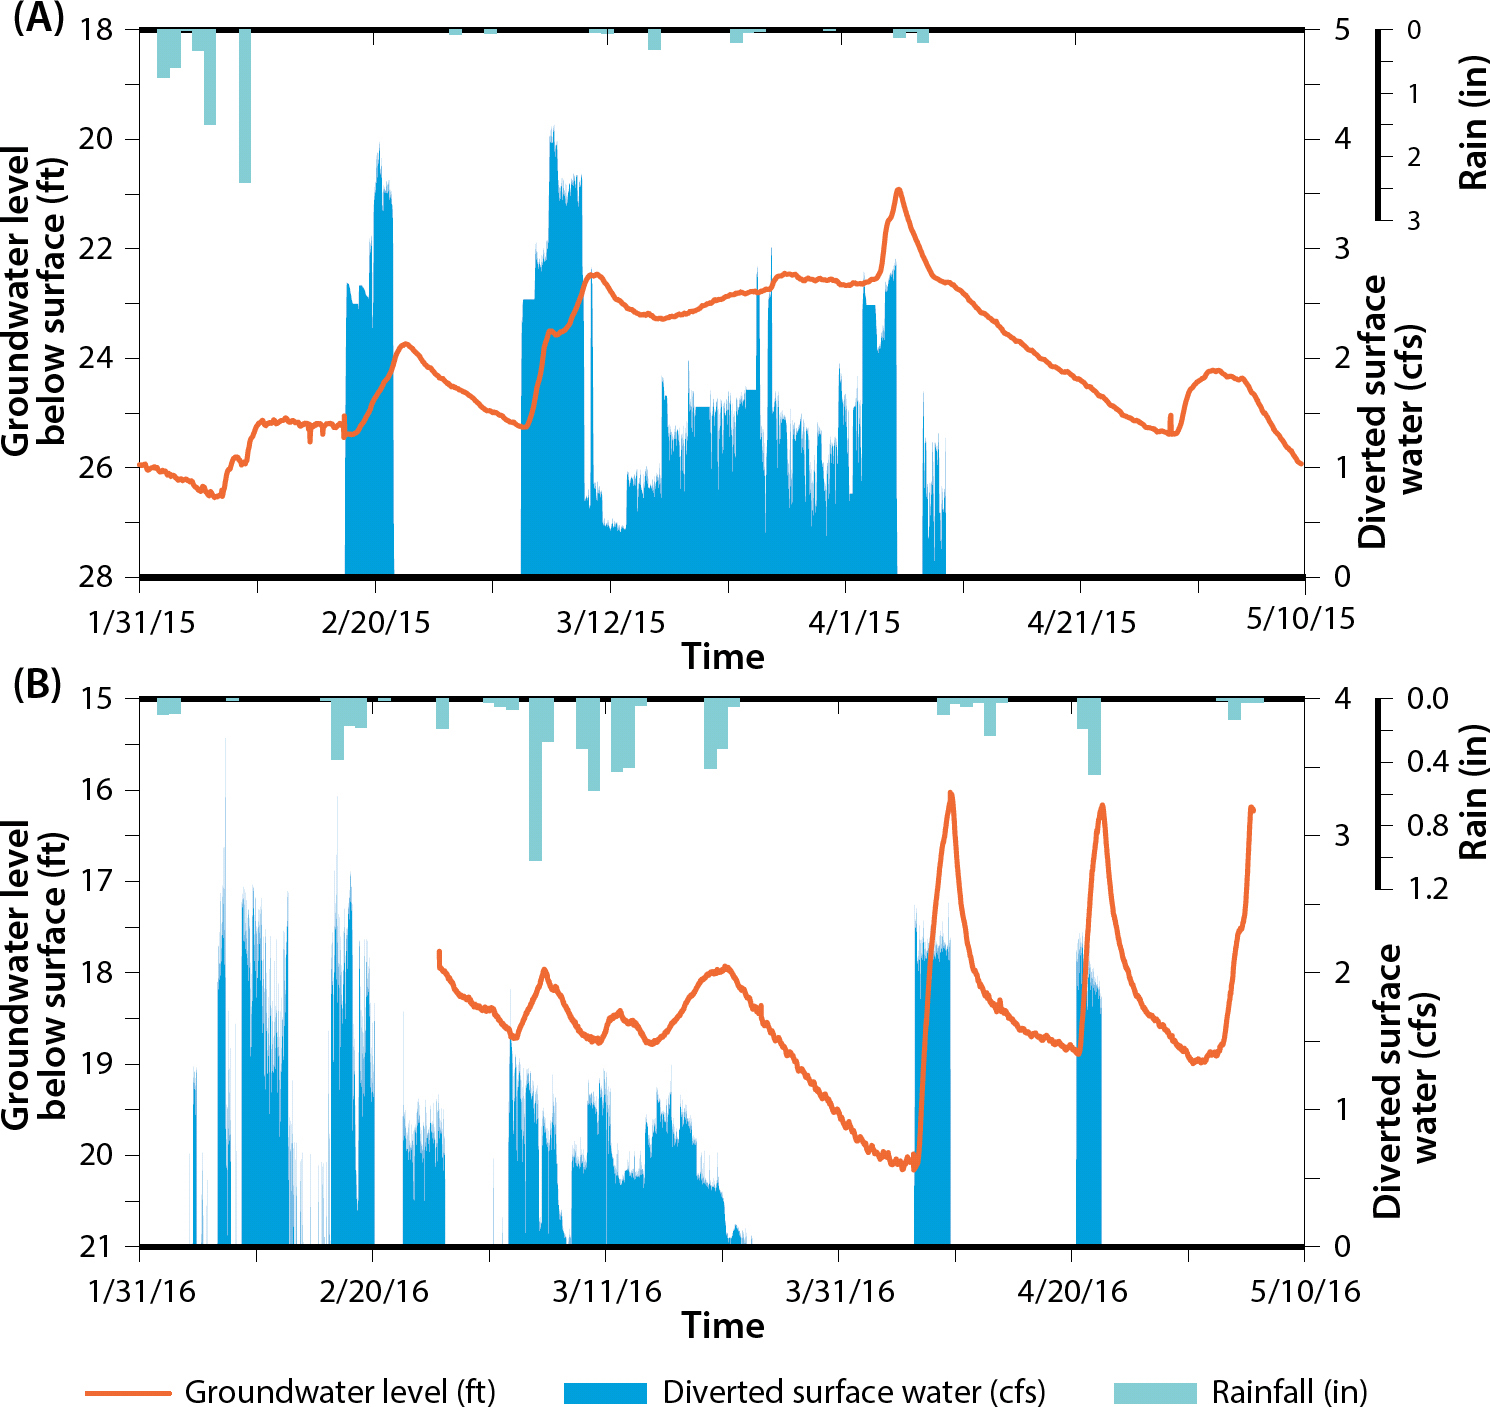
Fig. 5. Amount of winter water applied for recharge (cfs), change in depth to the groundwater table (ft) and rainfall (in per day) measured between January and May in 2015 (A) and 2016 (B) for the Scott Valley site.
Minimal effects on alfalfa
At the Davis site, statistical analysis of the effect of winter water application quantity and timing on alfalfa yield using a mixed-model analysis of covariance (ANCOVA) did not show a significant relationship between alfalfa yield and winter recharge. Overall, alfalfa yield at the Davis site in the first cutting averaged 1 ton per ac (2.47 tons per ha).
Yields were variable (0.7 to 1.2 tons per ac; 1.7 to 3 tons per ha) across the three blocks and the within-plot replicates (fig. 6A). Despite the variability between plots, alfalfa yields were not significantly different across the timing of water applications (F = 0.98, p = 0.4) and total applied water amounts (F = 0.07, p = 0.94) or their interaction (timing amount: F = 0.74, p = 0.5). Plant counts made prior to the treatments were not significant predictors of yield but explained approximately 15% of the variation in alfalfa yield across treatments. Plant counts were positively correlated with yield (r = 0.45), suggesting that low plant density limited yield in some of the observation plots such as the January low plots, but plant counts were not related to the irrigation treatments.
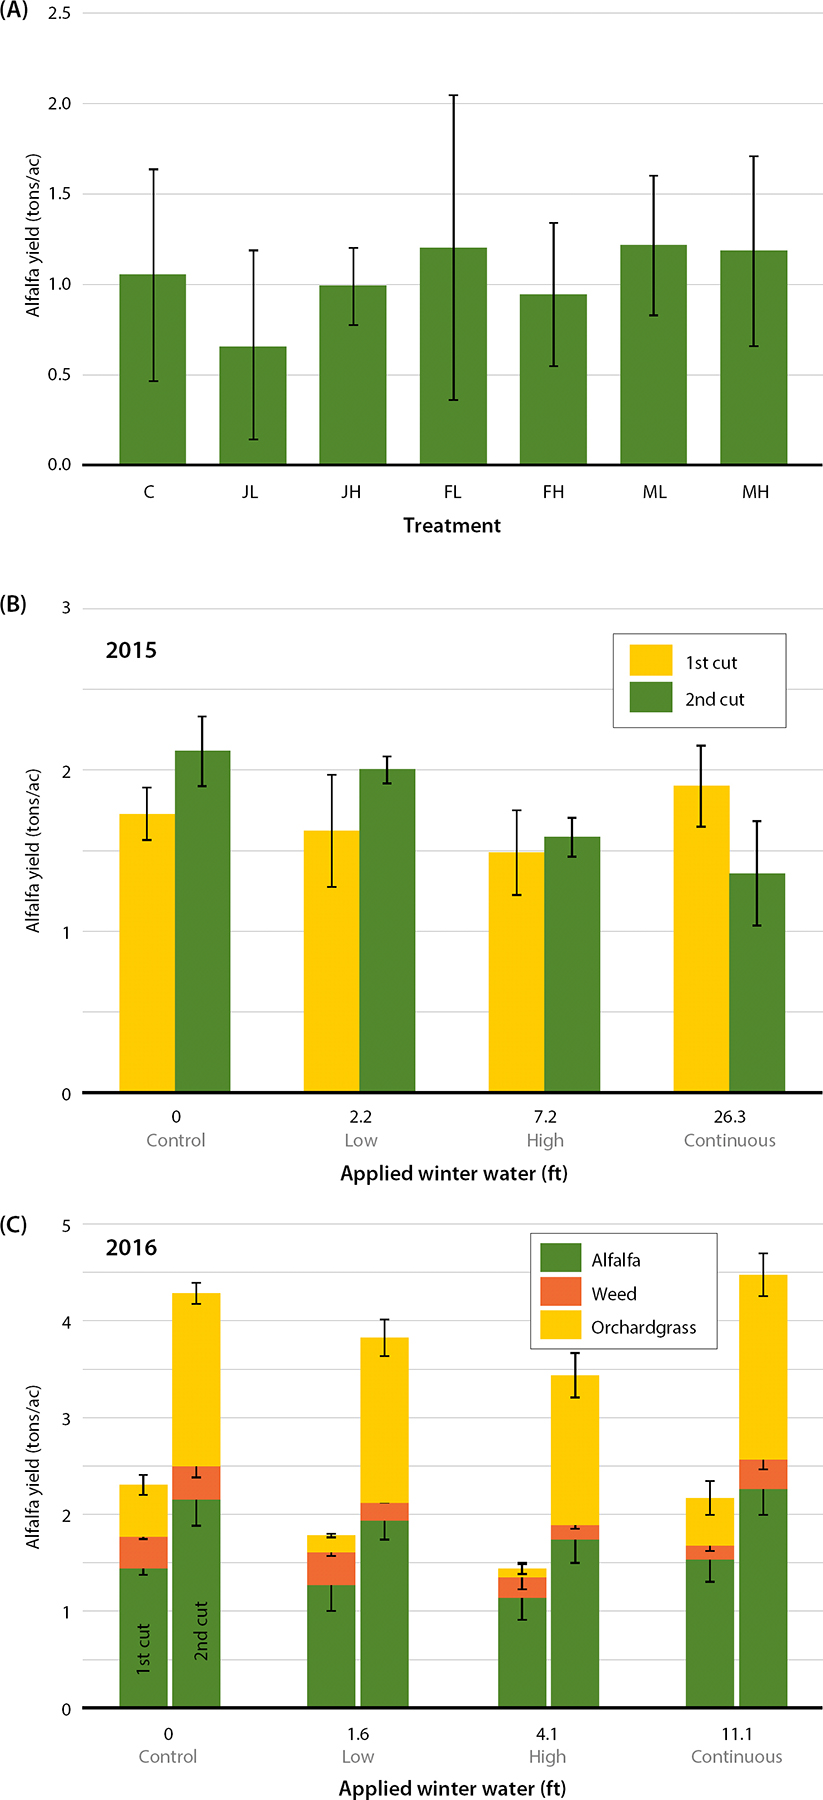
Fig. 6. Mean alfalfa yield (tons per ac) for the Davis (A) and Scott Valley (B, C) sites. For the Davis site, yield was estimated from the replicated treatment plots (n = 3) on April 23, 2015. C is the grower standard, L and H stand for low and high water amounts of 4 ft and 6 ft, respectively, and J, F and M indicate the month in which the winter recharge was performed (i.e., January, February, March). For the Scott Valley site, yield is shown for the first (end of May) and second (mid-July) cuttings in the control, low, high and continuous treatment plots in 2015 (B) and 2016 (C). Error bars indicate one standard deviation.
At the Scott Valley site, alfalfa yield did not show a significant correlation to total applied winter water for three out of the four cuttings measured over the 2 years (fig. 6B, C). Similarly, mean weed and orchardgrass biomass in 2016 did not show a significant correlation to total applied winter water (fig. 6C). During the second cutting in spring 2015, alfalfa yield showed a significant negative correlation with increasing amounts of applied winter water (p = 0.02) (fig. 6B). Despite this significant correlation, yield in the continuous treatment plot, which received about 26 ac-ft per ac of water, was only 0.76 tons per ac lower than the control.
To our surprise, in 2016, the continuously irrigated checks, which received the largest amount of winter water, showed a slightly higher yield than the control plots during the first and second cutting. A similar pattern was observed during the first cutting in 2015, with yields slightly lower at the center of the field (low and high treatments) than toward either of the edges (control and continuous treatments). Alfalfa yields for first and second cuttings at the Scott Valley site were comparable between 2014–2015 and 2015–2016 and reached, on average, around 1.7 tons per ac (4.2 tons per ha) per cutting.
The alfalfa yield results show that application of 2 to 26 ft of water for winter recharge did not conclusively result in a significant decline in yield. Neither experiment showed significant declines in alfalfa yield during the first cutting, which would be expected if environmental factors influenced crop health. The yield data together with the deep percolation results suggest that the effect of winter flooding on dormant alfalfa is potentially small for highly permeable soils. However, alfalfa yields were also highly variable among treatments, which complicated the statistical analysis of the water application effect. For the Davis site, results indicated that water application timing and amount were not significant predictors of yield, while initial plant count and variability in soil properties across the field did explain some of the variability in yield observed across the treatments.
Both experimental sites were older alfalfa stands (5-year stand in Davis, 9-year stand in the Scott Valley) with relatively low plant count prior to the recharge experiments, which likely influenced the yield measurements. To more accurately determine the effect of large winter water applications for groundwater recharge on alfalfa health and yield, experiments need to be replicated on younger, high-yielding fields at more sites with varying soil types and drainage characteristics. Further study on susceptibility to root disease, stand survival and long-term productive capability is also needed.
Winter flooding from high rainfall is a known risk for alfalfa production, particularly during early stand establishment (Putnam et al. 2017). Thus, older stands may be preferred for groundwater recharge strategies. Older stands are lower risk since they are usually past peak production.
While there are risks to plant stand and crop productivity with high winter water applications to alfalfa, the risk of economic loss is likely lower than compared to other perennial crops with higher cost structures. Moreover, the risk of crop loss may be low in highly permeable soils, especially when temperatures are low. These risks also may be offset to some degree by benefits from greater early-season moisture in the root zone being available for crop production. The risks also should be weighed against the value of groundwater recharge, which may improve local groundwater resources, making water available during dry summer months or for transfer to other crops.
Application timing, soil oxygen status
We tested the continuous application of winter water over several days and weeks as well as application of winter water in the form of isolated irrigation events. Based on our field observations neither method had a large influence on the amount of the total applied water that went to deep percolation. We attribute this mainly to the highly permeable character of the soil at both sites and the low evapotranspiration rates encountered during the experimental periods.
Soil moisture data collected at both sites further indicated rapid drainage of the soil profile following the end of the recharge events. Since lack of oxygen caused by prolonged flooding is directly related to development of root or plant diseases (Barta and Schmitthenner 1986; Cameron 1973; Heinrichs 1972), free drainage of the applied winter water through the root zone is important and presents one of the main risk factors when applying large amounts of water for winter recharge (Finn et al. 1961).
Oxidation-reduction potential measurements at 4- and 8-in depths at the Scott Valley site revealed close correlation between oxygen status and water content (fig. 7). Reduced oxygen conditions occurred only during the water application events, and returned quickly to aerated conditions after water applications ceased. In addition, both experiments were conducted during the winter period when alfalfa is dormant or growing very slowly. Both findings suggest that pulsed application of water for groundwater recharge is preferred from a crop health perspective and that the intensity and frequency of the winter water applications should be tailored to site-specific soil drainage characteristics.
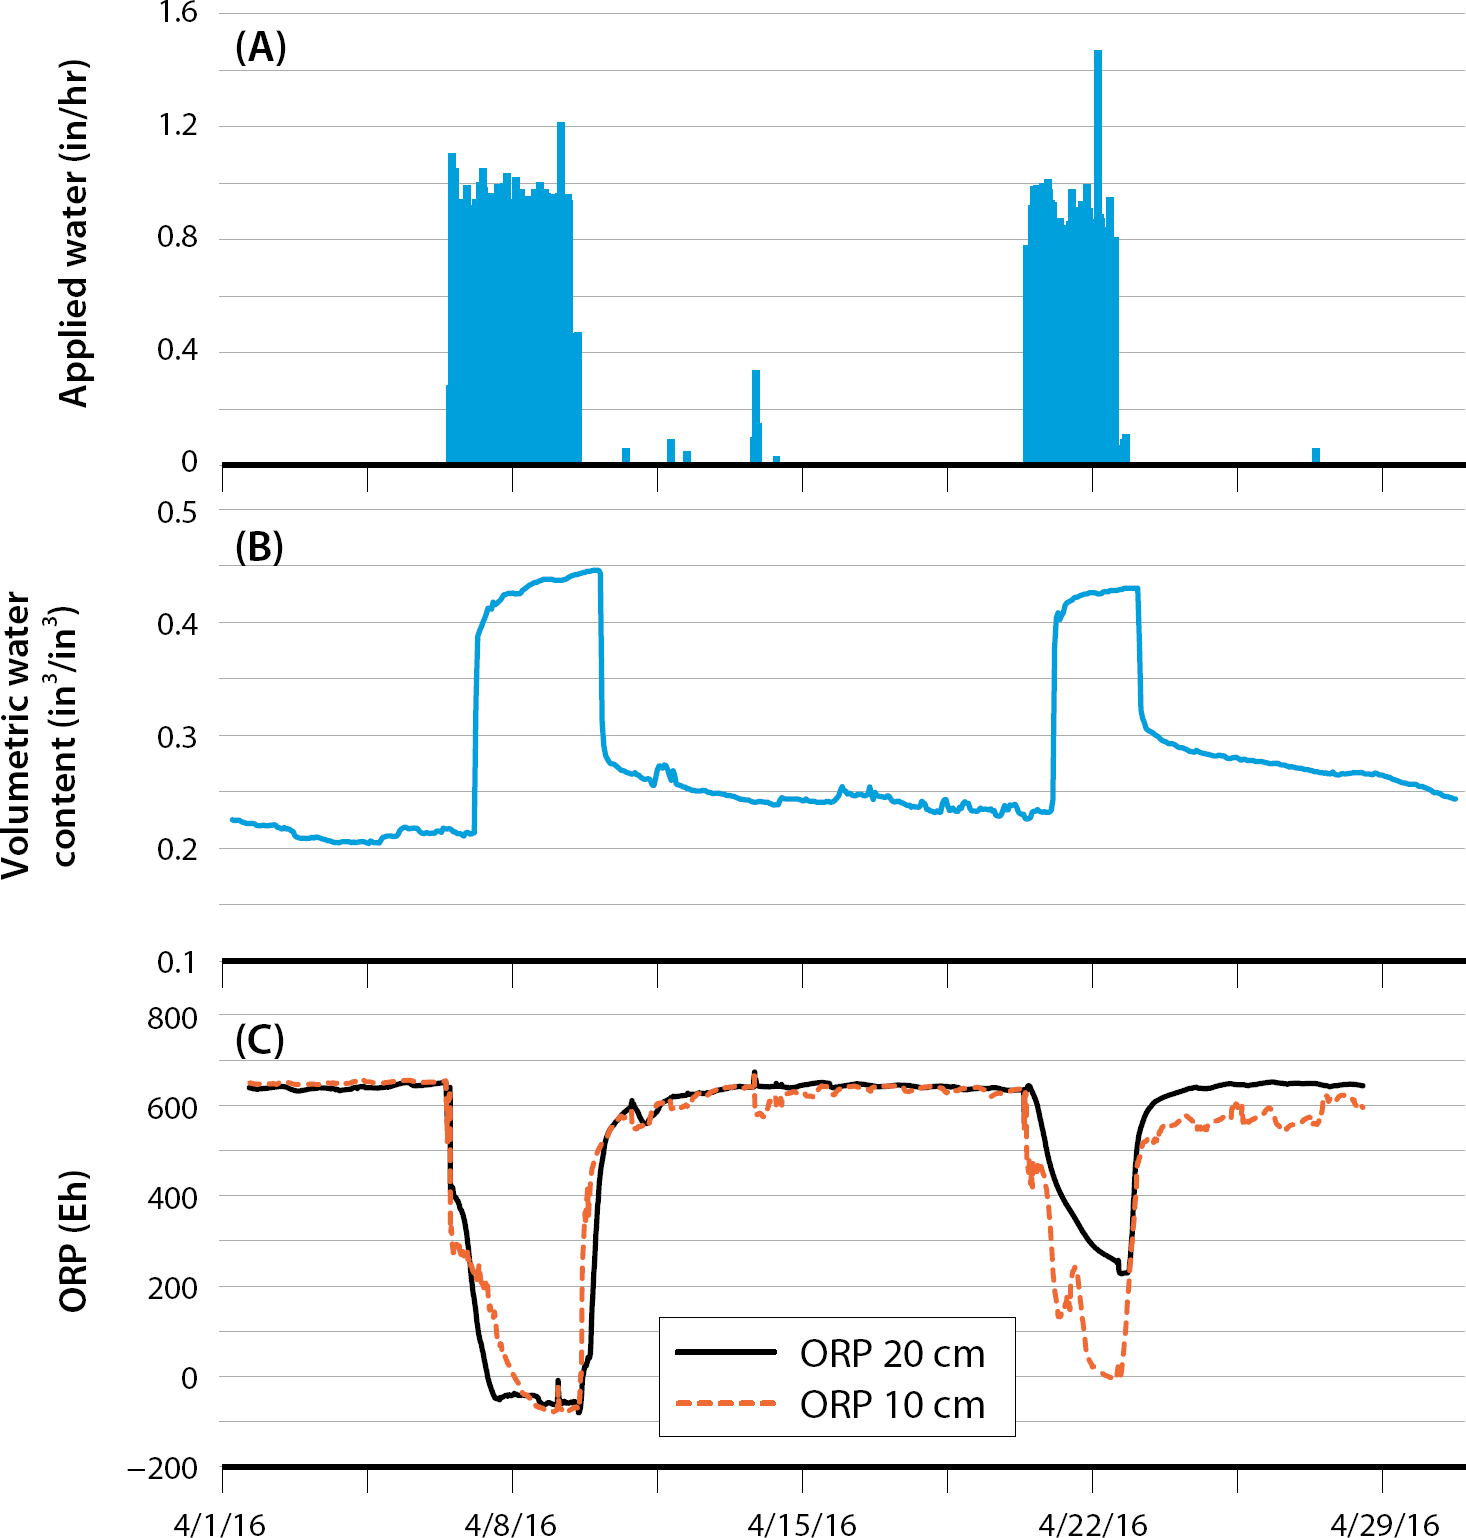
Fig. 7. Precipitation and applied water (A), volumetric water content at 8 in depth (B) and oxidation-reduction potential measured at 10 am (red dots) and 20 cm depth (black line) (C) at the Scott Valley site.
Corroboration of SAGBI
Our field measurements corroborate that the Soil Agricultural Groundwater Banking Index (SAGBI) (O'Geen et al. 2015) may be a reliable predictor of soil suitability for on-farm groundwater recharge. SAGBI (casoilresource.lawr.ucdavis.edu/sagbi/) considers five major factors critical to sustaining crop health and rapid deep percolation of applied water: soil profile percolation rate, root zone residence time, chemical limitations, topography, and soil surface condition. The index ranks soils on a six-class scale ranging from very poor to excellent (O'Geen et al. 2015).
Both of our sites rank in the SAGBI good category. At both sites, recharge is not restricted significantly by chemical limitations (e.g., no accumulation of salts that could result in degradation of water quality), topography or water-restrictive features in the root zone or deeper soil profile, such as hardpan or claypan. For both sites, the root zone residence time and deep percolation ability were the most limiting characteristics due to relatively high clay content. However, as showcased by our field data, both sites nonetheless supported significant amounts of deep percolation.
Potential benefits, need for research
Results from our two on-farm experiments indicate that an astoundingly large fraction of the applied winter water percolated past the root zone toward the groundwater table. Over 90% of the applied water went to deep percolation, ranging between 4 ft (122 cm) and 6.7 ft (204 cm) at the Davis site and 2.6 ft (79 cm) and 26 ft (792 cm) at the Scott Valley site. Less than 10% of the applied water was either evaporated or used to fill up soil pore space to bring the soil to field capacity.
Applying our field observations to the statewide SAGBI map allows a simple approximation of the potential benefit of using alfalfa fields for groundwater recharge for California's groundwater resources. Using a geospatial analysis of crop land data (USDA NASS 2017) and the unmodified SAGBI index, we determined that approximately 300,000 ac (1,214 sq km) of alfalfa in California are planted on soils with a SAGBI rating of moderately good or better. Applying 6 ft of winter water and assuming 90% of it percolates past the root zone, 1.6 million ac-ft (1.9 cu km) of groundwater recharge would be possible if all alfalfa land ranked as suitable for on-farm recharge were used. This is equivalent to 12.8% of the statewide average annual agricultural groundwater use between 2005 and 2010 (DWR 2015). For reference, the Oroville reservoir, second largest in the state, has a storage capacity of 3.5 million ac-ft.
Our study has mainly looked at the physical feasibility of using alfalfa fields for the replenishment of groundwater with winter excess surface water. However, adoption of this practice is locally dependent on many site-specific factors, which influence the overall cost and benefits of this practice to the farmer. On-site factors such as soil suitability; climate (e.g., winter temperature, precipitation); age, health and fall dormancy rating of the alfalfa variety; capacity of the local water conveyance system; and ease at which water can be conveyed onto a field (e.g., involving potential additional labor or electricity cost) influence the rate and total amount of excess water that can be used for recharge and the potential costs, such as from crop damage.
Most landowners will likely have to purchase the surface water they are diverting for recharge (unless it is free-of-charge delivered floodwater), which can cost between $15 per ac-ft (Emil Cavagnolo, General Manager Orland-Artois Water District, personal communication) and $1,456 per ac-ft (CPUC 2016). In addition, most landowners will likely have to expand their existing or obtain a new appropriative surface water right for the diversion of additional surface water outside the growing season. If the state of California decides to adopt the fee structure for the temporary permit for groundwater recharge from Governor Brown's Executive Order B-36-15, the cost for the permit would include a minimum fee of $100 for the application plus $1 per 100 ac-ft in excess of 10,000 ac-ft (based on water actually diverted), but the cost could be as high as $498,665 if a standard permit is pursued (table 3).
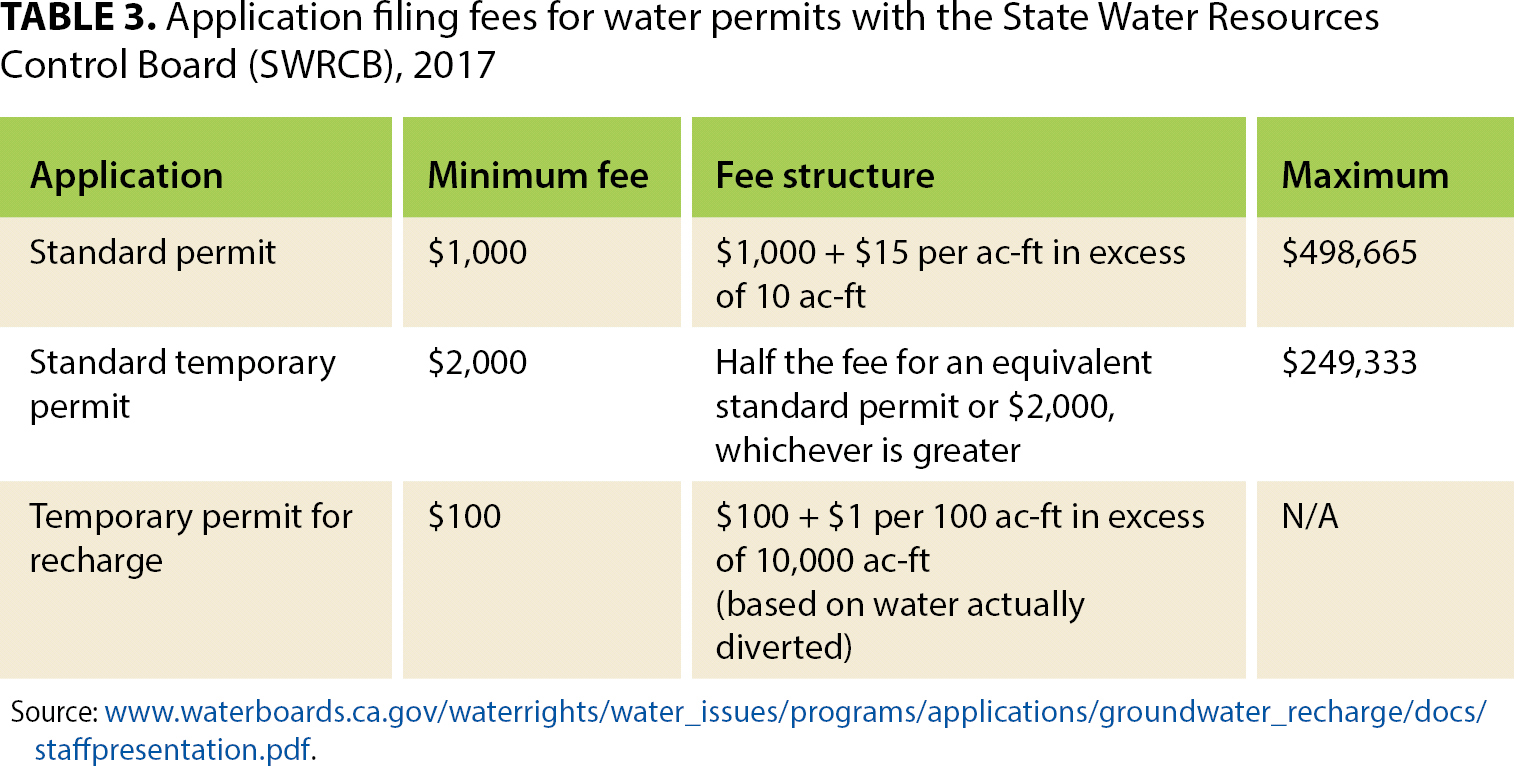
TABLE 3. Application filing fees for water permits with the State Water Resources Control Board (SWRCB), 2017
To capitalize on the recharge rates that some of the most suitable soils promote, landowners may want to consider expanding the capacity of their water conveyance system. For example, to recharge 200 ac-ft in 10 days on an 80 ac field (assuming an infiltration capacity of 3 in per day), the conveyance system would need to have a minimum capacity of 10 cu ft per second (cfs). For soils that can infiltrate water at higher rates (e.g., 1 ft per day), such as the Stoner gravelly loam in the Scott Valley site, a diversion capacity of 40 cfs would be needed for an 80 ac field. The least cost-extensive method would be to divert water using the existing conveyance capacity and apply the water using the same method as during the growing season (i.e., irrigation of individual checks); alternatively, if the conveyance capacity does not support the infiltration capacity of the soil, the area to which the water is applied could be reduced to match the water delivery rate of the conveyance system.
Recharged water would provide several benefits to landowners and associated water districts, including increased water supply and water security, achievement of sustainable groundwater management goals, flood protection, improved water quality, reduction in imported water use, mitigation of land subsidence and seawater intrusion, and long-term benefits for nearby groundwater-dependent ecosystems (e.g., rivers, wetlands). The recharged water would also provide indirect benefits to the conjunctive use of surface and groundwater resources and might stimulate statewide trading of water, which, considering an average market price of $650 per ac-ft of water in 2015 (Howitt et al. 2015), might provide a supplemental source of income for alfalfa growers. These tradeoffs and economic incentives could inform and motivate agricultural groundwater banking programs statewide. Hence, the risks and value of groundwater recharge strategies for agricultural fields including alfalfa should be considered as California attempts to balance its groundwater demand with the sustainability of water resources available on a seasonal basis.
Managed winter flooding of alfalfa recharges groundwater with minimal crop damage

