


All Issues
Employment and earnings of California farmworkers in 2015
Publication Information
California Agriculture 72(2):107-113. https://doi.org/10.3733/ca.2017a0043
Published online November 01, 2017
PDF | Citation | Permissions
NALT Keywords
Abstract
The average employment of hired workers in California agriculture (NAICS 11) rose over 10% between 2005 and 2015, when some 16,400 agricultural establishments hired an average 421,300 workers who were paid a total of $12.8 billion, which was 27% of the state's $47 billion in farm sales. This means that a full-time equivalent (FTE) employee would earn $30,300, implying an hourly wage of $14.55 for 2,080 hours of work. We extracted all Social Security numbers reported by California agricultural establishments and found that the average annual pay received by the 848,000 workers who had at least one job on California farms was $20,500 in 2015, two-thirds of the average annual wage of an FTE worker, reflecting some combination of lower wages and less than full-year work.
Full text
California has led the nation in farm sales since 1950, when Los Angeles County had more farm sales than any other county in the United States, largely because of specialization in the production of high-value fruit, nut and vegetable (FVH) crops. California's farm sales in 2015 were $47 billion, including $18 billion from the sale of fruits and nuts, $9 billion from vegetables and melons, and $5 billion from horticultural specialties such as floriculture, nurseries and mushrooms. That is, $32 billion, or two-thirds, of farm sales were from these FVH crops. The leading farm counties, Tulare, Kern and Fresno, each had farm sales of almost $7 billion in 2015 (CDFA 2017).
The production of many fruits and vegetables is labor-intensive, meaning that labor represents 20% to 40% of production costs for table grapes, strawberries and other commodities.
Average employment of 421,300 farmworkers in 2015 represents 12 monthly snapshots of persons on the payroll during the pay period that includes the 12th of the month. However, total wages of $12.8 billion are all wages paid to all workers, including those who were employed at other times during the month (but not during the pay period that includes the 12th of the month) and those who earned wages from nonfarm employers.

Farmworkers harvest lettuce at Lakeside Organic Gardens in Watsonville, Santa Cruz County. In 2015, two-thirds of California's farm sales were from fruit, nut and vegetable crops, many of which are labor intensive.
A worker who was employed 2,080 hours — the number of hours California's Employment Development Department (EDD) considers full-time and full-year employment — would earn an average annual pay of $30,300, which prompted the Los Angeles Times to ask why, despite implied hourly wages of almost $15 per hour, U.S.-born workers reject farm jobs (Kitroeff and Mohan 2017). The answer is that few farmworkers are employed year-round; many are employed fewer than 2,080 hours a year. In 2015, the average earnings of all workers with at least one farm job was $20,500.
EDD does not collect hours of work data from employers who are paying unemployment insurance taxes, but does collect the earnings and employment data that we use in this article. The National Agricultural Workers Survey (NAWS) collects hours of work data from California crop workers, and found that they were employed an average of 47 hours during the week before they were interviewed in 2015–16. American Community Survey (ACS) data, also collected from workers, shows that both crop and livestock workers were employed slightly more than 40 hours a week. The NAWS and ACS do not collect data on annual hours worked. However, if workers averaged more than 40 hours a week over 52 weeks, average hourly earnings would be lower than $15.
Nonsupervisory production workers do most of the work on the state's largest farms that produce labor-intensive FVH crops. About 90% of California crop workers were born in Mexico, and 60% are unauthorized, according to the NAWS, which is 10 percentage points higher than the U.S. average of 50% unauthorized crop workers (Carroll 2017). The reason for more unauthorized workers in California is that it has a higher share of foreign-born workers: most foreign-born workers are unauthorized, and California's 90% share of foreign-born crop workers exceeds the 60% foreign-born share in the rest of the United States. A slowdown in unauthorized migration can put upward pressure on wages.
The dominance of labor-intensive crops in California, and the Trump administration's efforts to step up border and interior enforcement, has increased interest in the availability of farmworkers. EDD regularly obtains data on farmworkers and wages paid when employers pay unemployment insurance taxes. Employers who pay more than $100 in quarterly wages are required to register with the EDD and pay taxes of up to 6% on the first $7,000 of each worker's earnings to cover the cost of unemployment insurance benefits for laid-off workers.
We extracted all Social Security numbers (SSNs) reported by California agricultural employers (NAICS 11) in 2015 and tabulated all of the farm and nonfarm jobs and earnings of these farmworkers. This allowed us to assign workers who had more than one job to their primary commodity, the North American Industry Classification System (NAICS, www.census.gov/eos/www/naics/ ) code of the employer(s), and the county where they had their maximum earnings.
Average employment and farmworkers
Figure 1 shows average employment in California crop agriculture since 2007. Average employment rose over 10%, but there was an important change in crop agriculture after 2007, when nonfarm crop support employers — those who bring workers to crop farms, such as farm labor contractors (FLCs) — began to bring more workers to farms than were hired directly by crop farmers. There are several reasons why farmers may turn to FLCs for workers, including the ability of FLCs to assemble crews of workers at lower cost than farmers who hire workers directly.
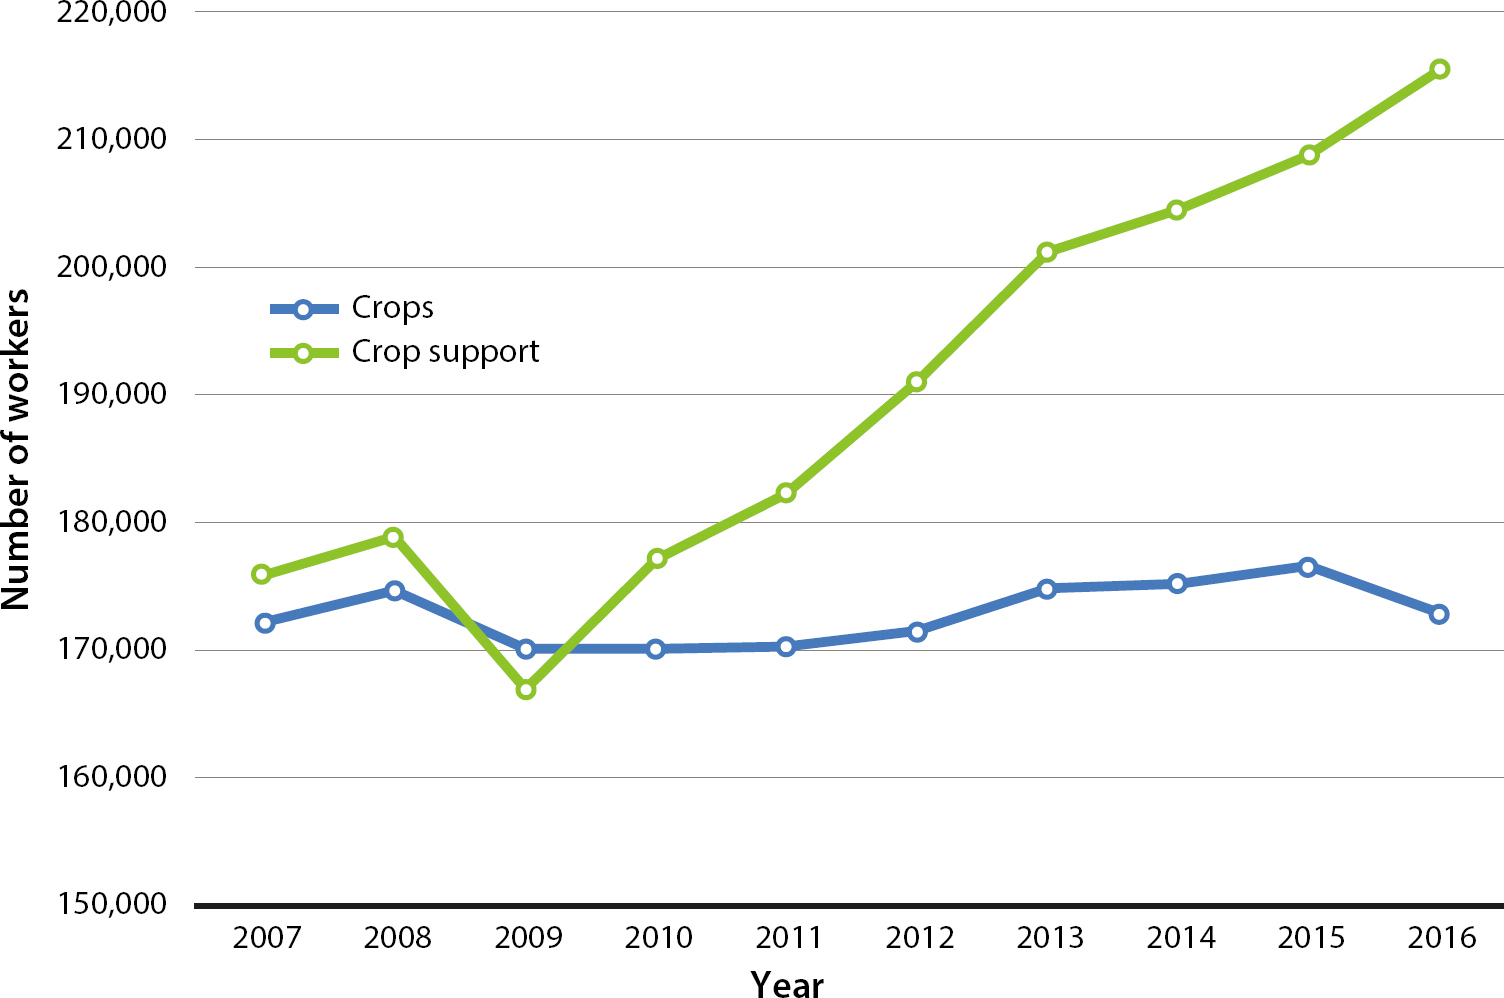
Fig. 1. Average California crop and crop support employment, 2007–2016. Crop employment refers to workers hired directly by farmers, and crop support refers to nonfarm employers that bring workers to farms, such as farm labor contractors.
According to EDD data, over the past decade crop farmers (NAICS 111) have hired a few more workers directly, animal agriculture (NAICS 112) has had stable average employment, and there has been a sharp increase in crop support employment (1151), most of it with FLCs. The average employment of crop support establishments has been rising by 10,000 a year, so that in 2016 nonfarm crop support firms brought an average 215,000 full-time equivalent (FTE) workers to crop farms, more than the average 173,000 FTE workers that these farms hired directly (fig. 1). Average FTE employment in animal agriculture has been stable at about 29,000, while animal support employment fell slightly.
The total number of farmworkers employed sometime during the year is larger than average employment because of seasonality and turnover. In 2015, employment peaked at 475,000 in July and reached a low of 350,000 in December, guaranteeing at least 475,000 unique farmworkers. The actual number of workers is higher because of turnover: some workers do only a few days or weeks of farm work and quit, and workers employed in the Coachella and Imperial Valleys during the winter and spring rarely migrate to the San Joaquin Valley for the summer harvest, so different workers are required in different areas.
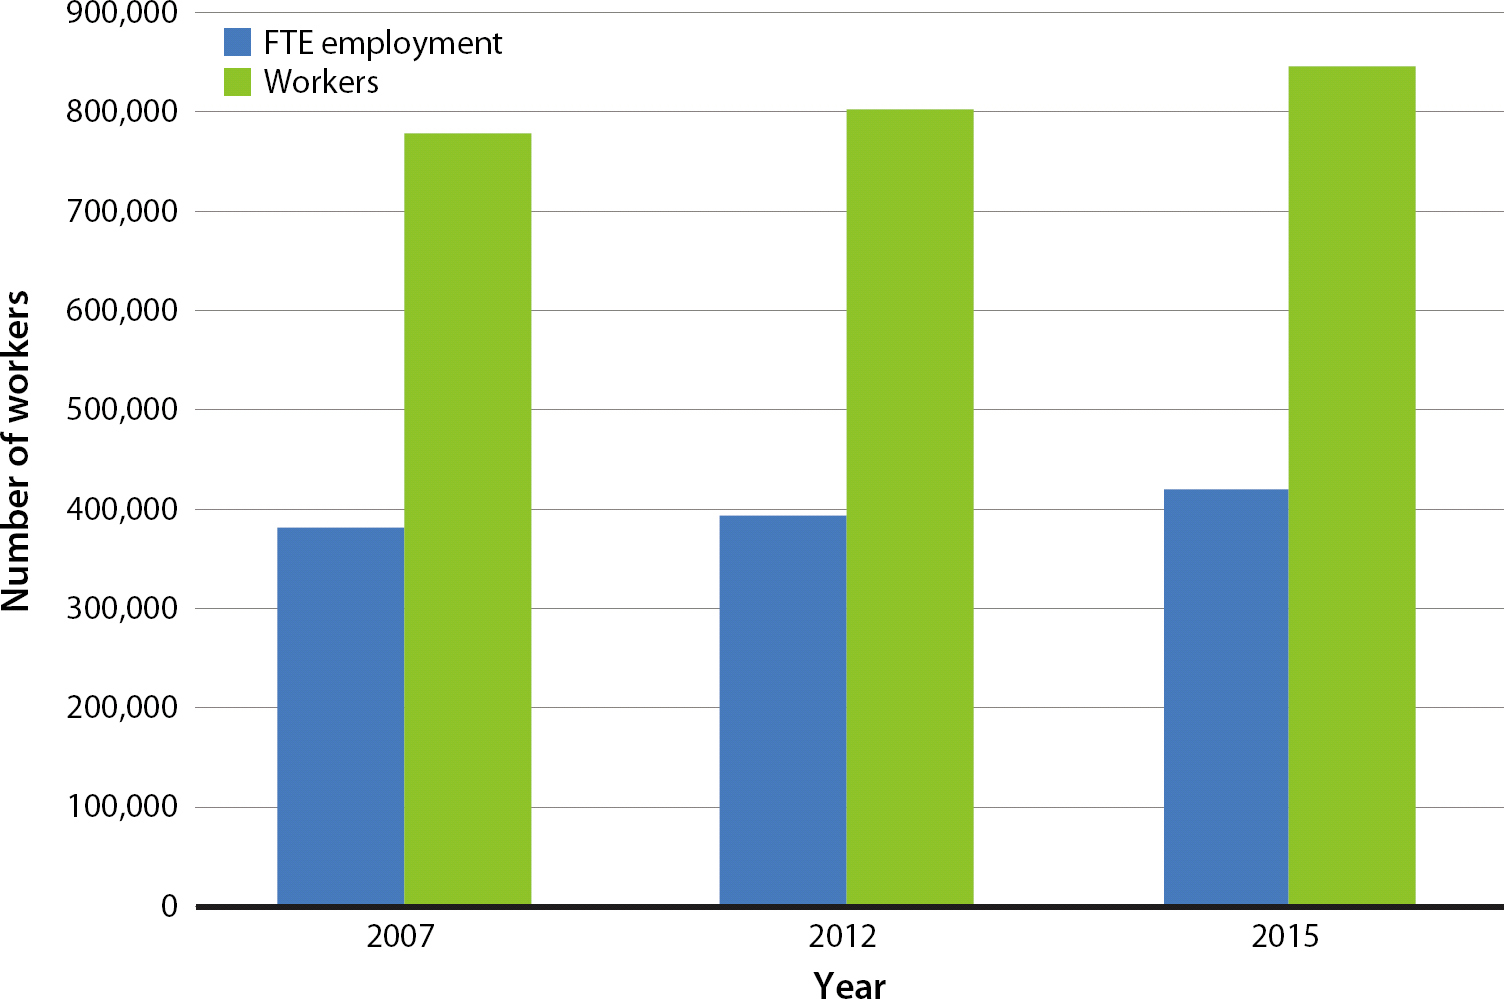
Our analysis captures all workers hired by farm employers. After making adjustments for what appeared to be false or shared SSNs, in 2015 there were 848,000 unique SSNs reported by agricultural establishments, twice the average FTE employment of 421,000 (fig. 2). This suggests two workers per FTE job, a ratio that has been stable over the past decade. Average FTE employment and the number of unique farmworkers each rose 10% between 2007 and 2015.
FTE employment, average earnings
The average annual pay of FTE agricultural workers varies by commodity. In 2015, the average annual pay of a directly hired FTE crop worker was $32,500, that of an FTE animal worker was $35,900, and that of an FTE crop support worker was $27,500.
Table 1 presents data on the number of establishments, average employment and average annual pay for California commodities where average employment was at least 10,000 employees. The four crop categories in the table accounted for almost all establishments and average employment in the NAICS code for crops (111); dairies accounted for half of NAICS 112 animal employer establishments and two-thirds of animal employment and total wages. The four crop support services listed under NAICS 1151 in the table accounted for almost all of the establishments, average employment, and total wages in the crop support category.
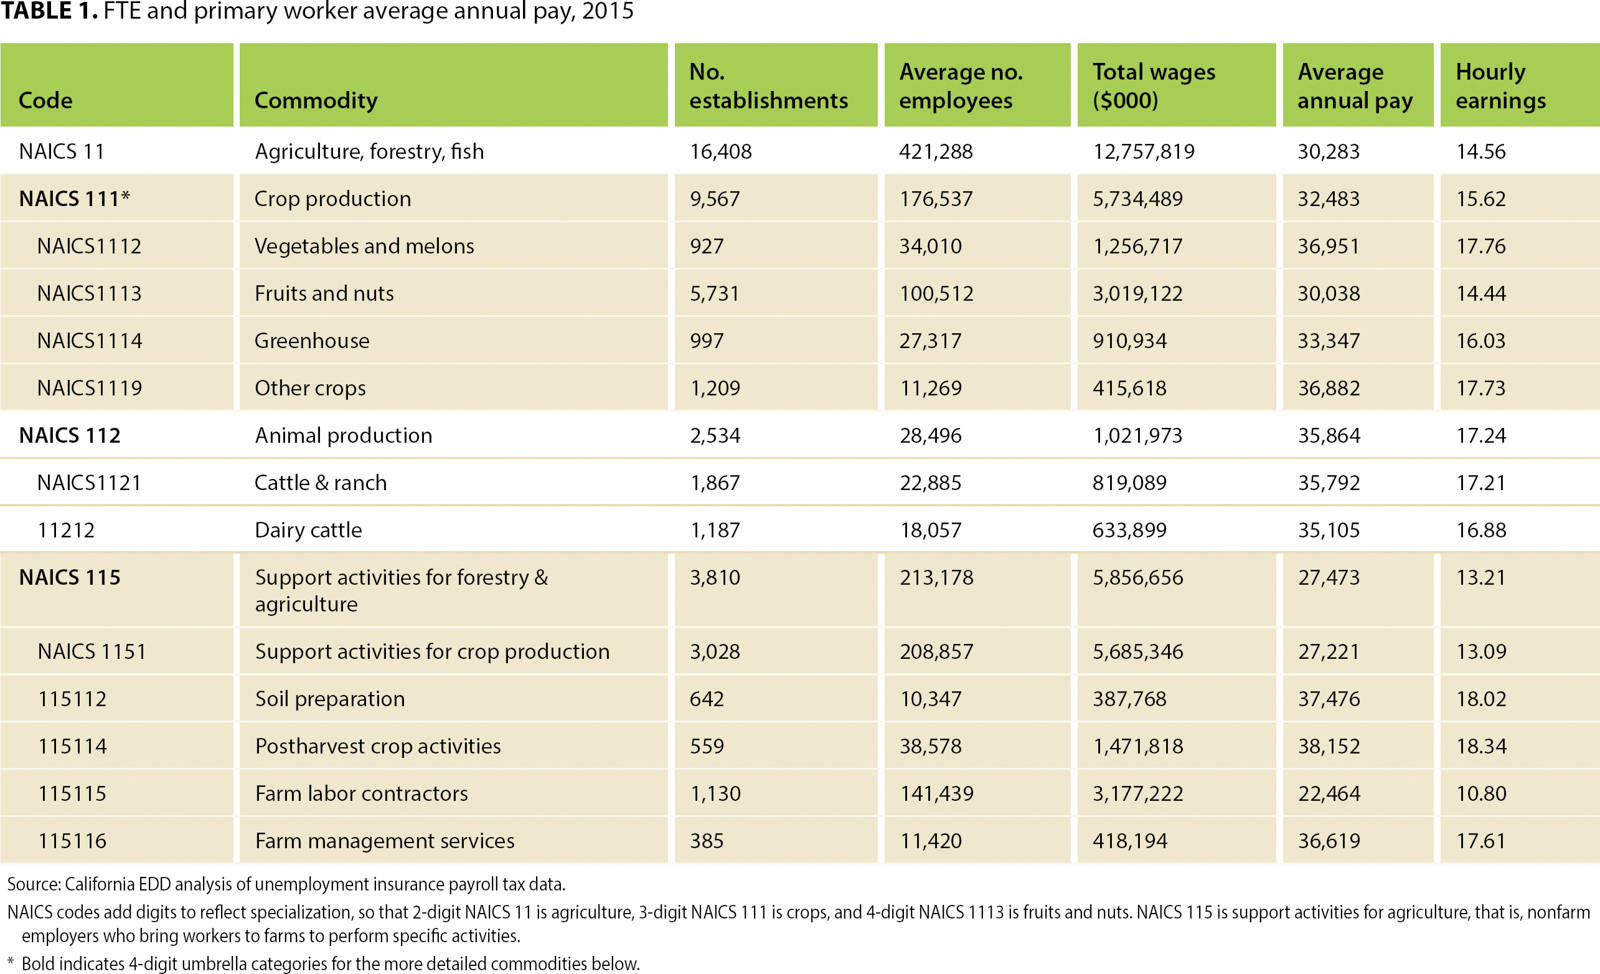
Farm employment is concentrated in a few commodities. Fruits and nuts accounted for 57% of average direct-hire crop employment in 2015, dairy for 64% of direct-hire animal employment, and FLCs for two-thirds of average crop support employment. For a FTE worker, the implied average hourly earnings ranged from a low of $10.80 for FLC employees to $18.34 for other post-harvest activities such as cooling and cleaning crops after they are harvested. California's minimum wage was $9 per hour in 2015.
Since we have data on all workers who were employed in a commodity, we can calculate the difference between the earnings of an FTE worker and the earnings of an average worker. We assigned farmworkers to the commodity or NAICS code in which they had their highest earnings, and found that 705,000 workers had their maximum earnings from a farm employer; we call these workers primary farmworkers. Table 2 shows that these primary farmworkers averaged $17,434, or 58%, of what an FTE worker employed in agriculture would have earned.
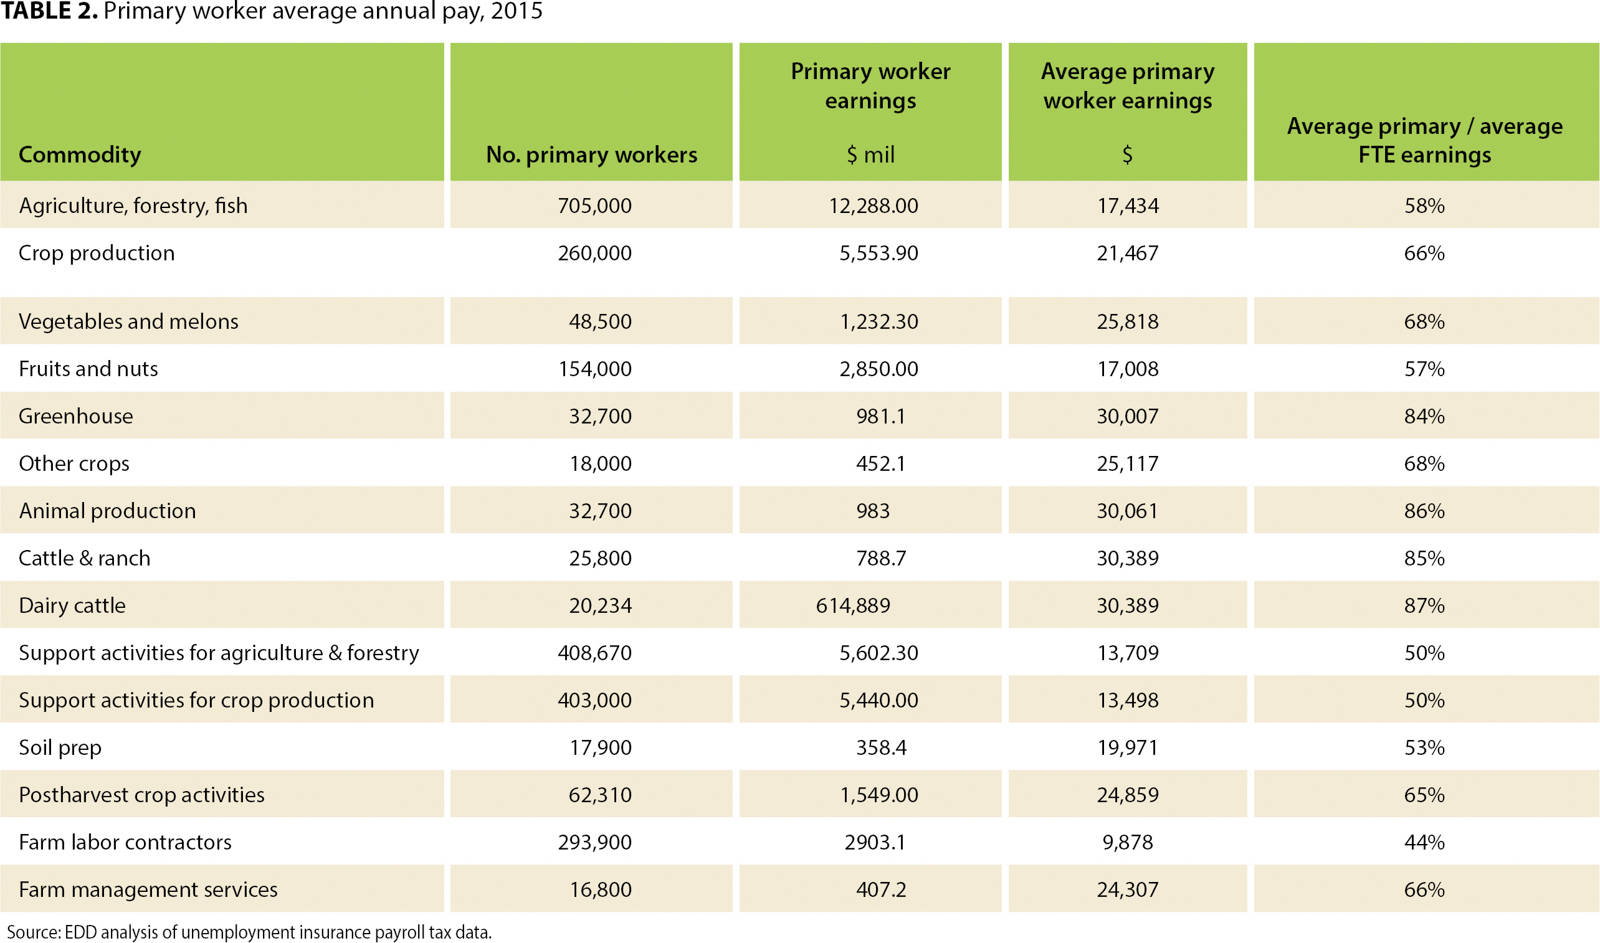
We assigned the 705,000 primary farmworkers to the NAICS code or commodity in which they had their maximum earnings in order to determine what share of FTE earnings in that commodity a typical worker received; for over 100,000 farmworkers, this was a nonfarm NAICS or employer. Primary crop workers were those whose maximum earnings were from employers with NAICS 111, and they averaged $21,467, two-thirds of what an FTE crop worker would have earned (table 2). Those whose maximum earnings were in greenhouses and nurseries earned 84% of FTE earnings in this commodity, while those whose maximum earnings were in more seasonal fruits and nuts earned 57% as much.
Primary workers in animal agriculture earned 86% of what an FTE animal worker would have earned, and dairy workers, who were almost two-thirds of primary animal agriculture employment, earned 87% of what an FTE dairy worker would have earned (table 2), likely reflecting more hours of work during the year.
Support service workers outside of crops earned almost as much as an FTE worker, but not crop support workers, who earned only half of what an FTE crop support worker would receive. The seasonality and turnover in crop support means that primary workers employed by FLCs, the largest group of workers, earned only 44% as much as an FTE worker employed by FLCs (table 2).
Since the implied hourly wage for an FTE worker employed by FLCs was only slightly above the state's minimum wage, the low average earnings of primary FLC employees must arise from fewer hours of work. A worker employed 1,000 hours at $9.86 an hour would have earned the average amount of a primary FLC employee in 2015, $9,878.
Most primary agricultural workers, 70%, had only one job in 2015; this was a farm job, since having a farm job was necessary to be selected. Over 85% of animal workers employed in sheep, hogs and poultry had just one job in 2015, but less than 60% of workers who were employed in strawberries and vegetables had only one job. About 70% of primary FLC employees had one job in 2015.
A quarter of farmworkers, some 223,000, had two or more jobs, and 18% had three or more jobs. Half of the 51,500 primary FLC workers who had two or more jobs in 2015 had one farm and one nonfarm job, while two-thirds of the 11,300 post-harvest crop support workers had one farm and one nonfarm job. Half of the primary FLC workers with two or more jobs got at least 75% of their annual pay from FLCs, just as half of the dairy workers with two or more jobs got at least 75% of their annual pay from dairies. This same pattern held for most commodities, viz, half or more of two-job workers with primary earnings from strawberries or vegetables got at least 75% of their annual pay from this same commodity.
A quarter of the 51,500 primary FLC workers with two or more jobs in 2015 had at least two farm jobs and one nonfarm job. However, these 14,000 workers were only 5% of the 293,000 workers whose primary earnings were with FLCs and less than 2% of all farmworkers, suggesting that combining farm and nonfarm jobs is relatively rare.
Employment by county
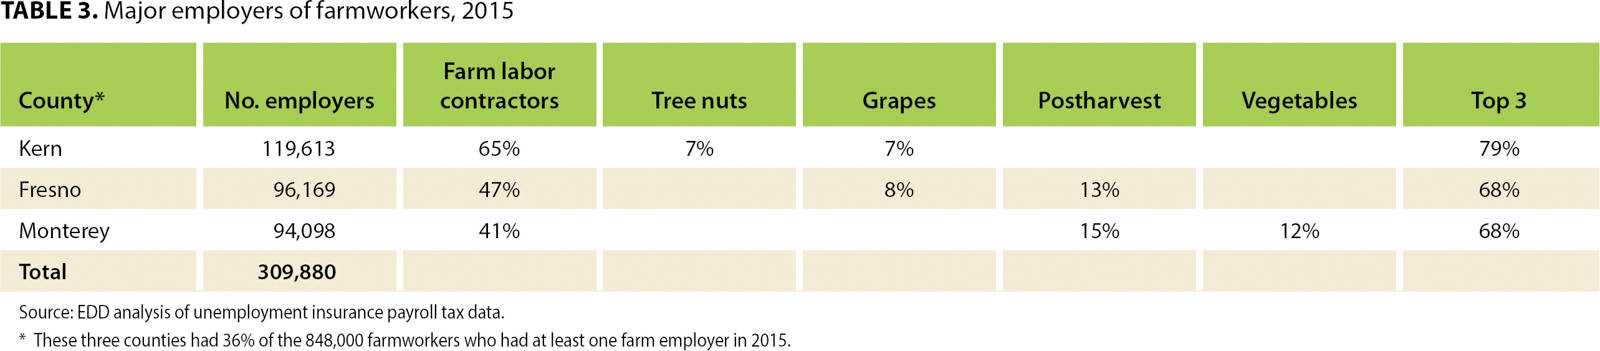
The 848,000 workers with at least one farm employer in 2015 can be assigned to the county where they had their highest-earning job, which could be a farm or a nonfarm job. Kern (119,000), Fresno (96,000) and Monterey (94,000) had 36% of the state's farmworkers, and the eight counties that each had at least 30,000 farmworkers had over 60% of the total, including Tulare (72,000), Ventura (36,000), San Joaquin (35,000) and Santa Barbara and Los Angeles (32,000 each) (fig. 3). Workers are assigned to the county of their employer, so that an employee of an agribusiness operating in several counties could be assigned to the headquarters county.

The largest employer in most counties was an FLC (NAICS 115115): they employed 65% of primary workers in Kern County, 47% in Fresno County and 41% in Monterey County (table 3). In Kern County, the next largest employers were tree nuts (111335) and grape vineyards (111332), each with 7% of primary workers. In Fresno, the next largest were employers engaged in postharvest activities (115114) with 13% of workers and grape vineyards with 8%. In Monterey, postharvest activities employed 15% of primary workers, vegetable farming (111219) 12% and strawberry farming (111333) 11%.
In Tulare County, FLCs accounted for 54% of farmworkers, followed by 9% for postharvest activities and 7% for dairy (112120). In Ventura County, 32% of farm workers were in strawberry farming, followed by 19% with FLCs and 16% with other berries (111334).
Los Angeles was the most unusual county. All workers had to have one farm employer to be included in the analysis, but the largest employers of farmworkers who had their highest earnings in Los Angeles County were employment services (NAICS 5613), with 12% of farmworkers; restaurants (7225), 8%; nurseries (111421), 4%; and strawberries, 3%. In Napa County, 34% of the 8,000 farmworkers were employed by grape vineyards, followed by 32% employed by farm management services (115116); 7% each were employed by FLCs and beverage manufacturers (3121).
Conclusions
These data, which approximate a census of hired workers in California agriculture, show significant gaps between the earnings a full-time employee would receive and the average earnings of farmworkers. Since a full-time employee is defined as working 2,080 hours per year, a $30,283 annual wage suggests an hourly wage of $14.56 per hour. However, the actual average earnings of California farmworkers were $17,445 in 2015, suggesting fewer hours of work or lower hourly earnings.
Data on hours worked are not collected by EDD, making it difficult to explain the gap between average and FTE earnings. However, the analysis leads to three conclusions. First, there are far more farmworkers than year-round equivalent jobs even as agriculture is becoming less seasonal and more workers are settling in one area and working for only one farm employer. An earlier study found almost three workers for each year-round farm job in the 1990s and more workers with more than one farm job (Khan et al. 2004). Since 2007, there have been two unique workers for each average agricultural job in California.
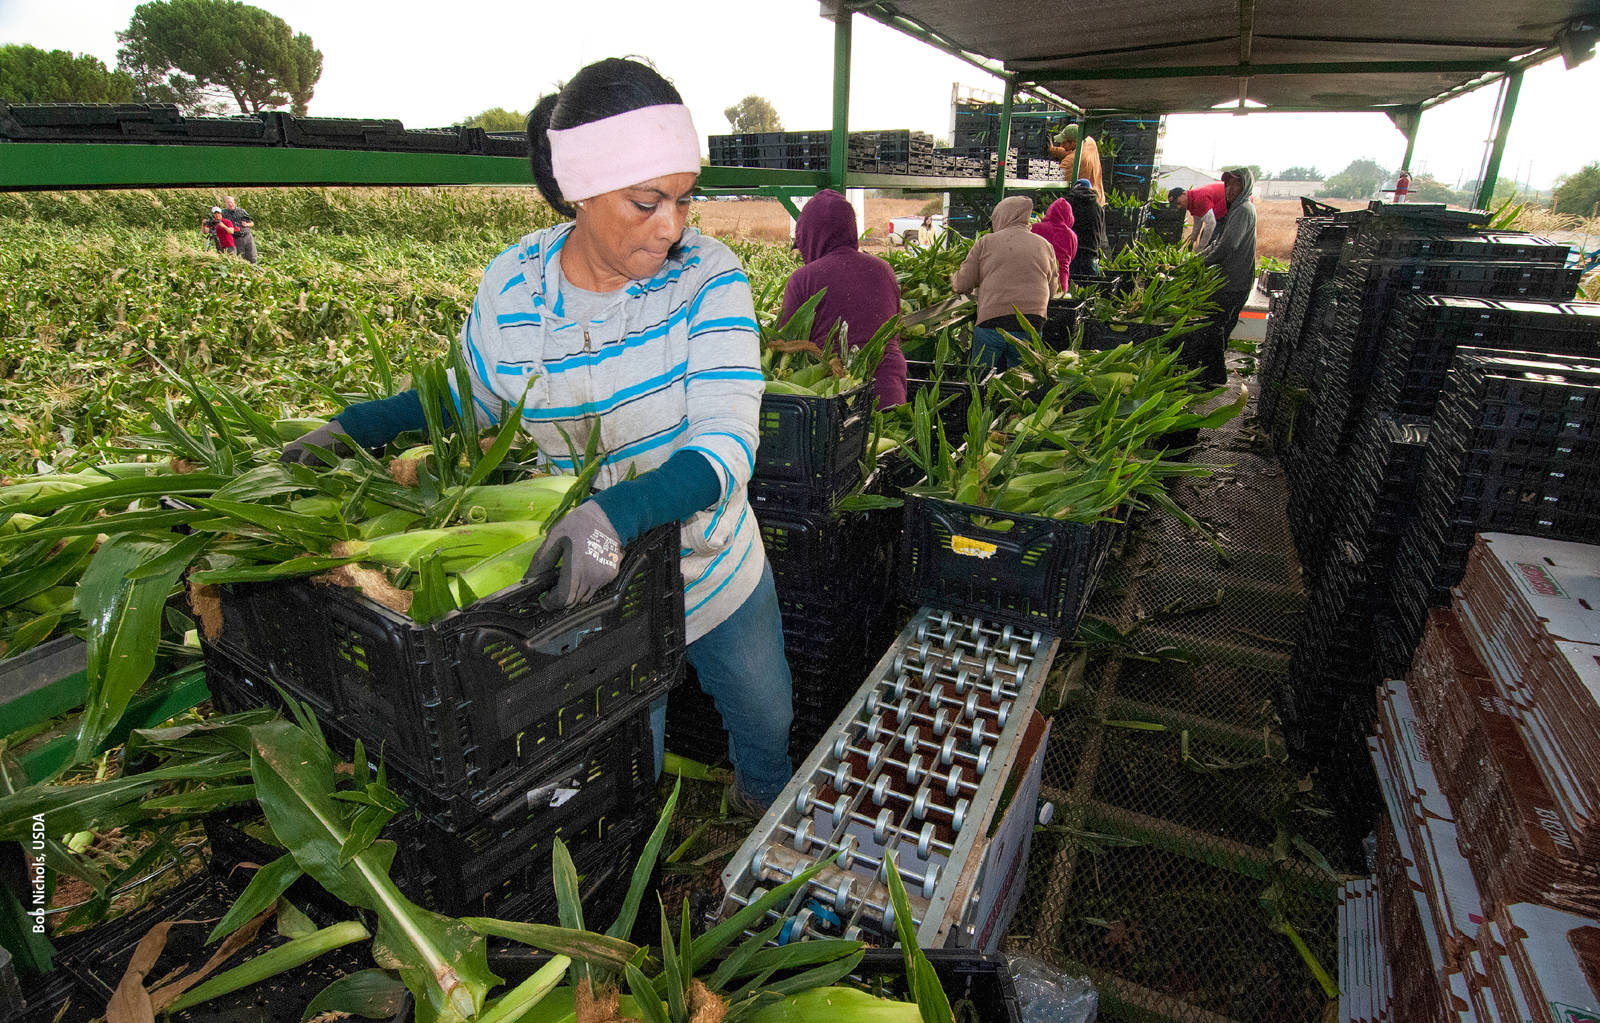
Farmworkers harvest corn in Gilroy, Santa Clara County. Few farmworkers are employed year-round due to seasonality and turnover. In 2015, the average earnings of all workers with at least one farm job was $20,500, which is about two-thirds the average annual wage of a full-time equivalent worker.
Second, apparent stability in the farm labor market, defined as more workers having only one farm employer, may be misleading. A third of FTE employment and unique workers are employed by FLCs, and workers with one FLC employer during the year may nonetheless work on more than one farm. The shift from farmers hiring workers directly to relying on nonfarm intermediaries to bring workers to their farms may suggest stability in the sense that more workers have one employer, but the jobs of these workers may be on many farms, sometimes necessitating the lengthy commutes described by the Los Angeles Times of workers who lived in Stockton and commuted almost 2 hours one way to jobs in Napa (Kitroeff and Mohan 2017).
Third, procuring farmworkers via intermediaries should increase labor market efficiency, as FLCs specialize in finding a series of farm jobs for their employees (Thilmany 1996). However, workers employed primarily by FLCs earned only 44% of what an FTE employee would have earned, suggesting that FLCs are unable to provide their employees with full-year work. The implied average hourly wage of an FTE employee of a FLC was $10.80 an hour when the state minimum wage was $9 in 2015, suggesting that many FLC employees worked fewer than 1,000 hours per year. Farmers may be using FLCs to fill many of the seasonal jobs on their farms, explaining why workers employed by FLCs have fewer hours of work.
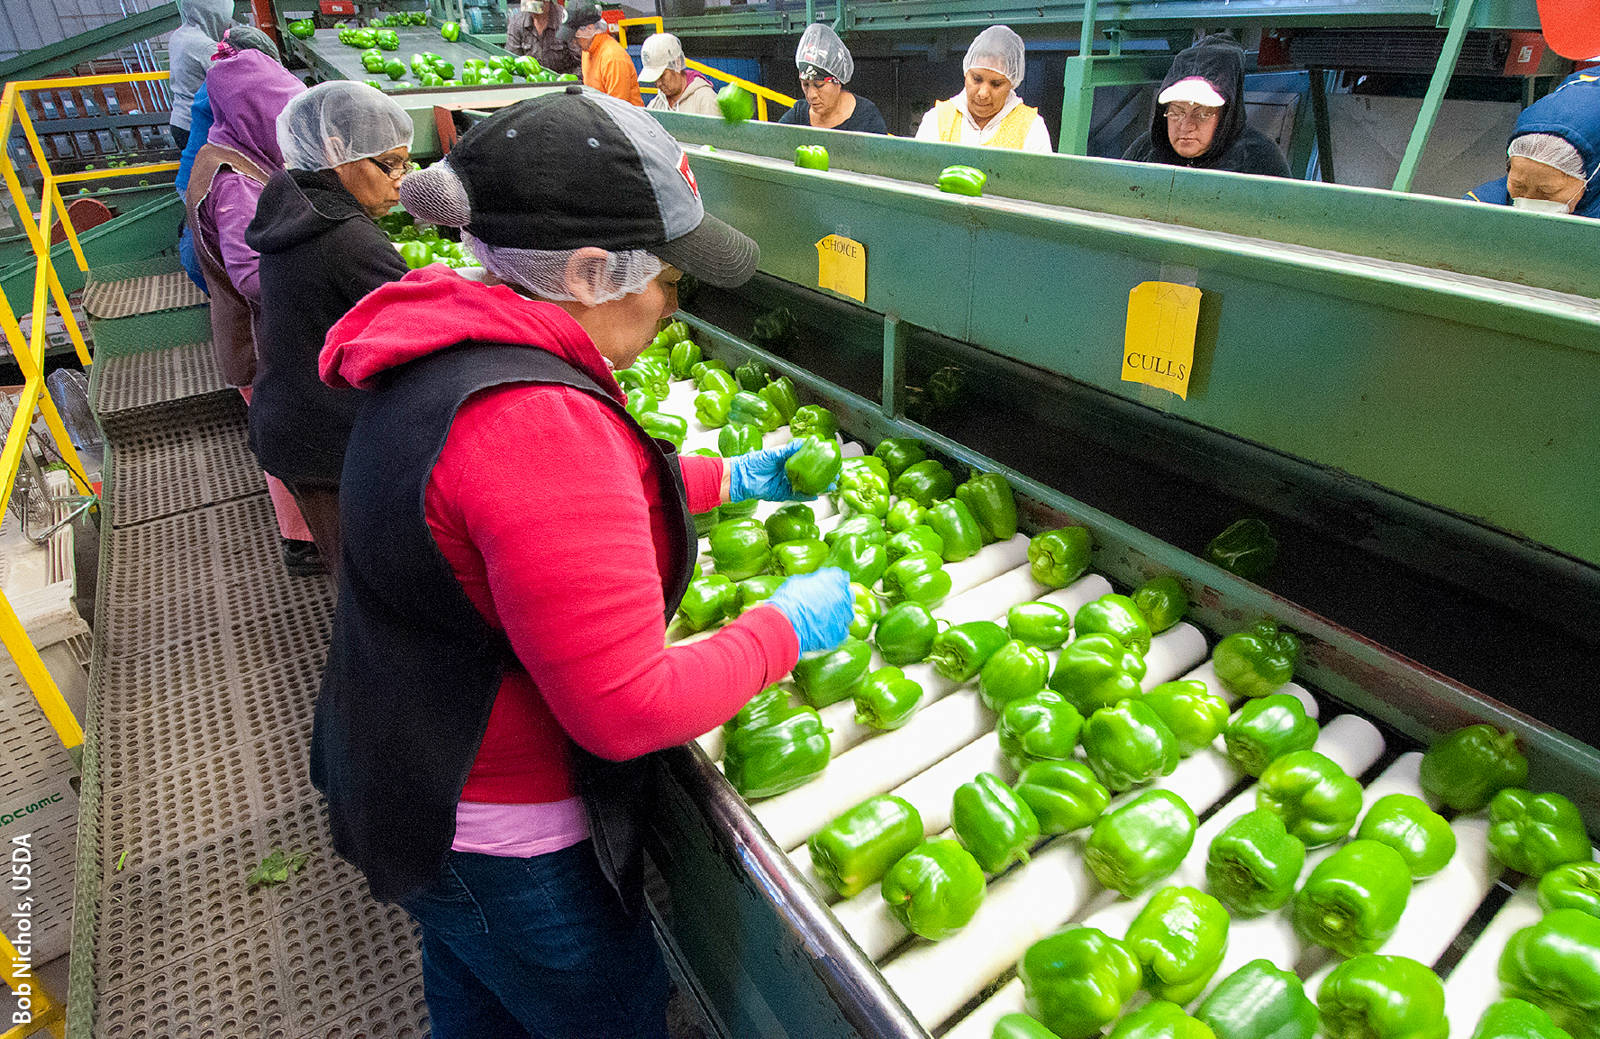
Processing green peppers in Gilroy. In the past 10 years, some farmers have shifted from hiring workers directly to using farm labor contractors to bring workers to their farms. However, research suggests that contractors aren't able to provide full-year work.
Farmers, worker advocates and governments have struggled to rationalize the farm labor market so that the fewest workers can maximize worker earnings while accomplishing the work to be done. The ratio of unique workers to FTE jobs fell from three to two during the 1990s, and since 2007 this ratio has stabilized at two to one. The past decade has been marked by the growing importance of nonfarm intermediaries, especially FLCs, bringing farmworkers to crop farms, converting what in the past may have been migration from one farm employer to another to workers with the same FLC moving from farm to farm.
Immigration trends and policy could speed or slow the trend toward more workers being brought to farms by FLCs and earning less than half of an FTE worker. Farmers are responding to the slowdown in new and unauthorized arrivals via the four S's: satisfying them to keep them in farm work longer, stretching them with productivity-increasing mechanical aids and management changes such as fewer re-picks of fields and orchards, substituting machines for workers where possible, and supplementing an aging and settled workforce with young and legal H-2A guest workers (Martin 2017). The H-2A program could be modified to make it easier to employ guest workers, which could mark a return to the 1950s, when legal Mexican Braceros who were housed on the farms where they worked were the norm (Martin 2003).
Employment and earnings of California farmworkers in 2015

