


All Issues
N2O emissions from California farmlands: A review
Publication Information
California Agriculture 71(3):148-159. https://doi.org/10.3733/ca.2017a0026
Published online September 13, 2017
PDF | Citation | Permissions
NALT Keywords
Abstract
Of the greenhouse gases emitted from cropland, nitrous oxide (N2O) has the highest global warming potential. The state of California acknowledges that agriculture both contributes to and is affected by climate change, and in 2016 it adopted legislation to help growers reduce emissions of greenhouse gases, explicitly including N2O. Nitrous oxide emissions can vary widely due to environmental and agronomic factors with most emission estimates coming from temperate grain systems. There is, however, a dearth of emission estimates from perennial and vegetable cropping systems commonly found in California's Mediterranean climate. Therefore, emission factors (EFs) specific to California conditions are needed to accurately assess statewide N2O emissions and mitigation options. In this paper, we review 16 studies reporting annual and seasonal N2O emissions. This data set represents all available studies on measured emissions at the whole field scale and on an event basis. Through this series of studies, we discuss how such farm management and environmental factors influence N2O emissions from California agriculture and may serve as a basis for improved EF calculations.
Full text
The application of nitrogen (N) in the form of inorganic fertilizers, cover crops, manure, or compost is necessary to maintain economically viable yields without depleting soil N. However, increases in agricultural N application are not always balanced by plant N uptake or soil N storage, leading to an imbalance and potential loss of reactive N to the atmosphere or to other ecosystems where it significantly contributes to air and water pollution and global warming (Davidson et al. 2012; Galloway et al. 2003). The worldwide application of N has risen sharply in the past 70 years, and California is no exception to this trend (Rosenstock et al. 2013).

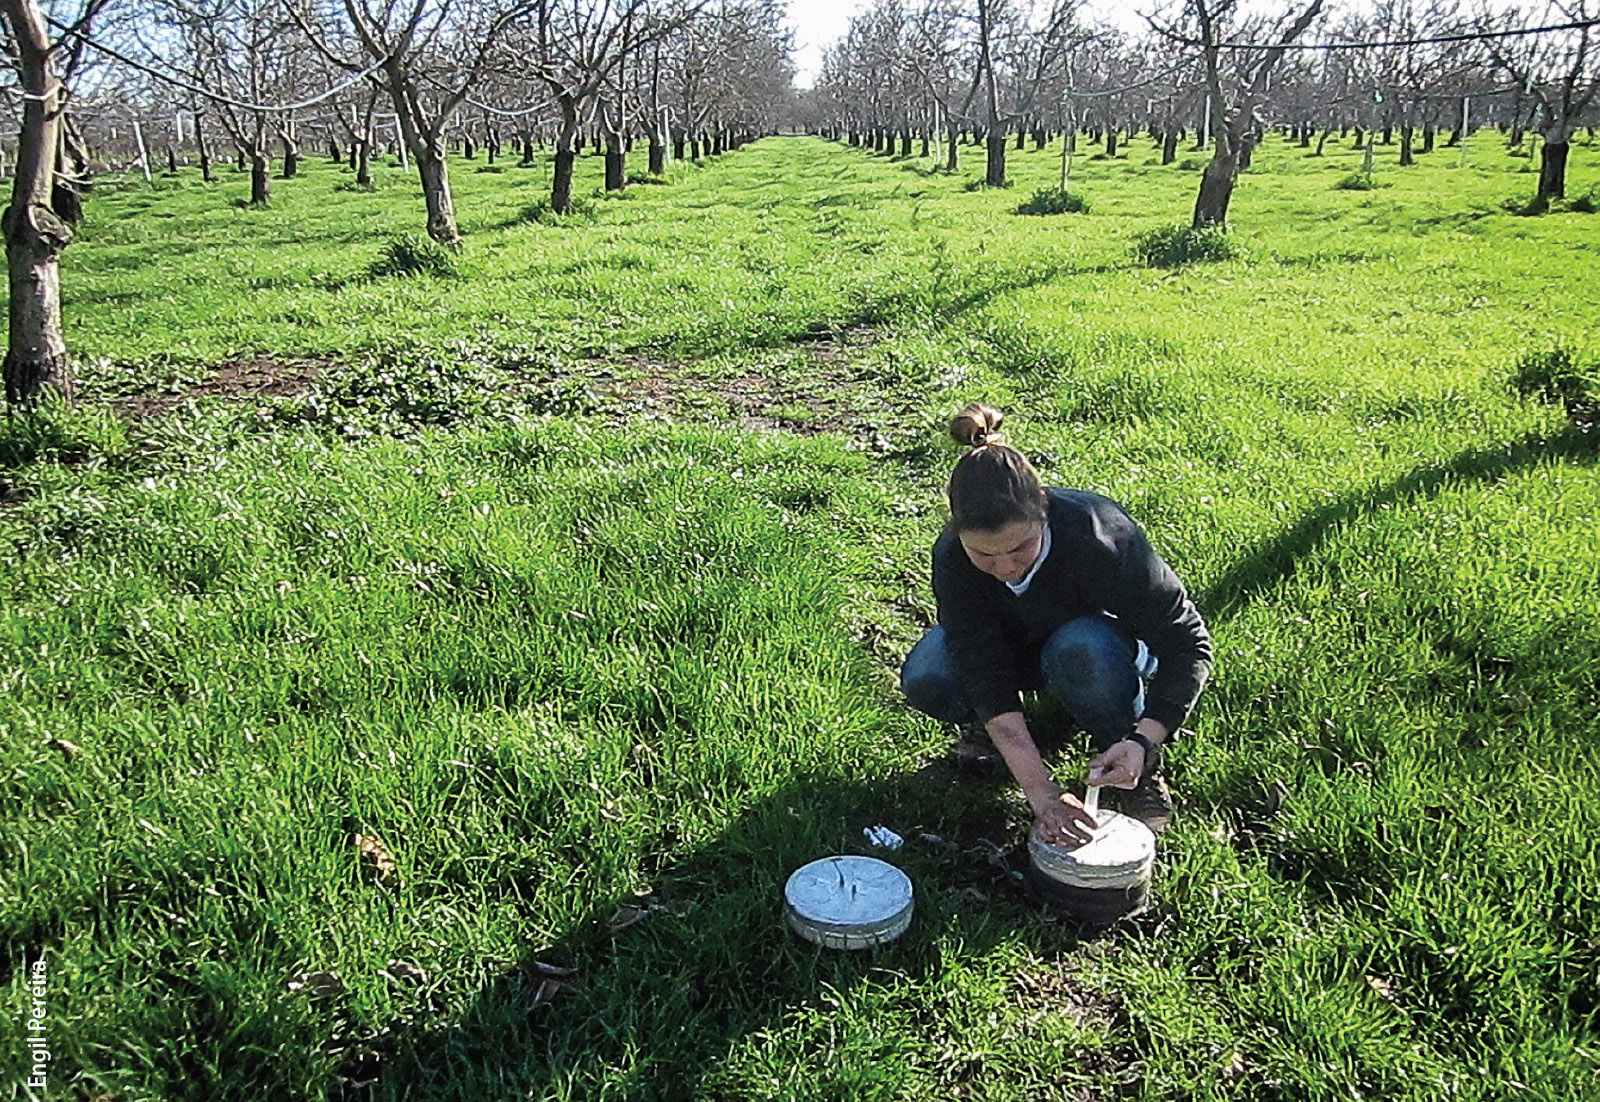
Automated gas flux chambers monitor N2O emissions in an almond orchard. Current estimates of emissions from cropland in California are based on the assumption that, in every crop system, 1% of the nitrogen applied as fertilizer is emitted as N2O. Findings from the studies reported in this review provide more nuanced estimates, reflecting the large differences in emissions factors among crop systems.
With a global warming potential 298 times greater than carbon dioxide (CO2), nitrous oxide (N2O) is the most potent of the three major agricultural greenhouse gases (CO2, methane [CH4] and N2O). Of anthropogenic sources, N2O emissions are also the largest contributor to ozone depletion (Ravishankara et al. 2009), with agriculture accounting for more than 60% of global N2O emissions (Mosier et al. 1998).
In California, N2O emissions accounted for 2.8% (on a CO2-equivalent basis) of statewide greenhouse gas emissions in 2014, of which agricultural soils made up 51% of emissions (CARB 2014). Current statewide emissions are calculated from global default emission factors (EFs) set by the Intergovernmental Panel on Climate Change (IPCC) based on a constant fraction of the amount of N applied. A default EF of 1.0% is typically applied, meaning that 1.0% of applied N is assumed to be lost as N2O.
Global default EFs for specific management and N sources do exist, for example, ranging from 0.03% to 2.0% for flooded rice and manure, respectively. Yet high uncertainty surrounds these estimates, particularly for systems where little empirical data is available. Direct N2O emissions generally do not represent an economically important loss to growers, but the high global warming potential of N2O means these emissions have significant environmental impacts.
Indirect N2O emissions may occur from leaching of dissolved N2O in soil and surface water and subsequent off-gassing or leaching of nitrate (NO3−), which may later be reduced to N2, producing N2O in the process. NO3 leaching may be extensive in irrigated systems that have periodic high N excess loads. Barum et al. (2016) calculated annual NO3−-N losses of 71 to 214 lbs per acre per year (80 to 240 kg per hectare per year) in a California almond orchard. Clearly the management of such N losses is important for both economic, environmental, and human health reasons far beyond the potential for this N to be a source of N2O. However, indirect emissions are beyond the scope of this review.
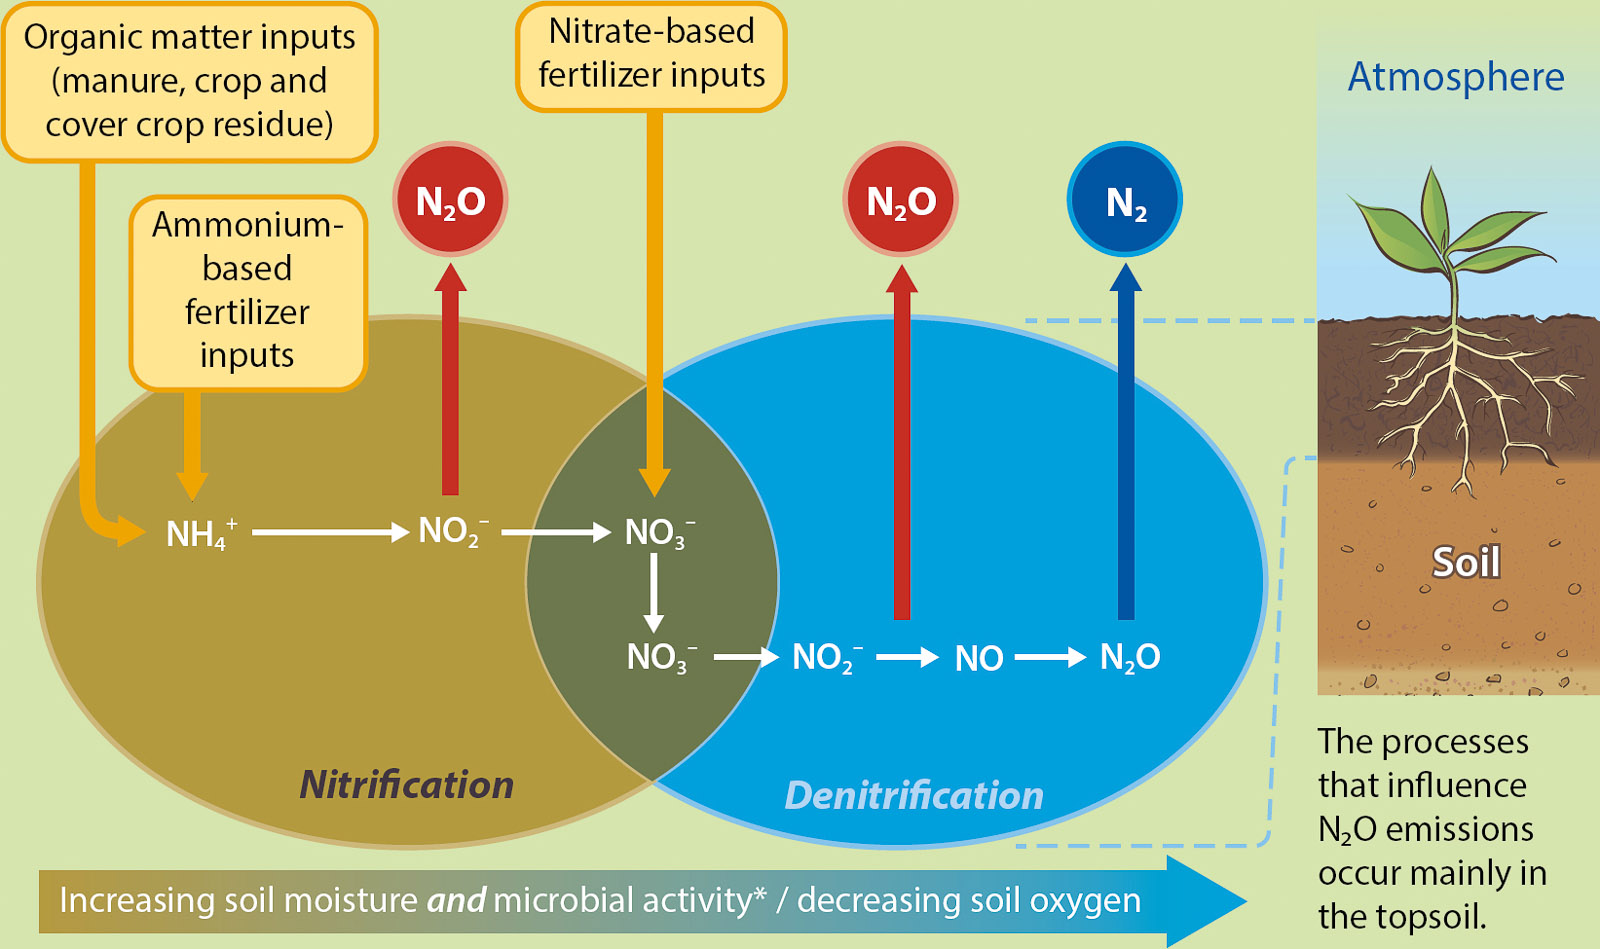
How is N2O produced?
In agricultural systems, N2O is primarily produced through two microbial pathways: nitrification, which converts ammonium (NH4+) to NO3−, and denitrification, which converts NO3− to N2 (Box 1). Both processes produce N2O as a byproduct and can occur simultaneously in soil. However, nitrification is an aerobic process that requires oxygen, while denitrification is an anaerobic process that is inhibited at high oxygen concentrations. In soil, the oxygen content is largely controlled by soil moisture; when soil moisture is high, oxygen content is low and vice versa. Soil oxygen content is also controlled by microbial respiration and is related positively to the moisture content up to levels near saturation when a lack of oxygen inhibits many microbial processes. During periods of high microbial activity, soil oxygen is consumed, leading to an increase in N2O production from nitrification (Zhu et al. 2013). Denitrifiers also consume N2O when soil moisture is very high (Firestone and Davidson 1989). Therefore, soil moisture plays a large role in determining which process occurs and how much N2O is eventually emitted from the soil. Soil bulk density, texture and structure also strongly influence soil moisture, oxygen and gas exchange, and therefore influence many microbial processes, including N2O production and consumption.
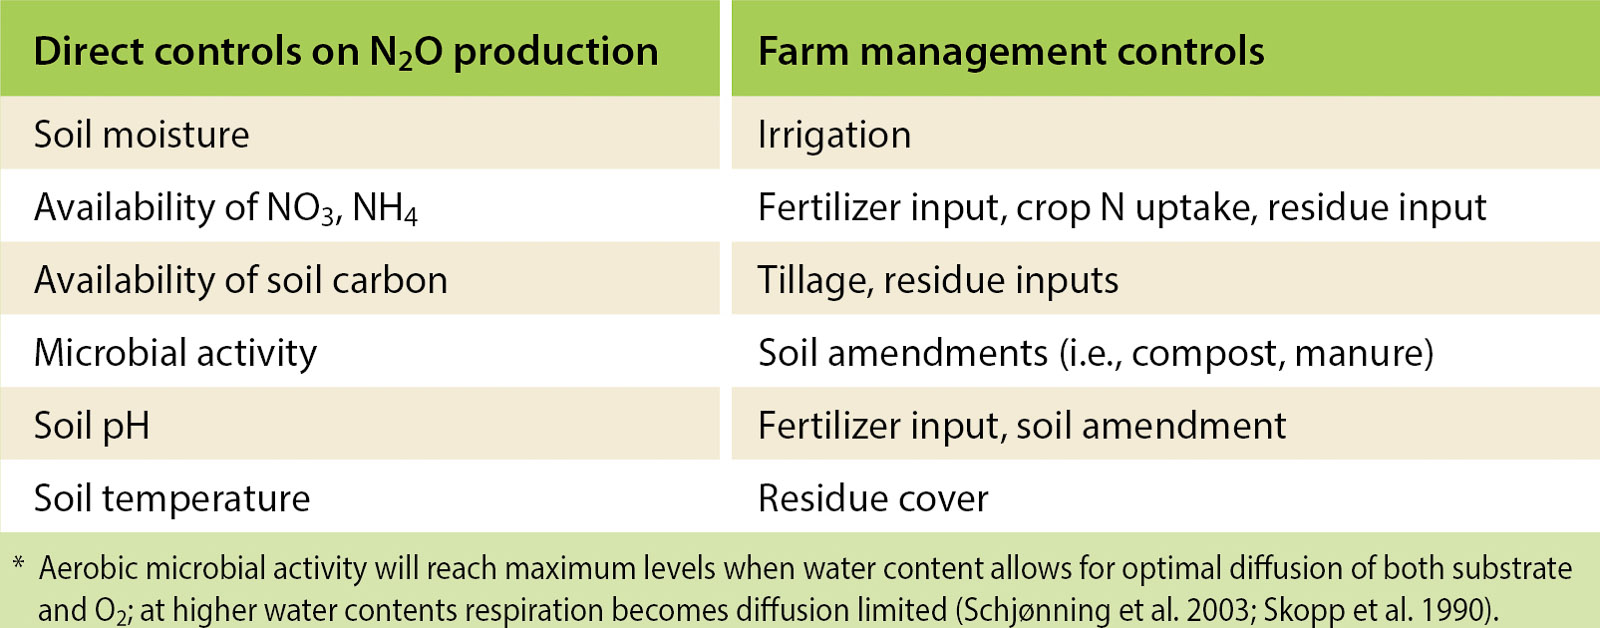
Box 1.
Factors influencing cropland N2O emissions
N2O emissions are determined by a combination of factors (below). The impact of a change in one factor depends on the values of the other factors.
Management implications for N2O mitigation
Increase nitrogen use efficiency. Irrigation and fertilization methods that allow for increased synchronization of N supply with plant demand increase plant N uptake and reduce N losses. Fall application of fertilizer likely decreases N use efficiency by increasing precipitation-induced N losses through nitrate leaching and N2O emissions.
Increase water use efficiency. Buried drip and microjet irrigation systems can increase water use efficiency and reduce N2O emissions.
Source of N does not matter. Both synthetic- and organic-derived N contributes to N2O emissions. The application of organic matter as an N source provides valuable soil C, but increases the likelihood of climatic interactions (e.g., exposure to precipitation) and increases spatial and inter-annual variability in N2O emissions. To the extent that is possible, incorporation of plant residues or N application before significant rainfall or irrigation should be avoided.
Importance of multiple variables in N2O emissions. In all systems covered in this review, fertilization induced N2O emissions, but no correlation between total N application rate and annual emissions was found. Thus, factors other than N application rate had a strong influence on emissions (e.g., soil type or irrigation method). In conclusion, default EFs based on N application rate may not be accurate for many California systems.
Year-round emissions. Fallow/winter season emissions are significant, representing between 29% and 64% of annual emissions. Both perennial and annual systems have the potential for high fallow/winter season emission pulses. Emissions occurring after the first seasonal fall rain dominate total winter/fallow season emissions; emissions shortly after fertilization dominate total growing season emissions.
Along with soil oxygen content, which is mostly determined by soil moisture and microbial activity, other soil environmental conditions (i.e., pH and temperature) and substrate availability (NH4+, NO3− and soil carbon [C]) control microbial N2O production and consumption rates (see Box 1). The magnitude of each of these controls is in turn subject to their own set of biological and abiotic controls. Thus, much of the difficulty in predicting, measuring and managing N2O emissions lies in understanding the interactions among these controlling factors.
California cropping systems and climate
The relatively arid, Mediterranean climate of California tends to favor nitrification, which occurs at lower soil moisture (Bateman and Baggs 2005). However, any irrigation event will increase soil moisture and microbial activity leading to the potential to increase N2O pulses from both nitrification and denitrification (Scheer et al. 2008). The release of N and C from sudden soil wetting such as in irrigation events has been shown to fuel N2O production from both nitrification and denitrification (Harrison-Kirk et al. 2013). In a review of N2O emissions in Mediterranean systems, Aguilera et al. (2013) reported mean emissions four times higher in irrigated compared to rain-fed systems. Warm soil temperatures, which occur often in California, also tend to increase N2O emissions (Smith et al. 1998). Denitrification derived N2O emissions generally increase with increases in soil organic matter and C inputs, and rates may be partially C limited in low soil C systems, which could be the case for many California agroecosystems (Harrison-Kirk et al. 2013; Kennedy, Decock and Six 2013).
Unique to California is the growing importance of perennial orchard and vineyard cropping systems, which cover roughly half of the irrigated production acreage (CDFA 2016; NASS 2014) but are underrepresented in the global body of scientific literature on N2O emissions. Perennial systems pose unique challenges to N2O emission quantification because of the discrete management practices in the tree/vine row (cropped area) versus the tractor row (noncropped area).
Data collection
The data set we present here consists of 12 studies in which one or more of the authors of this article were involved and four additional studies that were found to meet our criteria for sampling frequency. Only studies with a minimum sampling frequency of two times per month were considered. All studies meeting this criterion utilized “event based” sampling, where sampling occurred daily for 3 to 7 days or until fluxes returned to background levels following fertilization, precipitation and selected additional management events dependent on the crop (i.e., tillage, irrigation, mowing, drainage, flooding). Three studies were found that did not meet these criteria for sampling frequency (Lee et al. 2009; Smukler et al. 2012; Townsend-Small et al. 2011). Together, this body of work comes from four research groups at UC Davis.
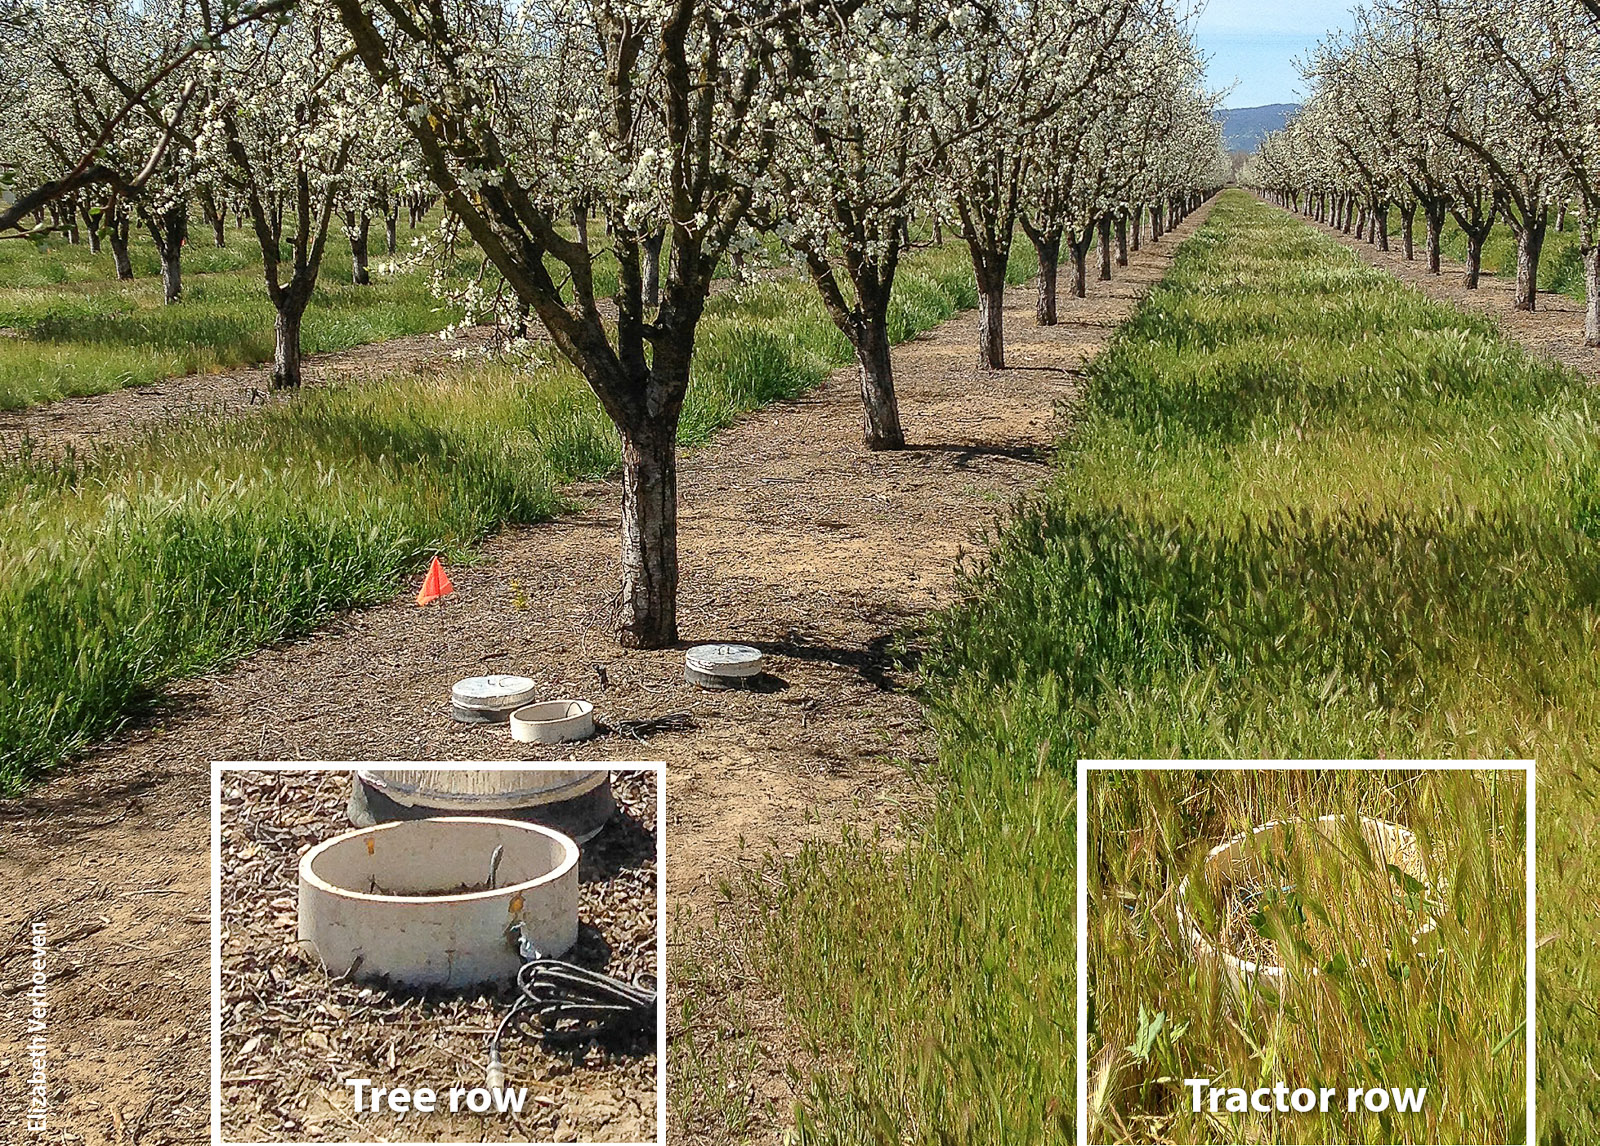
Gas flux chambers deployed in two functional locations — the tree row and tractor row — in a prune orchard. It is important to measure emissions from both locations because of differences in soil moisture, the availability of nitrogen compounds, soil temperature and other factors.
Within the 16 studies we identified 26 distinct treatment x year combinations (observations, n = 26) (table 1). Complete data and methodological details for 13 of the 16 studies are reported in individual papers (Adviento-Borbe et al. 2013; Alsina et al. 2013; Angst et al. 2014; Decock et al. 2017; Garland et al. 2011; Garland et al. 2014; Kennedy, Suddick, Six 2013; Lazcano et al. 2016; Pereira et al. 2016; Pittelkow et al. 2013; Schellenberg et al. 2012; Verhoeven and Six 2014; Zhu-Barker et al. 2015). Our intent was to report only data representing standard regional practices; thus, only values from treatments following established management and N application rates were used. Data for four additional observations are part of unpublished data sets (E. Verhoeven et al., unpublished; M. Burger, Department of Land, Air and Water Resources, UC Davis, unpublished).
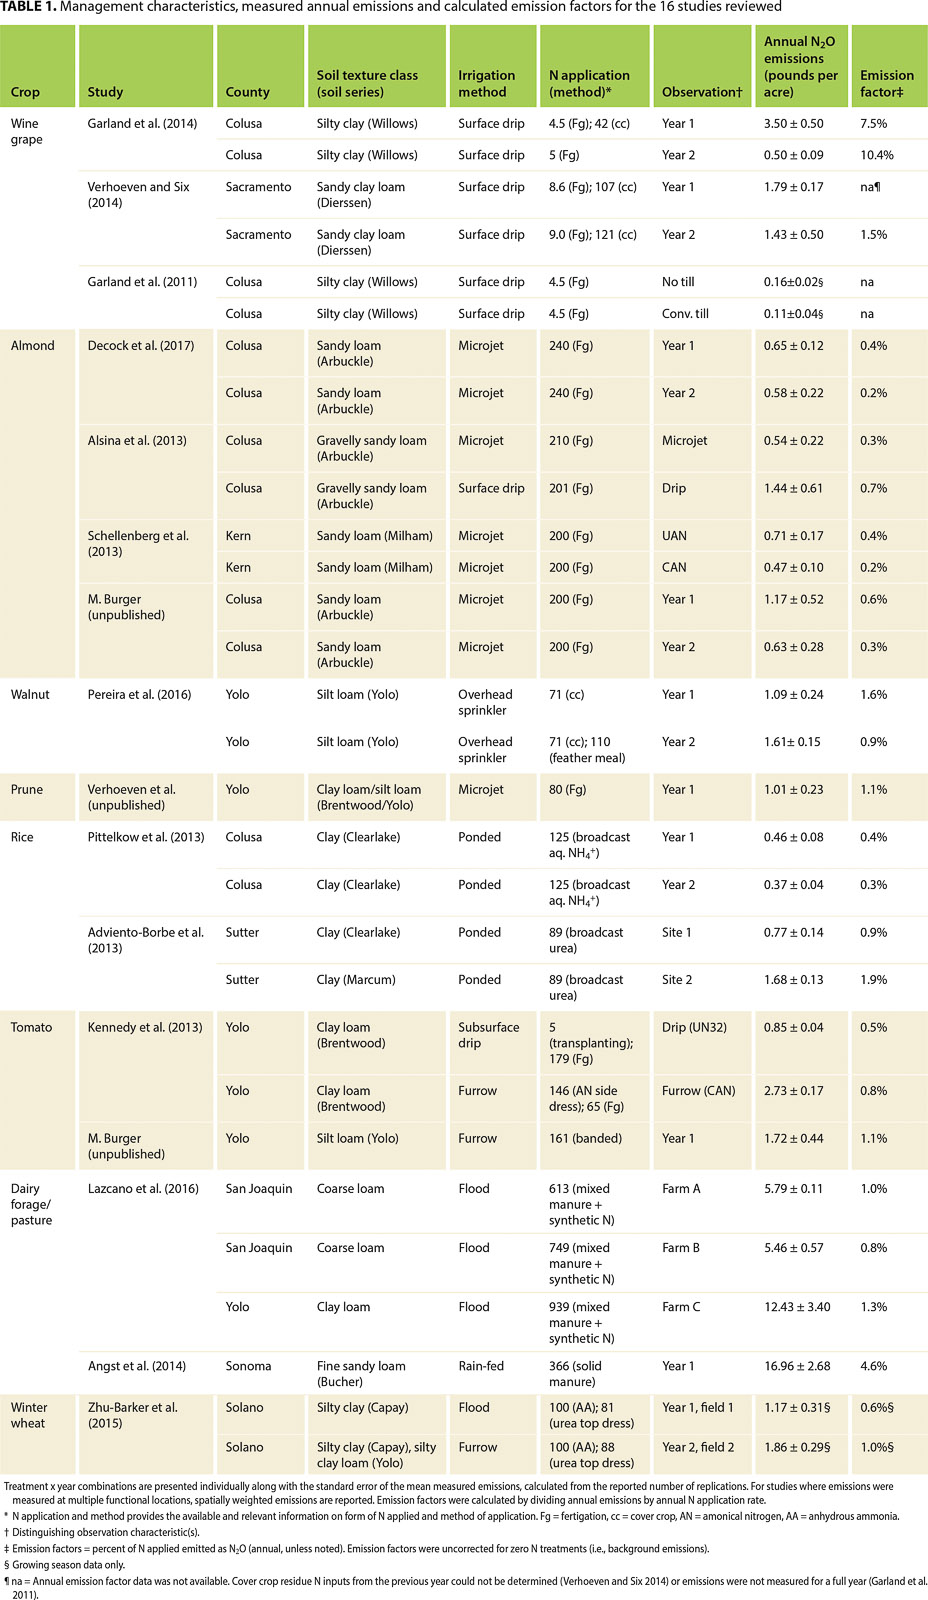
TABLE 1. Management characteristics, measured annual emissions and calculated emission factors for the 16 studies reviewed
In each study, in-situ N2O measurements were taken using vented, static flux chambers as described by Parkin and Venterea (2010) and Hutchinson and Mosier (1981). Briefly, headspace air samples were collected at discrete intervals, injected into preevacuated Exetainer vials and later analyzed on a gas chromatograph. Mean annual emissions were linearly interpolated from daily flux values. When emissions were measured at multiple spatial locations in a given field, weighted averages based on spatial coverage were calculated and are reported in table 1. For full methodological details see Verhoeven and Six (2014). Comparisons between functional locations (fig. 1) or season (fig. 2) were done on studies where disaggregated data was available.
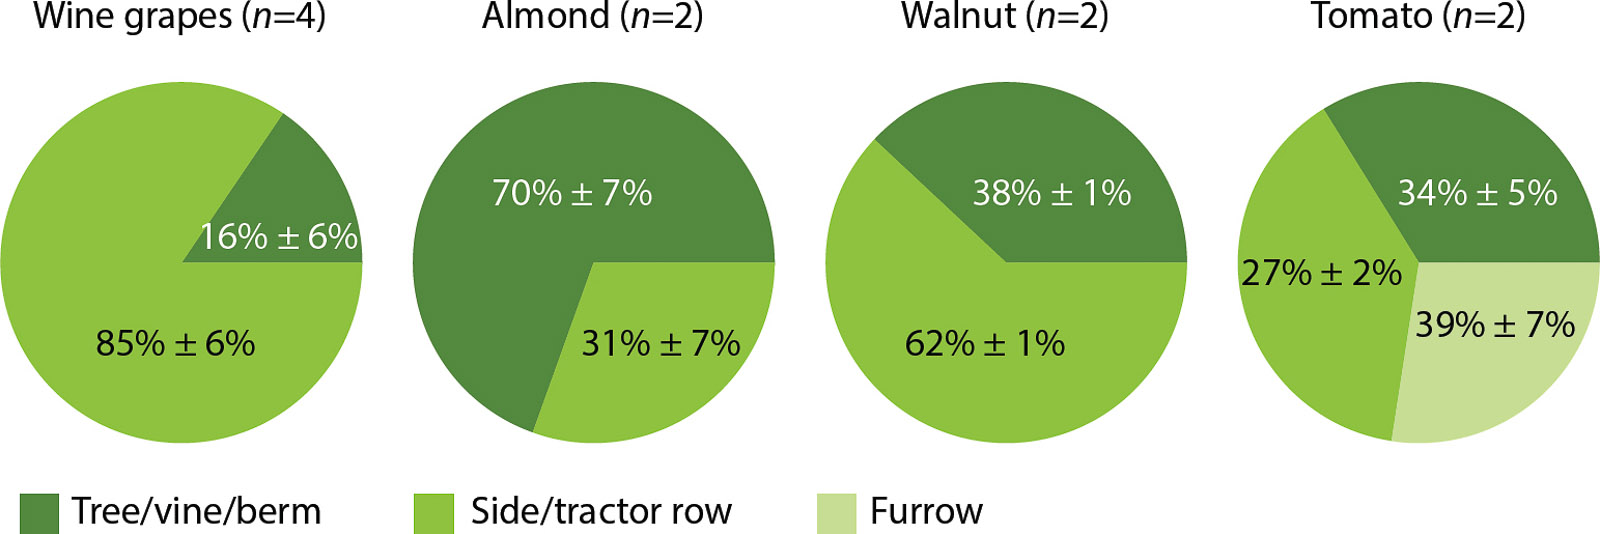
Fig. 1. Percent of annual emissions occurring from a given functional location. Values are means from studies reporting emissions at discrete functional locations.

Fig. 2. Percent of annual emissions occurring during the winter/fallow season (September/October through March/April) or active growing season (March/April through September/October).
Basic field site characteristics, including irrigation and fertilization rates and methods, are reported in table 1. The growing season was defined as April-September or March-August (i.e., budding/planting) and the fallow/winter season as September-March or October-April (i.e., harvest/dormancy). When fertilizer was applied through irrigation systems, it was termed “fertigation”. For all studies, we report system EFs uncorrected for background (zero N) emissions. Adviento-Borbe et al. (2013), Pittelkow et al. (2013) and Zhu-Barker et al. (2015) report fertilizer-induced emission factors (EFfertilizer) in their original papers; therefore, our calculated emission factors differ from these.
Farm management effects on N2O emissions
Agricultural management and cropping systems strongly affect N2O production by altering C and N availability and environmental soil conditions (Box 1). Excluding dairy systems, mean annual N2O emissions for the cropping systems reviewed ranged from 0.77 pounds N2O-N per acre per year for almonds to 10.16 pounds N2O-N per acre per year for dairy forage systems (fig. 3). Aguilera et al. (2013) also found similar values for Mediterranean horticulture systems, 1.34 pounds N2O-N per acre per year, but observed lower emissions, 2.68 pounds N2O-N per acre per year, for liquid slurry systems than our dairy systems. N2O emissions in the majority of systems reported here were only marginally higher than background agricultural emissions (uncropped agricultural soil) or emissions from natural systems at 0.83 pounds N2O-N per acre per year and 0.37 to 0.82 pounds N2O-N per acre per year, respectively (Kim et al. 2013; Stehfest and Bouwman 2006).
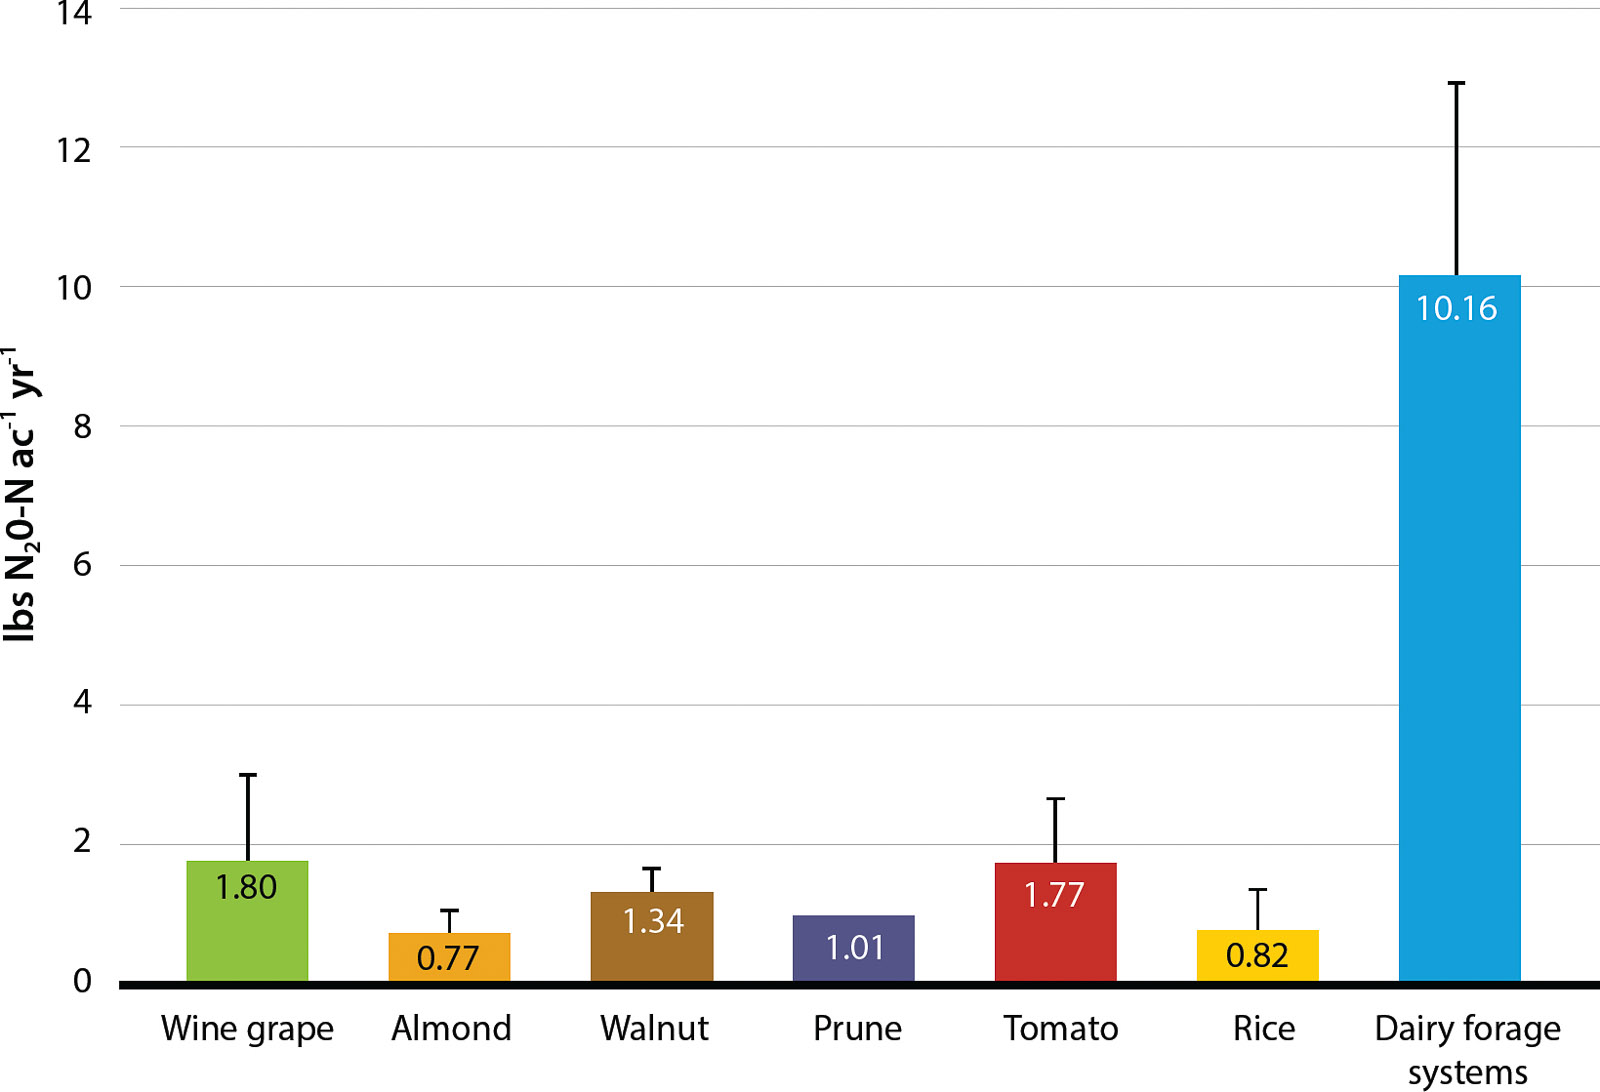
Fig. 3. Average annual N2O emissions for each cropping system. Error bars represent the standard error of the mean. n = number of observations reporting annual emissions; wine grape (n = 4), almond (n = 8), walnut (n = 2), prune (n = 1), tomato (n = 3), rice (n = 4), dairy systems (n = 4). Dairy systems were defined by the production of forage or pasture with high manure N inputs; they include sites with pasture ryegrass, corn + forage mix, corn + winter wheat, corn + ryegrass.
Spatial distribution
In perennial systems, management of the tractor row (noncropped area) is particularly variable across regions, farms and seasons. Tractor rows typically are not deliberately irrigated, but they may be wetted to varying degrees depending on the irrigation system (substantial wetting with overhead sprinkler or furrow irrigation versus little or no wetting with surface/subsurface drip or microjet sprinkler). Tractor rows also may be planted to a leguminous or grass cover crop, or allowed to self-seed with noncultivated vegetation, and they may be tilled or mowed with varying frequency. Since the management of these areas is not as time sensitive nor critical to crop production, the practices are inherently more variable and often no management records are kept for these activities. Among the studies with defined distinct functional locations, the tractor row accounted for 40%, 50%, 73%, and 70% to 82% of spatial coverage and corresponded to 31%, 62%, 57%, and 85% of total weighted emissions for almonds, walnuts, prunes, and wine grapes, respectively (fig. 1). Significantly different patterns of emissions between functional locations imply that both cropped and noncropped locations must be managed to effectively mitigate N2O emissions. Among the perennial systems, tree or vine row emissions peaked at fertilization events while tractor row emissions were most influenced by climatic (i.e., first fall rain) events and were coupled with plant residue management.
Many annual systems are also characterized by distinct spatial heterogeneity between functional locations, typically in relation to how irrigation and fertilizer is applied. For example, working in a tomato system, Kennedy, Suddick and Six (2013) defined three distinct functional locations: berm, side and furrow. The authors observed higher variation in N2O emissions between functional locations in a furrow-irrigated versus drip-irrigated system.

Photos show gas flux chambers and vegetation growth in the tractor row of a vineyard (A) early in cover crop growth, (B) at peak growth and (C) after mowing (with vine row in background). The images illustrate the dramatic differences in vegetation between functional locations and at different points in the year, and thus the need for field measurements of N2O emissions across functional locations and throughout the year.
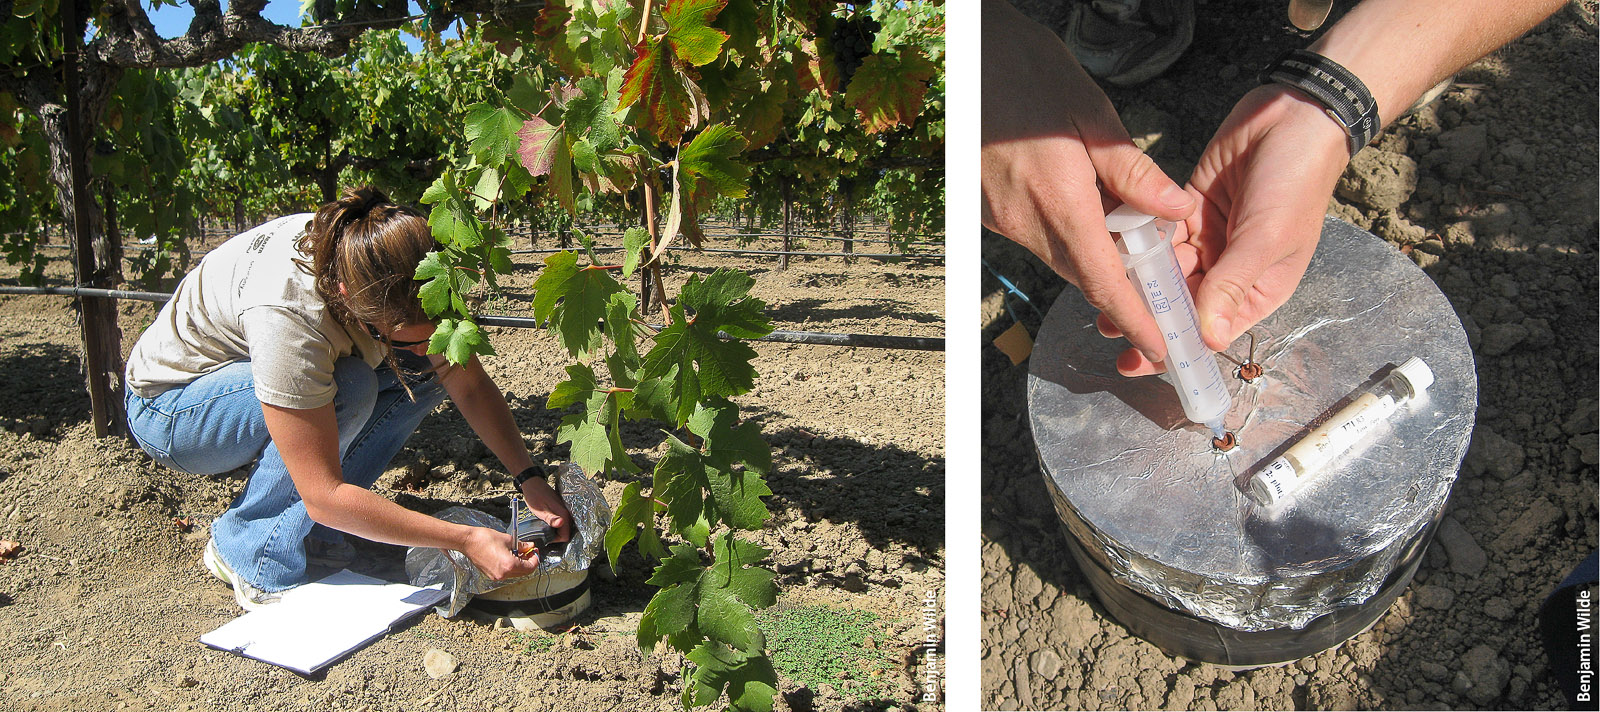
Author Gina Garland (left) records chamber temperatures and (right) takes chamber gas samples in a vineyard.
Irrigation
A total of six irrigation practices are represented in our data set: furrow, flood, overhead sprinkler, microjet sprinkler, surface drip and subsurface drip. In all of the microjet sprinkler and drip irrigation systems, fertilizer was applied through the drip system. For the remainder of the systems, fertilizer N was banded, dissolved in flood water, or spread as compost or residue (table 1). Irrigation with microjet or drip irrigation may improve water use efficiency by applying small amounts of water to match daily soil/crop evaporation. However, effects can be crop dependent (Bryla et al., 2003; Sharmasarkar et al. 2001).
In almonds, Alsina et al. (2013) observed a significant reduction in N2O emissions in a microjet-versus drip-irrigated system. However, emissions across all almond studies were low compared to other crops. Kennedy, Suddick and Six (2013) reported significant reductions for buried drip irrigation versus furrow irrigation in tomatoes, namely due to increased fertilizer and water use efficiency with fertigation techniques via the drip. While we do not have sufficient coverage across crops and irrigation systems to draw broad conclusions, irrigation techniques that allow for dosing of N and water to match daily crop requirements appear to reduce N2O emissions.
Fertilization
It has been well established that N2O emissions increase with increasing fertilizer N application (Cole et al. 1997). However, a nonlinear relationship has often been observed, and emissions increase most rapidly when N rate exceeds crop demand (McSwiney and Robertson 2005; Van Groenigen et al. 2010). The challenge remains of better predicting the extent and timing of crop N uptake and finding a balance of reduced N input without sacrificing yield, thereby mitigating N pollution losses, including N2O. However, reduced N input may not be necessary in micro-irrigation systems that dose N and water inputs and generally have higher yields. Fertilizer form and placement also influence emissions. Fertilizers that lead to increased soil pH and/or highly concentrate N application, such as drip versus microjet irrigation or knife injection versus banding of ammonium or urea, have been found to increase emissions. Zhu-Barker et al. (2015) found that injection of anhydrous ammonium increased seasonal N2O emissions by 44% compared to application of banded ammonium sulfate. We found that fertilization with organic and synthetic N both resulted in N2O emission pulses. During fertigation, emissions pulses were immediate but typically short lived, lasting between one and two days (fig. 4) and only measurable in the tree or vine row. In contrast, organic inputs from cover crops typically caused the highest fluxes at subsequent rain or irrigation events.
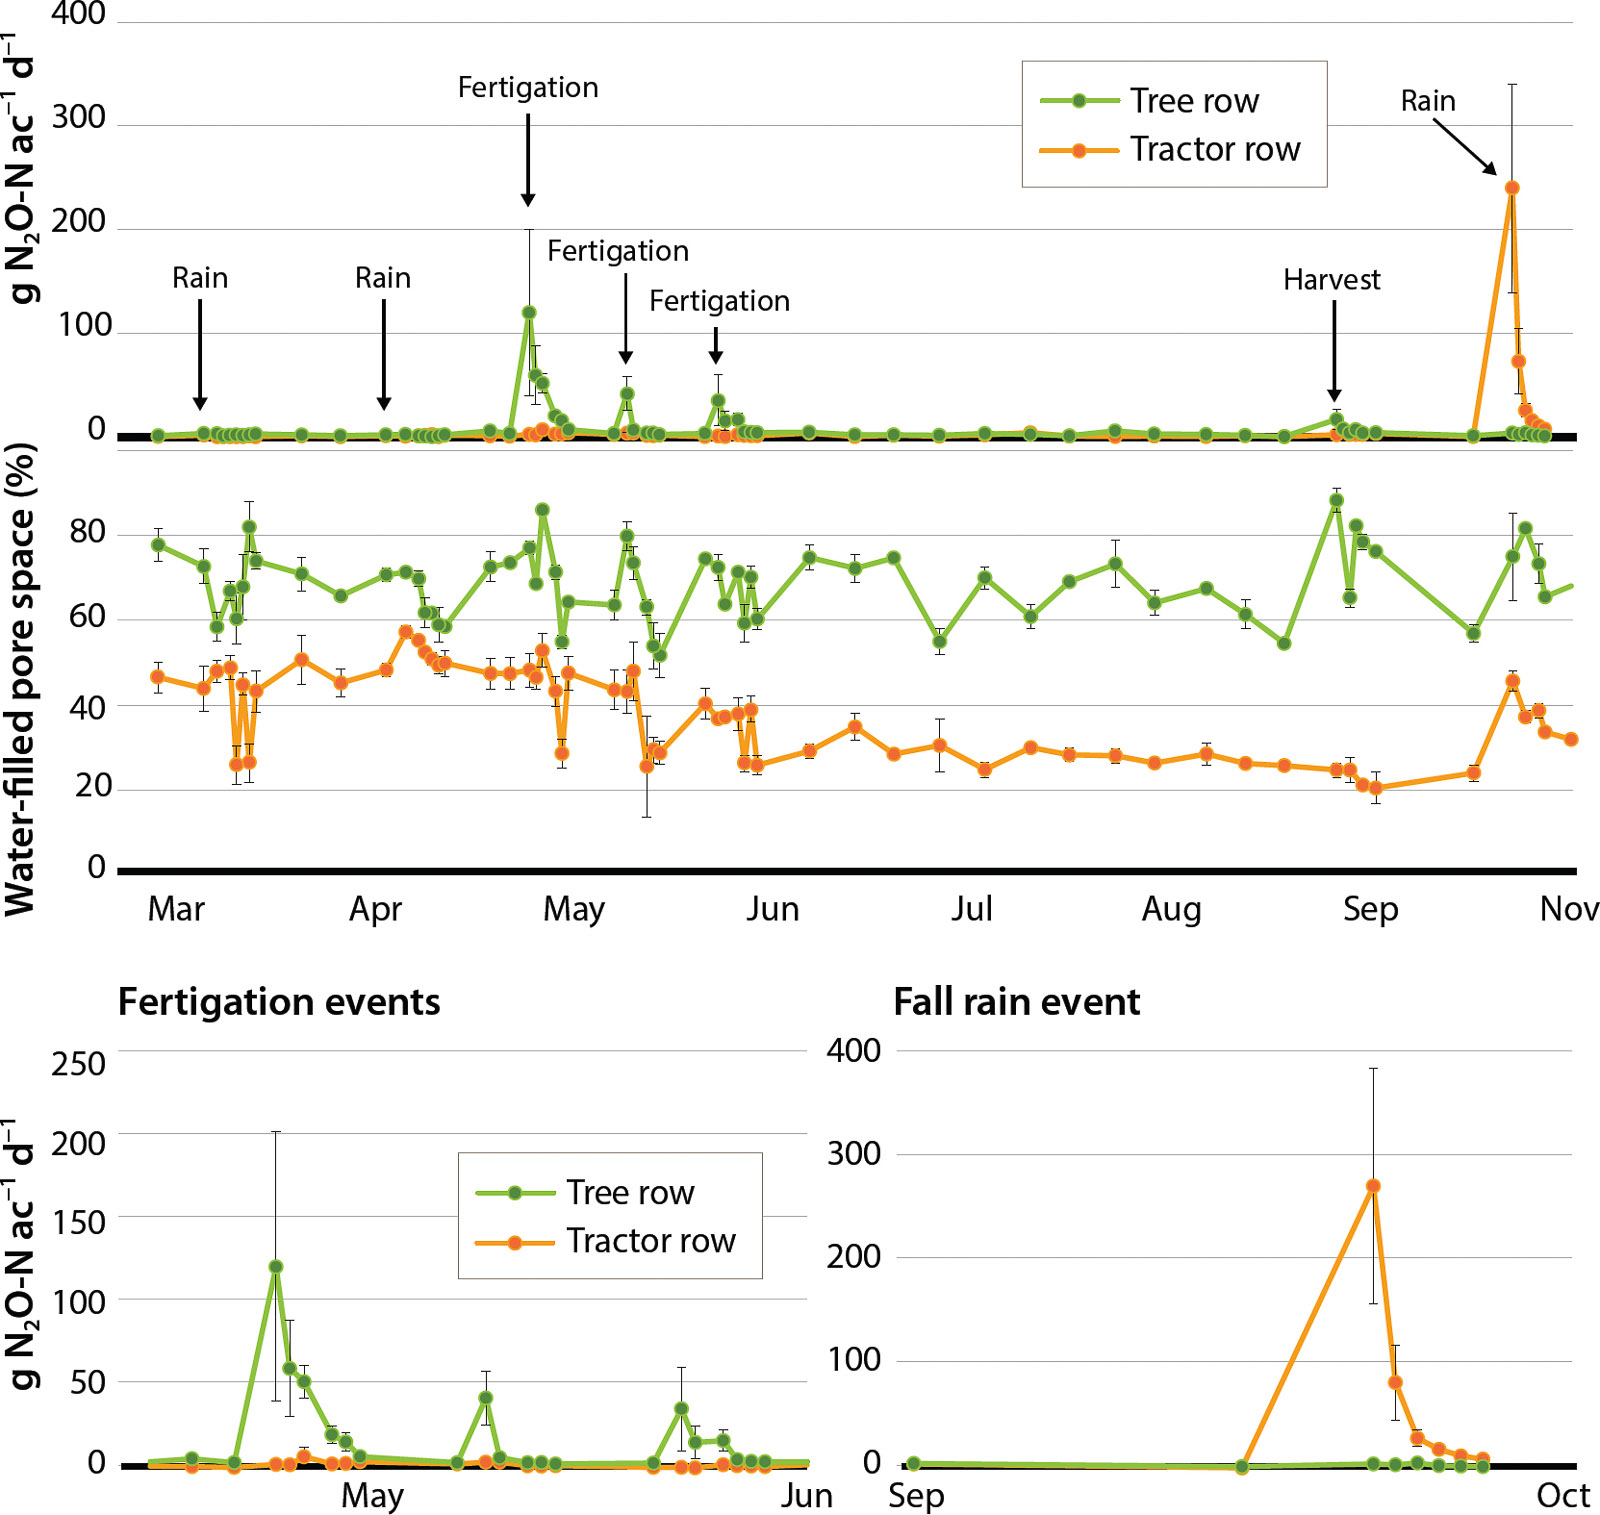
Fig. 4. Examples of temporal and spatial dynamics of N2O emissions from a prune orchard, illustrating the effects of fertigation and precipitation events. Tree row = green dots, tractor row = orange dots.
Tillage
Reduced- and no-till systems can alter N2O emissions by modifying N and C availability, soil structure, microbial community structure and activity and, most profoundly, soil moisture. In dry climates, such as California, van Kessel et al. (2013) found that no-till and reduced tillage increased N2O emissions during the first 10 years after switching from conventional tillage, but decreased emissions once the practice was in place for longer than 10 years. In our data set, only one study examined the role of tillage and found no effect of tillage on growing season emissions in a vineyard (Garland et al. 2011) (table 1). However, this was a short-term study where emissions were only measured during one growing season and after one year of no-tillage. A tillage effect may not have manifested in this short period; or it may have been most evident in the nonmeasured fallow season, when vineyard emissions can be quite high.
Cover crop and residue management
The addition of organic matter from cover crop and crop residues adds C and N to a system that can positively impact soil structure and fertility but also serve as substrates for microbial processes, including the production of N2O. For example, Garland et al. (2014) observed N2O emissions of 3.5 pounds N2O-N per acre per year in a year when a cover crop was planted that supplied 42 pounds N per acre, while only 0.56 pounds N2O-N per acre per year were emitted in the subsequent year when no cover crop was planted (table 1). At the walnut site, annual cover crop N inputs were estimated to be 50 and 92 pounds N per acre, for the tree row and tractor row, respectively. Yet, despite this difference in inputs, N2O emissions in year one were similar for each location, 1.0 and 1.15 pounds N2O-N per acre per year for the tree and tractor row, respectively. However, in year two, with the same cover crop N inputs, emissions were significantly higher in the tractor row, 1.05 and 2.15 pounds N2O-N per acre for the tree and tractor row, respectively. The difference in functional location emissions between years may have resulted from an interaction between cover crop mowing and precipitation or irrigation timing, biennial distribution of feather meal N (110 pounds N per acre was applied in the second year only), or an interaction between the cover crop and feather meal that resulted in a stimulation of N turnover and emissions by either the cover crop or feather meal. Such results demonstrate the complexity of predicting emissions from residue N sources, in part because they may be more strongly affected by environmental variables than inorganic N sources.
We observed that peak N2O emissions did not occur immediately after cover crop mowing, but typically after subsequent irrigation or precipitation events. For instance, in the prune orchard where a mix of grasses were kept mowed over the summer, emissions rose by a factor of 22, from 2 to 4 grams per acre per day to over 100 grams per acre per day following the first rain event in the fall (fig. 4); at the walnut site, a significant increase in emissions was observed when cover crop mowing was shortly followed by irrigation, rising from approximately 2 grams per acre per day to 20 grams per acre per day, while an analogous emission pulse was not observed when mowing and irrigation did not coincide. In tomato systems, Kennedy, Suddick and Six (2013) observed emissions to increase from baseline levels of 0 to 5 grams per acre per day to more than 100 grams per acre per day when crop residues were chopped and mulched at harvest, particularly in a drip-irrigated system. Equivalent or higher emissions were observed 6 weeks later during the first major fall rain event. In this case, emissions were highest in the furrow-irrigated system. Relatively large quantities of N-rich crop residue from annual vegetable systems may be particularly prone to such emissions; further research should investigate the timing of crop residue incorporation in relation to rainfall.
Rafaela Conz, visiting scholar, taking chamber gas samples during gas flux measurements in a walnut orchard.
Annual and between-study variability was higher in wine grape systems than other cropping systems (fig. 3, table 1) and could be attributed to heterogeneous placement, timing and decomposition of cover crop residues, all of which can affect N2O emissions. For example, Garland et al. (2014) observed seven-fold greater emissions in year one when a cover crop was grown compared to year two when the tractor rows were left fallow. Emissions derived from the cover crop were strongly influenced by precipitation in each wine grape study; for example, Verhoeven and Six (2014) reported that fall rain events in the tractor row accounted for approximately 10% of annual emissions.
Although transitory peak emissions associated with cover crop residue input may be high, cumulative emissions from these systems were low compared to the dairy systems considered in this study, but tended to be higher than tree cropping systems without explicit cover crops (i.e., almond and prune, fig. 3). Cumulative emissions were also lower than those found by Adviento-Borbe et al. (2007) for maize-soybean rotations (3.5 to 8.25 pounds per acre per year). Furthermore, emissions in all systems should be put in perspective to those of natural systems; native grasslands or forests also regularly emit N2O in the normal course of organic matter decomposition, mineralization and N cycling and have mean emissions ranging from 0.37 to 0.83 pounds per acre for temperate systems (Kim et al. 2013; Stehfest and Bouwman 2006).
In sum, we do not want to discourage the use of cover crops, but rather to optimize their management. Increases in soil C from crop residue can provide myriad benefits (such as improved soil structure and increases in water retention and microbial abundance), particularly in C-poor California soils. Further research is needed on the effect of specific cover crop management practices on N2O emissions (i.e., frequency of cuts, species, incorporation versus mulching). The timing of such practices in relation to irrigation and precipitation events is critical to N2O emissions and the extent to which these can be offset while maintaining nutrient and water availability must be investigated.
Manure application
Large quantities of liquid and solid manure are produced in intensive dairy production and are typically applied locally in the production of forage crops. Because manure availability and N content cannot always be predicted, growers may also apply synthetic N. A recent study by Lazcano et al. (2016) reported N application rates and annual N2O emissions to be nearly an order of magnitude higher than the other observations in our study (613 to 939 pounds N per acre and 5.46 to 12.42 pounds N2O per acre, respectively). Despite the high productivity and relatively high nitrogen uptake efficiency of these systems, N application frequently exceeded crop demand and could be better optimized to reduce emissions. Improved manure storage and transport schemes could allow growers more flexibility in application timing and location, thereby reducing the need for synthetic N addition and enabling the application of manure at rates and times that better match crop N demand.
Climatic effects on N2O emissions
Across systems, cumulative emissions were dominated by discrete events, namely by rain events in the fallow season and fertilization or fertigation events during the growing season. Fall rain events caused high emissions in both perennial systems (tractor row) and annual systems (all functional locations) and could be linked with a buildup of N and C from decomposing cover crop or crop residue. Rain-induced N2O emission pulses are typical of many soils, such as California grasslands, as they become wetted during the onset of the rainy season (Herman et al. 2003). Across the 16 studies, increases in emissions up to ten-fold relative to background emissions were found following rain and fertigation events, with emission spikes reaching over 150-fold increases in some instances (fig. 4). Such dramatic increases were typically observed for only one or two days following an event, generally tapering off to background levels within a week.
The seasonal distribution of emissions was relatively consistent within a given crop (fig. 2), but with significant variation between crops. Fallow season emissions were 64%, 32% and 54% for the wine grape, almond and rice systems, respectively. Fallow season emissions, often including the first rain event, ranged from 7% to 97% of annual emissions for individual observations, demonstrating that, regardless of the system, they were significantly contributing to annual emissions, but again varied significantly with crop and year. Among dairy systems, Lazcano et al. (2016) generally found low emissions during the winter crop (forage mix, ryegrass or wheat) but observed that these emissions could be strongly affected by residue and fallow management of the preceding crop.
Emission factors
Emission factors represent the amount of N2O-N emitted over a year relative to the amount of external N added to a system (synthetic N + organic N + crop residue N) and can provide a useful metric for comparing systems.
Many studies do not include crop residue N inputs because an accurate estimate of residue N and subsequent mineralization to available N is difficult to obtain. Rather, the influence of crop residue N is often accounted for through the comparison of crops or management practices.
Emission factors from measured surface fluxes are routinely calculated as either corrected or uncorrected for background fluxes (Garland et al. 2014; Rashti et al. 2015; Scheer et al. 2012). For background corrected fluxes, emissions from a zero added N plot are subtracted from fertilized emissions and the resulting net emissions are referred to as fertilizer-induced emissions (EFfertilizer). Such an approach allows one to differentiate between the effects of fertilizer management versus other management.
Background emissions were measured in three of the studies included here and ranged from 0.21 to 0.76 pounds N2O-N per acre, representing 18% to 68% of emissions in the fertilized plots (Adviento-Borbe et al. 2013; Pittelkow et al. 2013; Zhu-Barker et al. 2015). This variability in the relative contribution of background emissions shows that other management practices (such as irrigation and tillage), weather and residual N (from previous crops or N application) concentrations likely influenced gross emissions as well. In systems where N is applied locally by fertigation or at the tree base, emissions may be better estimated by improved spatial coverage and spatially weighted averages (Alsina et al. 2013; Decock et al. 2017; Garland 2011; Garland et al. 2014; Pereira et al. 2016; Schellenberg et al. 2012; Verhoeven and Six 2014).
Considering these factors and that a zero N treatment was not available for many of these on-farm trials, we calculated EFs uncorrected for background fluxes. It could be argued that EFs uncorrected for background fluxes, as we have reported, may be overestimates. Thus, the discrepancy in calculation schemes should be kept in mind. However, as stated above, we believe that in many of the systems measured, management practices beyond the quantity of fertilizer added were likely a stronger determinant of emissions.
Among all studies, EFs ranged from 0.2% to 10.4% (table 1), thus falling below and well above the IPCC default EFs of 1.0% (with a range of uncertainty from 0.3% to 3.0%). Default EFs have been derived from regressing N application versus N2O emissions for many studies at a global level (IPCC 2007). When such a plot is constructed for our data set, a trend of increased emissions with increased N rate is only evident across crops but not within (fig. 5). Therefore, straightforward EFs may be misleading if emissions are more reflective of a system's N surplus than total N applied (Van Groenigen et al. 2010) and/or driven by other factors such as irrigation or crop residue management.
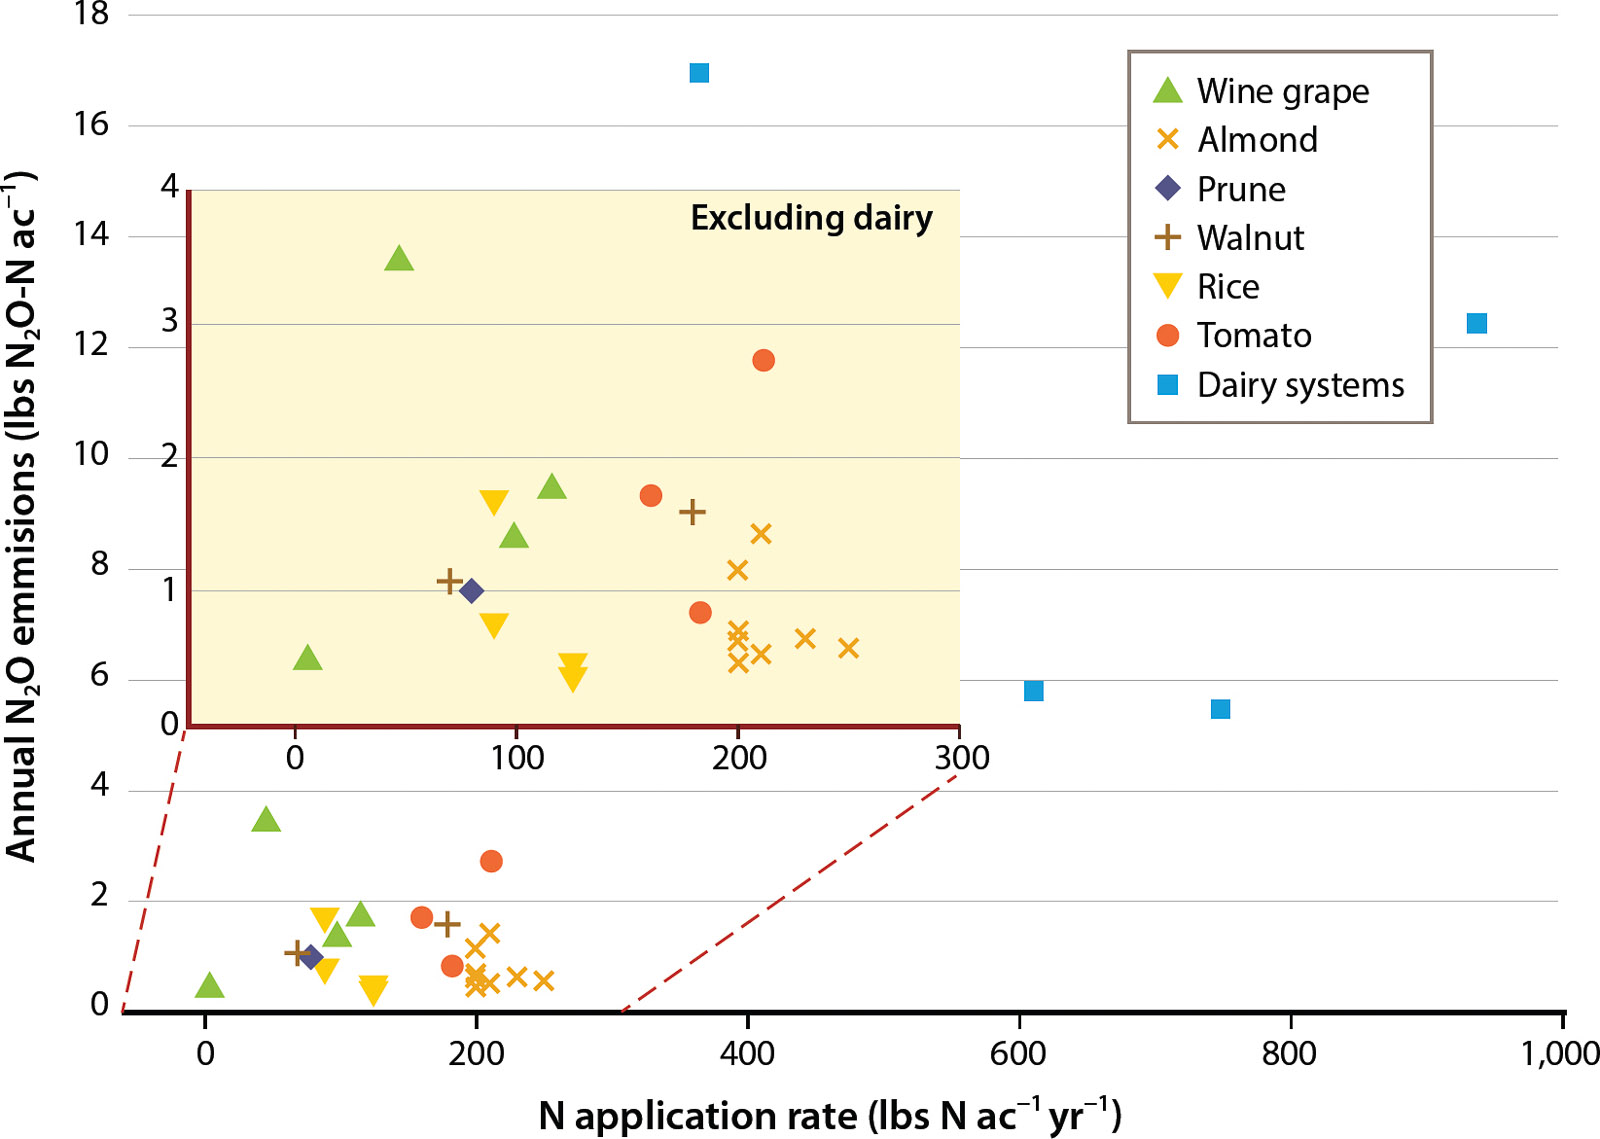
Fig. 5. Annual nitrogen application rate versus annual N2O emissions by crop type. Dairy systems were defined by the production of forage or pasture with high manure N inputs; they include sites with pasture ryegrass, corn + forage mix, corn + winter wheat, corn + ryegrass.
Emission factors were especially variable in the vineyard systems, ranging from 1.5% to 10.4%. This variability is attributable to high spatial and inter-annual variability, and highlights the difficulty in calculating EFs from cover crop or organic N inputs. For example, in the study by Garland et al. (2014), the cover crop was grown as part of a multi-year rotation; thus, if the “N-applied” were spread over a 2-year period, inter-annual variability would decrease. It is also difficult to account for the provision of belowground N through biological N-fixation, which can be substantial from leguminous cover crops. In a meta-analysis, Basche et al. (2014) found that cover crops increased N2O emissions 60% of the time and emissions also increased with cover crop incorporation and leguminous species. Yet for all practices, the net effect neared zero when emissions were measured for at least a full year, indicating that on an annual and perhaps multi-annual scale the use of cover crops may be near neutral. Even though wine grapes have a high EF, the amount of N added to these systems is small compared to other crop systems, and therefore overall emissions in wine grapes are low compared to other crops. For these reasons, it must be stressed that the EFs we calculated are crop and system specific.
Low emissions and higher fertilization rates (200 to 240 pounds N2O-N per acre) in the almond systems resulted in low EFs of 0.3% with a covariance of 51% (table 1).
In dairy systems, despite mean N2O emissions nearly nine times higher than in other systems, the EF was 1.6% on average, nearly identical to the mean among all systems (1.5%). The high emissions but near-average EFs for dairy systems arise because nearly nine times the amount of N was also added in the dairy systems, indicating that N in these systems was either taken up with reasonable efficiency or lost through other pathways, such as NO3− leaching or NH3 volatilization.
Emission factors in rice were also quite low, less than 1.0% for three of the four observations (Adviento-Borbe et al. 2013; Pittelkow et al. 2013).
These results clearly indicate the need for region- and crop-specific EFs for California agriculture. A starting point for improved EFs may be the EF inference scheme proposed by Lesschen et al. (2011). This scheme utilizes EFs that have been specified for a number of common practices and environmental variables such as source of N input, precipitation, soil type and land use. The scheme was developed for a European context; adaptation to California conditions would encompass EFs specific to practices here, such as those for irrigation strategy, cover crops and residue management.
Future research needs
While our data set includes emission data for some of California's top grossing crops (almonds, grapes, walnuts, tomatoes), notable gaps are in berry, hay and lettuce systems, which rank sixth, seventh and eighth, respectively, in statewide revenue. Almonds, grapes, walnuts and tomatoes are together produced on 1.9 million acres. Additionally, the geographical distribution of our data set was limited. Only two studies were conducted in one of the top ten California agricultural counties, Schellenberg et al. (2012) (Kern County) and Lazcano et al. (2016) (San Joaquin County). With the exception of rice, the crops studied were not evaluated in their largest areas of production. Developing accurate field emissions estimates is time-consuming and labor-intensive; hence, the majority of our studies have been conducted in field sites near UC Davis, where most of the authors are based. Emissions in other regions of California may differ substantially with variations in dominant soil types and climate. In general, N2O emissions are often lower in dry climates compared to wetter ones (IPCC 2007). In particular, more work needs to be done in major agricultural areas with drier and warmer conditions (Fresno, Tulare and Kern counties) and also in wetter, coastal regions (Monterey County).
Among the studies reviewed here, many factors beyond crop type also varied, often significantly. Thereby our ability to identify the impact of any one factor such as irrigation management, soil type, fertilizer form and local weather conditions was limited. While difficult to coordinate, future work would benefit from a meta-structure that allowed for pair-wise comparisons of agronomic management effects within and between systems that are characterized by different crop rotations and environmental conditions.
N2O emissions are only one metric of a system's sustainability and environmental impact. Current research is highlighting the balance between agronomic performance and environmental impact by reporting emissions on a yield-scaled basis. For example, work reported here in rice systems (Adviento-Borbe et al. 2013; Pittelkow et al. 2013) and almonds (Schellenberg et al. 2012) all reported yield-scaled EFs. Nitrogen in a system that is in excess of crop demand is also highly susceptible to leaching losses. The leaching of excess NO3− into groundwater and terrestrial and oceanic water bodies is a risk to human health and aquatic biodiversity and function (Galloway et al. 2008; Rosenstock et al. 2013). Similarly, indirect N2O emissions can occur when N2O becomes dissolved in water, leached out of the system and later emitted.
Eventually, we need to strive for a more holistic evaluation of agricultural systems, addressing ecological, economic and social aspects of sustainability. It is unlikely that one strategy will work across all regions and crops; however, judicious and synchronized application of water and N, timed with crop demand, is predicted to reduce emissions across climate zones and crops. Such practices will also help increase water and N use efficiency, thereby helping to conserve resources and reduce unnecessary losses. Nevertheless, such careful timing of water and N application is difficult to predict and can be costly to deploy. Policies should promote and aid the adoption of improved fertilizer application, irrigation practices and cover crop management. In conjunction, research should prioritize the refinement of region-specific EFs for irrigation strategy, cover crops and residue management.
N2O emissions from California farmlands: A review

