


All Issues
Wood chip denitrification bioreactors can reduce nitrate in tile drainage
Publication Information
California Agriculture 71(1):41-47. https://doi.org/10.3733/ca.2017a0007
Published online February 09, 2017
NALT Keywords
Abstract
Widespread contamination of surface water with nitrate-nitrogen (NO3-N) has led to increasing regulatory pressure to minimize NO3-N release from agricultural operations. We evaluated the use of wood chip denitrification bioreactors to remove NO3-N from tile drain effluent on two vegetable farms in Monterey County. Across several years of operation, denitrification in the bioreactors reduced NO3-N concentration by an average of 8 to 10 milligrams per liter (mg L-1) per day during the summer and approximately 5 mg L-1 per day in winter. However, due to the high NO3-N concentration in the tile drainage (60 to 190 mg L-1), water discharged from the bioreactors still contained NO3-N far above the regulatory target of < 10 mg L-1. Carbon enrichment (applying soluble carbon to stimulate denitrifying bacteria) using methanol as the carbon source substantially increased denitrification, both in laboratory experiments and in the on-farm bioreactors. Using a carbon enrichment system in which methanol was proportionally injected based on tile drainage NO3-N concentration allowed nearly complete NO3-N removal with minimal adverse environmental effects.
Full text
Release of nitrogen (N) from agricultural fields, primarily in nitrate (NO3−) form, is a significant surface water quality concern across the United States. This problem is particularly acute in the Salinas and Pajaro Valleys of central coastal California. Vegetable crops such as lettuce and broccoli dominate production, representing approximately 80% of the irrigated acreage, with fields typically producing two or three crops per year. High crop value and exacting market standards for product size and color provide incentives for heavy fertilization.
Given the sensitivity of these crops to water stress and soil salinity, irrigation is applied frequently, often with a substantial leaching fraction to minimize salt buildup. The production intensity and widespread use of tile drain systems to improve farm productivity have contributed to significant NO3-N impairment of surface water in this region. Los Huertos et al. (2001) reported that drainage ditches receiving discharge from tile drain systems commonly had NO3-N concentrations exceeding 70 mg L−1.

Using carbon enrichment in wood chip bioreactors can reduce nitrate-nitrogen levels in drainage water from Salinas Valley vegetable fields. In this photo, tile drain water is pumped from a collection sump into a surface ditch that eventually drains into coastal wetlands.
U.S. Environmental Protection Agency nutrient total maximum daily load (TMDL) regulatory processes are underway to limit NO3-N loading in both the Salinas and Pajaro River watersheds. The TMDL surface water NO3-N target concentration in the lower Salinas River Basin ranges from the federal drinking water standard of 10 mg L−1 down to 1.4 mg L−1, depending on location and season.
Extensive research has been conducted on fertilizer and irrigation management in the area's vegetable production system, and the potential for significant improvement has been documented (Bottoms et al. 2012; Breschini and Hartz 2002a, 2002b). While more efficient fertilizer and irrigation management could substantially reduce the NO3-N concentration of tile drainage, it is unlikely that environmental target concentrations could be consistently achieved through crop management practices alone. Some remedial treatment of tile drainage would undoubtedly be required.
Denitrification
In both terrestrial and aquatic ecosystems, a process called heterotrophic denitrification, a microbial process, converts NO3-N to gaseous forms of N using a carbon (C) source as an electron donor and to support microbial growth (Coyne 2008). The conversion is performed by specialized bacteria under anaerobic conditions.
The possibilities of managing denitrification through the use of denitrification bioreactors have been widely studied. Bioreactors are chambers filled with carbon-rich media through which water containing NO3-N is cycled for treatment. Bioreactors have been evaluated for remediating different types of agricultural wastewater, including tile drainage, surface runoff and greenhouse effluent (Blowes et al. 1994; Robertson et al. 2009; Robertson and Merkley 2009; Schipper, Cameron et al. 2010).
Denitrification rates achieved in bioreactors range widely (Schipper, Robertson et al. 2010). The main factors governing denitrification rates are the type of media used and the water temperature. Many types of media have been evaluated, including cardboard, straw, corncobs and green waste. However, field-scale installations have typically used wood chips; wood chips are widely available, relatively low in cost, have stable hydraulic characteristics and are long-lasting (Schipper, Robertson et al. 2010). Their main drawback is low C availability, which can limit the denitrification rate (Cameron and Schipper 2010; Warneke et al. 2011). As is the case with most biological processes, increasing water temperature increases the rate of denitrification (Schipper, Robertson et al. 2010).
Wood chip bioreactors can have potentially detrimental environmental effects, which must be weighed against the positive effect of reducing NO3-N. The release of dissolved organic carbon (DOC) and tannins during bioreactor start-up may be similar to the release from sawmills, where control measures are required (Schipper, Robertson et al. 2010). Incomplete denitrification can result in significant release of nitrous oxide (N2O), a potent greenhouse gas. Both gaseous N2O emission and dissolved N2O release in bioreactor effluent can be significant (Moorman et al. 2010; Warneke et al. 2010).
In coastal California, tile drain systems may operate year-round. Tile drainage volume and NO3-N concentration can vary widely over time, which presents a challenge to consistently effective remediation. Adjusting hydraulic residence time (HRT), the time the drainage stays in the bioreactor, is the primary tool for dealing with varying nitrate loads, but a bioreactor built to handle the average load will be either over- or underdesigned as the N load varies. An alternative technique is to add a soluble C source during times of high N loading, to augment the microbial-available C in the wood chips and increase the denitrification rate.
Carbon enrichment is commonly used in municipal wastewater treatment to stimulate denitrification. To date there have been no reports on the efficacy of C enrichment to improve the performance of wood chip bioreactors. Our research goals were to evaluate the performance of wood chip denitrification bioreactors in remediating high-nitrate tile drainage from Salinas Valley vegetable fields and to assess the potential of C enrichment to improve bioreactor performance.
Field bioreactors
Two pilot-scale denitrification bioreactors were constructed on tile-drained farms in northern Monterey County in spring 2011. Pits were dug, lined with polyethylene sheeting and filled with wood chips. The chips, which were obtained from the Monterey Regional Waste Management District, were made from untreated scrap construction wood.
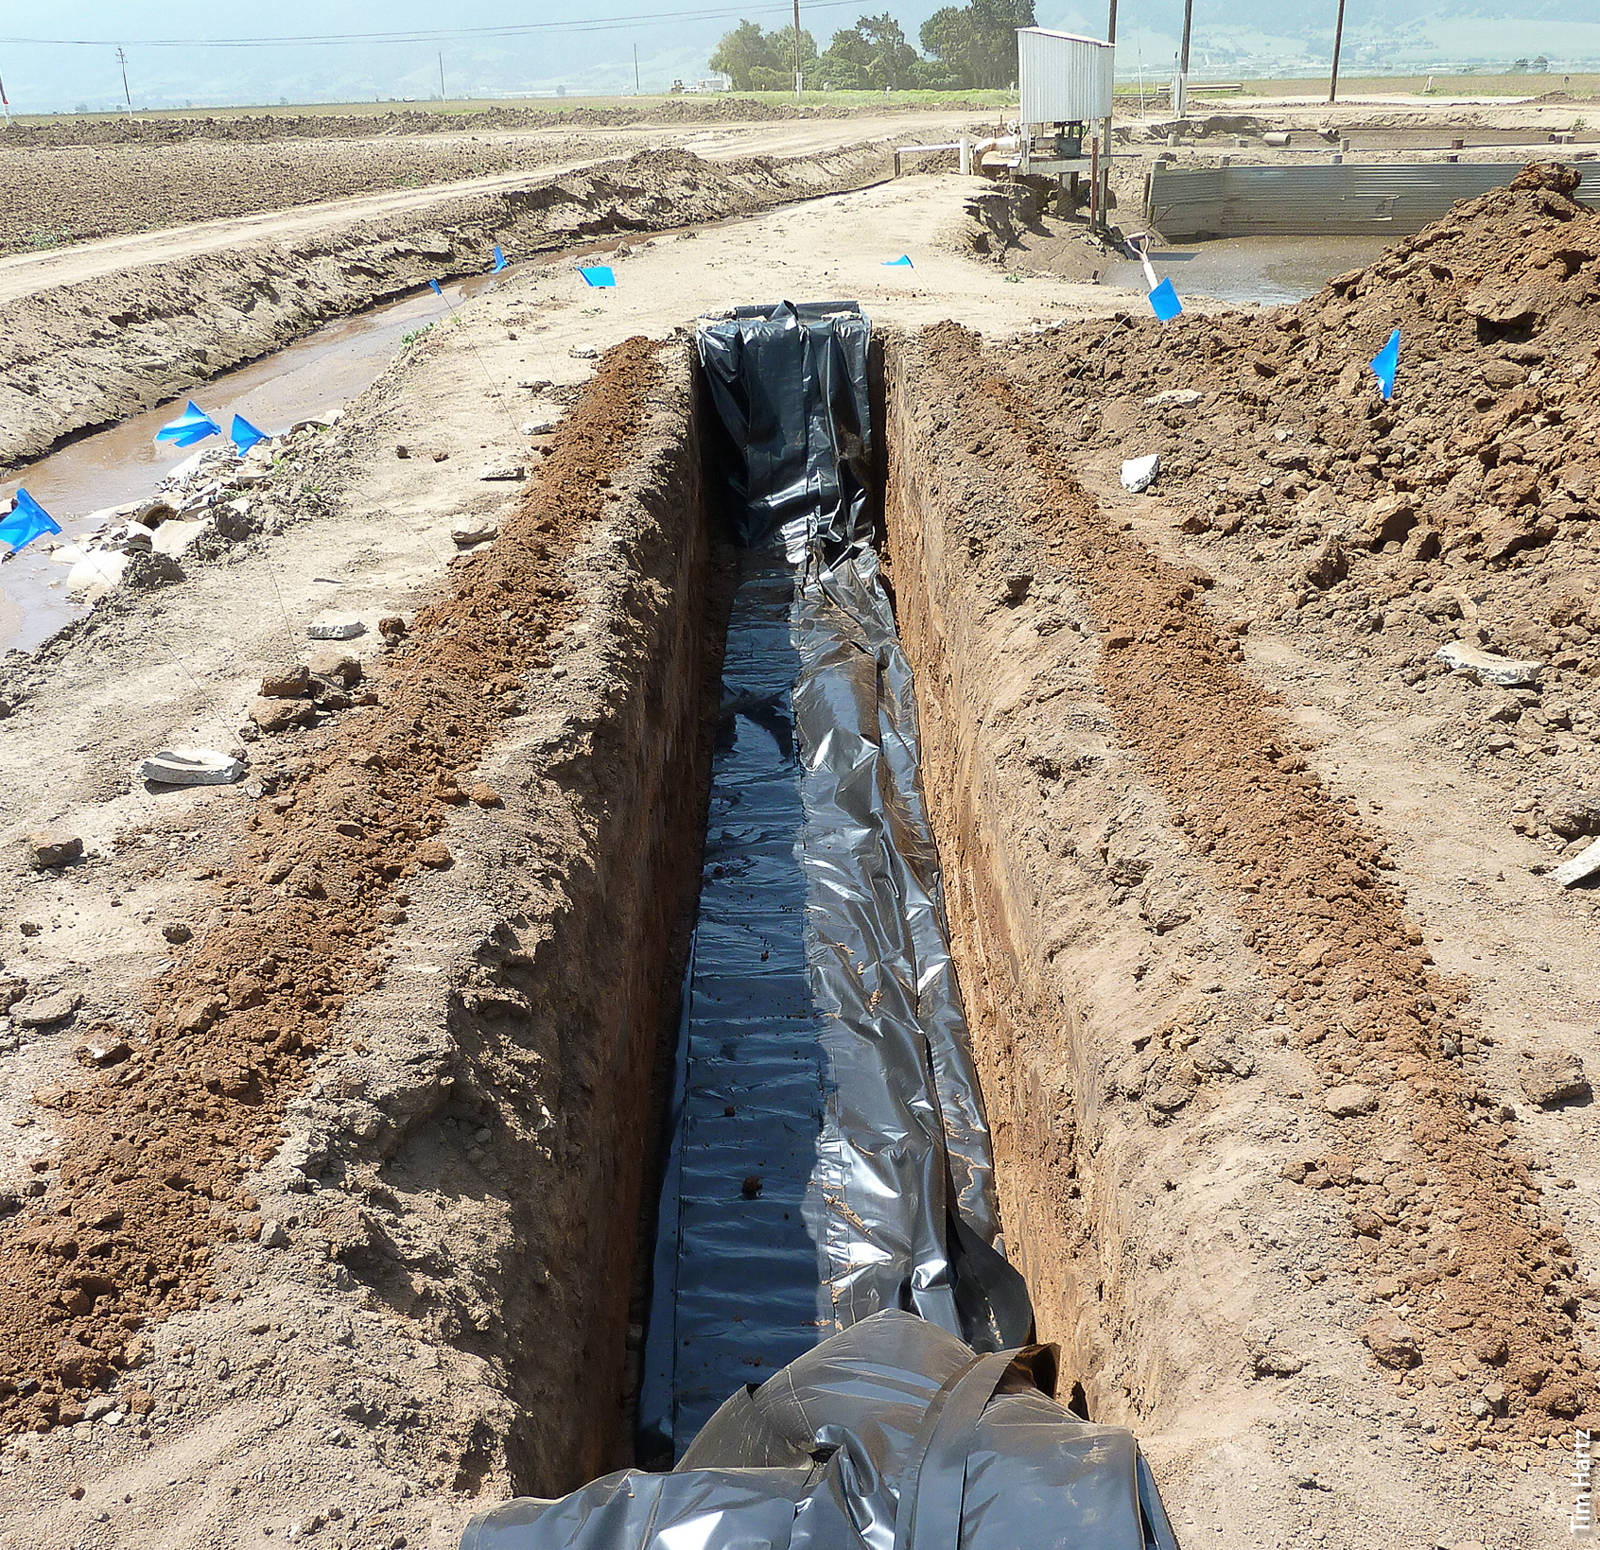
The denitrification bioreactor was dug with a backhoe and fitted with a polyethylene liner.
The bioreactor at site 1 was 45 feet long, 5.4 feet wide and 3.8 feet deep (13.7 by 1.6 by 1.2 meters); the bioreactor at site 2 was 33 feet long, 3 feet wide and 4.5 feet deep (10.1 by 0.9 by 1.4 meters). The water-holding capacity was approximately 6 gallons per cubic foot of volume, or about 5,500 and 2,600 gallons (20.8 and 9.8 cubic meters) at sites 1 and 2, respectively. Approximately 70% of that water was free-draining, meaning 30% was absorbed by the chips. The bioreactors were not covered by tarps or soil.
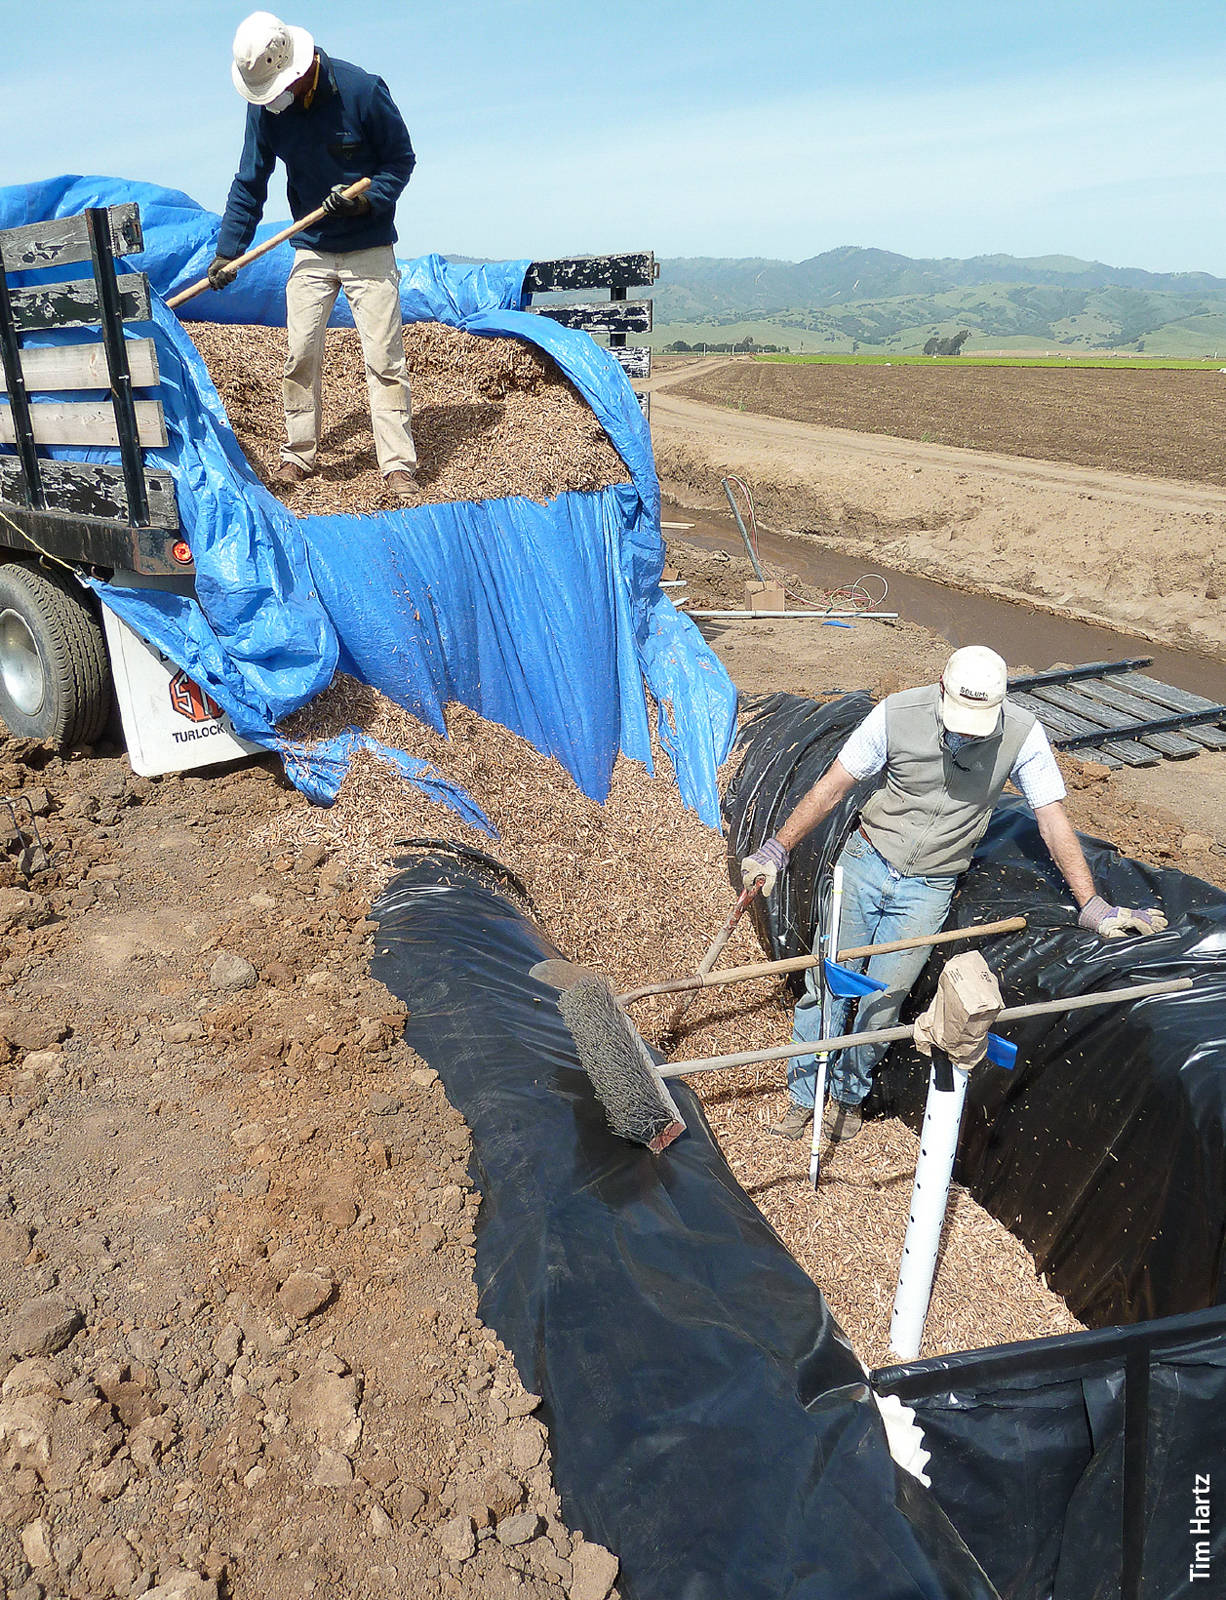
Denitrification bioreactor being filled with wood chips.
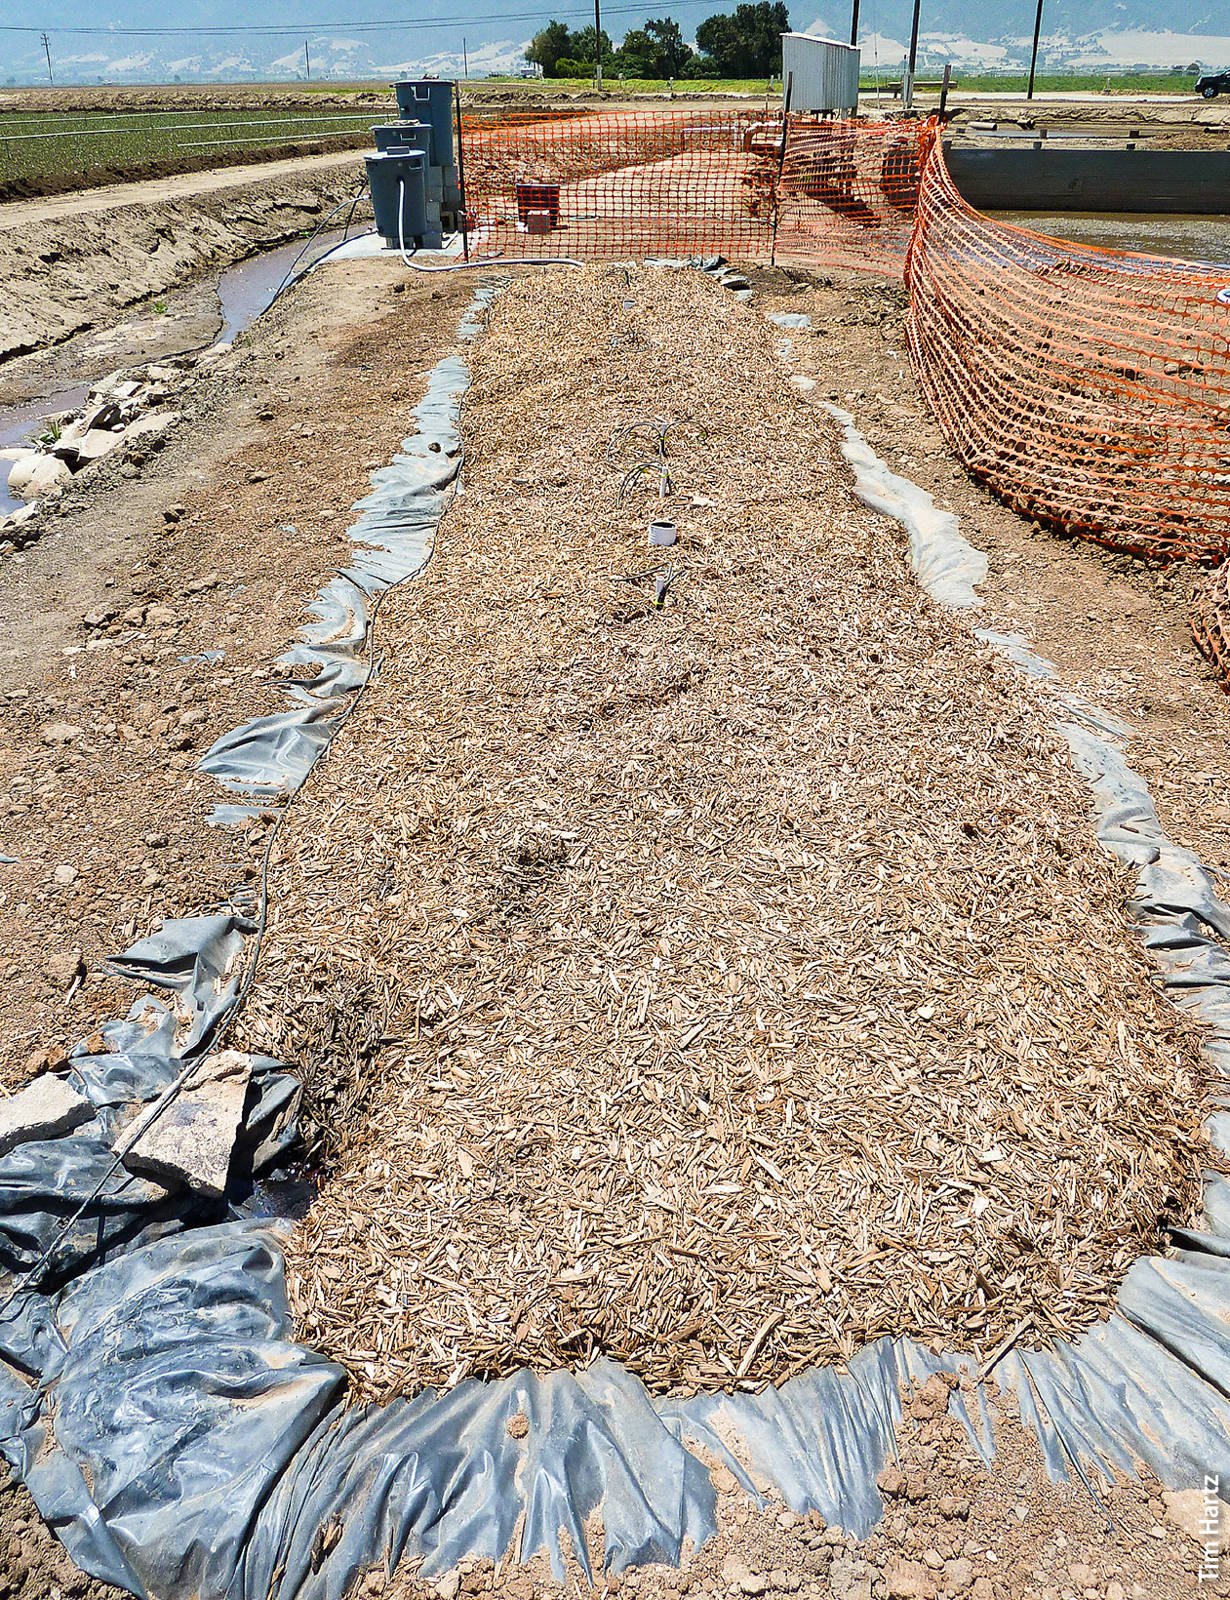
Completed denitrification bioreactor.
Drainage water from the farms' tile drain systems was pumped from collection sumps into the bioreactors at a constant flow rate to achieve approximately 2 days of HRT, based on total water volume. The HRT of free-draining water was undoubtedly less than 2 days, since the water absorbed by the chips was not exchanging as quickly. The water volume entering each bioreactor was recorded using a flowmeter. Water temperature was continuously monitored by thermistors placed in the middle of each bioreactor and 2 feet from the bottom. The water drained by gravity from the bioreactor outlet into surface ditches draining the farms.
The bioreactors were operated without carbon enrichment from their construction in 2011 until fall 2013. Inlet and outlet flows were sampled an average of 2 or 3 times per week during the crop production season (March to October) and once per week during the winter. NO3-N was determined on all samples, with nitritenitrogen (NO2-N, a denitrification intermediate) and DOC analyzed periodically. NO3-N and NO2-N concentrations were determined using the spectrophotometric method of Doane and Horwath (2003). DOC was determined by UV-persulfate oxidation utilizing a Phoenix 8000 analyzer (Teledyne-Tekmar, Mason, OH) after filtration through 0.30-μm glass fiber filters.
Carbon enrichment studies
In 2014, six laboratory-scale bioreactors of approximately 0.5 cubic feet (14 liters) were fabricated using PVC pipe. These bioreactors were filled with aged wood chips collected from the field bioreactors. They were installed on the UC Davis campus in a temperature-controlled room maintained at 62°F (17°C) to simulate the summer temperature of tile drainage in the field bioreactors. Peristaltic pumps continuously supplied NO3-N solution to maintain a 2-day HRT (based on total water volume), also simulating the operation of the field bioreactors.
Two of the bioreactors received only NO3-N solution (no C enrichment), while the others received that same solution augmented by C from either methanol or glycerin (two bioreactors for each C source). These C sources were selected based on their use in the denitrification step of municipal wastewater treatment and the modest cost per unit of C. Evaluation of C enrichment effects on denitrification rate began following a 10-day acclimation period to ensure the development of a bacterial population capable of metabolizing the C source; similarly, when C enrichment levels were changed, there was a 10-day acclimation period before evaluation.
The effect of C enrichment on denitrification was evaluated over the range of 40 to 100 mg L−1 C for methanol and 100 to 150 mg L−1 C for glycerin. Daily samples were collected on 6 to 8 different days for each level of C enrichment, with NO3-N concentration determined as previously described. Carbon enrichment effects were calculated as the reduction in NO3-N concentration beyond that observed in the control (unenriched) bioreactors.
A subsequent laboratory experiment investigated the feasibility of achieving complete denitrification of high-nitrate water using C enrichment. An inlet NO3-N concentration of 160 mg L−1 and an HRT of 2 days were maintained throughout the study to simulate conditions at the site 1 bioreactor. Two levels of C enrichment were evaluated for each C source (120 and 230 mg L−1 C from methanol and 160 and 320 mg L−1 C from glycerin); the higher levels were chosen to be adequate, based on the initial laboratory results, to allow complete denitrification. Each level of C enrichment was evaluated over a 5-week period, with samples collected on 25 days for NO3-N and NO2-N determination.
N2O emission from the laboratory bioreactors was also measured. Measurements were made on 2 days for each combination of C source and concentration. Bioreactors were sealed with an airtight PVC cap, and air was circulated through the headspace of the bioreactors at a constant rate of approximately one air exchange every 2 minutes. After an hour of calibration, four headspace air samples were collected 15 minutes apart via needle and syringe and stored in evacuated glass tubes until analysis by gas chromatography.
Matching samples of outlet water were gathered for determination of dissolved N2O. The water samples were injected into sealed glass tubes containing 2 M NaOH to stop biological activity in the water. After 24 hours of equilibration, to allow dissolved N2O to come to equilibrium with the air in the tube, the headspace in these tubes was resampled and stored in evacuated glass tubes until analysis by gas chromatography.
The effect of C enrichment on the performance of the site 1 bioreactor was evaluated in 2015. Only methanol was evaluated in the field because of its higher efficiency (lower C:N denitrification ratio) than glycerin and our observation that the high viscosity of glycerin complicated its handling and use. Methanol was injected at a constant rate of 140 mg L−1 C from April 22 until May 5 to ensure establishment of bacteria capable of metabolizing methanol. The C injection rate was increased to 270 mg L−1 on May 5 and maintained at that level through June 17. Inlet and outlet samples were collected on 12 days during this period and analyzed for both NO3-N and NO2-N; DOC concentration was determined on 5 of those days.
On July 17, an optical nitrate sensor, an in-situ ultraviolet spectrophotometer (ISUS; Johnson and Coletti 2002), was installed at site 1. This sensor, designed and constructed by scientists at the Monterey Bay Aquarium Research Institute, allowed real-time NO3-N monitoring of the tile drainage. ISUS sensors and the related SUNA (submersible UV nitrate analyzer) sensor have been shown to provide accurate NO3-N determination in a variety of ground and surface waters (Pellerin et al. 2013; Sackmann 2011).
A C enrichment system was developed in which methanol was injected proportionally to the inlet NO3-N concentration at a ratio of approximately 1.4:1 (C:N, on a mass basis), the ratio suggested by the laboratory experiments as being adequate to allow complete denitrification. Inlet NO3-N concentration was determined by the ISUS sensor every 15 minutes, with that value determining the methanol injection rate.
This C enrichment system operated from Aug. 15 through Oct. 6, 2015. Inlet and outlet NO3-N and NO2-N concentrations were determined on samples collected on 14 days during this period, with DOC measured on 6 days. On each of 4 days, four replicate samples of outlet water were collected 15 minutes apart for measurement of dissolved N2O. The water flow rate was increased on Sept. 17 to reduce HRT to 1.7 days; this flow rate was maintained through Oct. 6.
Field bioreactors reduce NO3-N
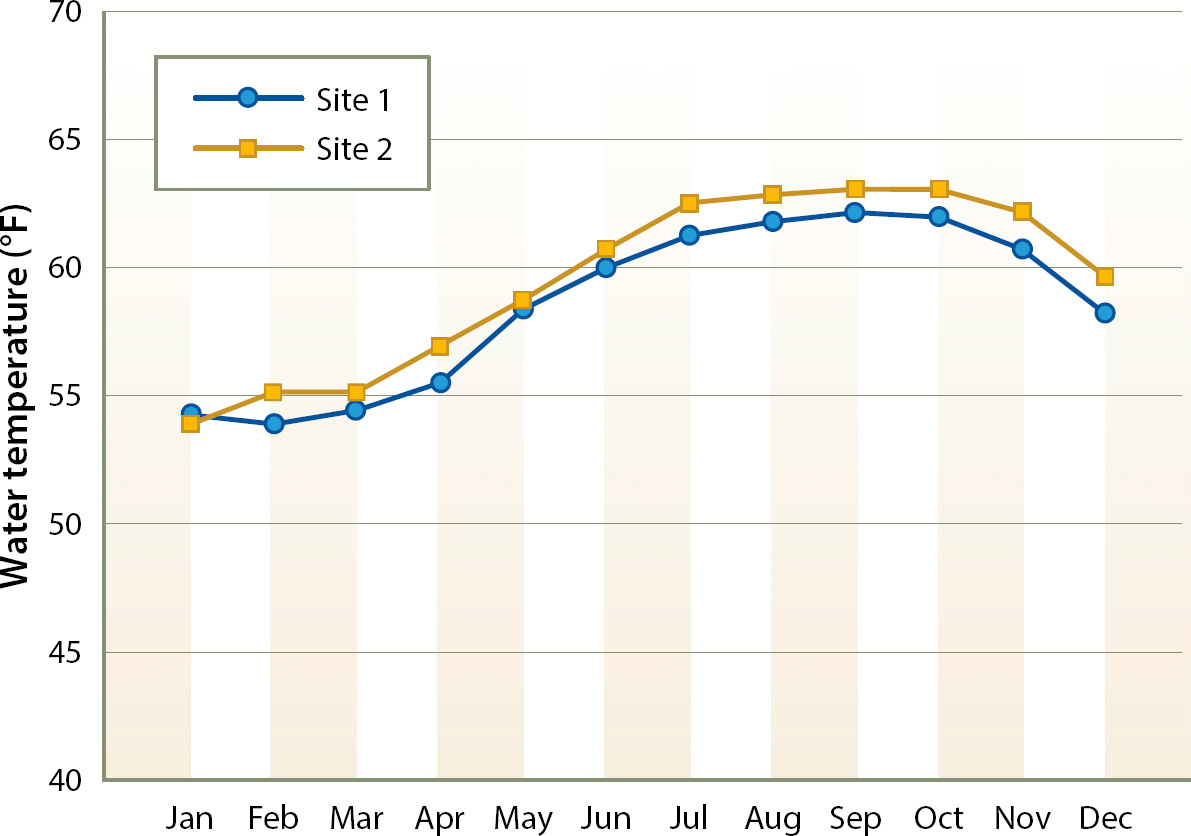
Denitrification began at both sites within days of the initial filling of the bioreactors. Denitrifying bacteria are ubiquitous, and seeding of inoculum was not necessary. Water temperature in the bioreactors averaged approximately 62°F (17°C) during the summer and 55°F (13°C) during the winter (fig. 1); the water temperature pattern was consistent across years.
Inlet water typically ranged between 5 and 10 mg L−1 DOC. A high level of DOC was present initially in bioreactor effluent, but it declined to < 20 mg L−1 after several weeks of operation (fig. 2). After the first summer season of operation, outlet DOC stabilized between 10 and 15 mg L−1. Bioreactor effluent was also dark colored for the first several weeks of operation, undoubtedly due to tannins leached from the wood chips. To minimize any adverse environmental effects arising from bioreactor start-up, the effluent from the initial weeks of operation might best be applied on fallow ground as pre-irrigation. Because the salinity of tile drainage can be high (it ranged from 2 to 5 dS m−1 at sites 1 and 2), blending with a higher-quality water source may be required.
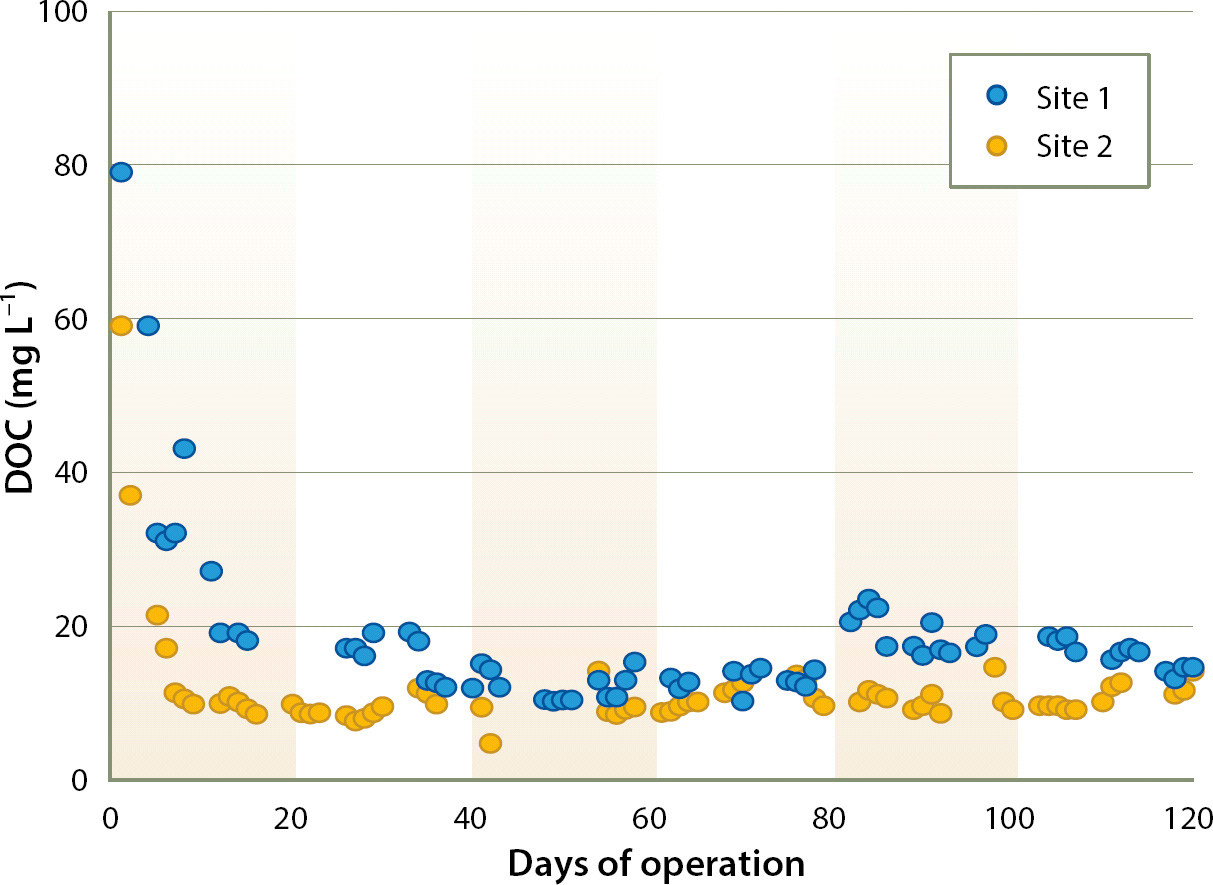
Fig. 2. Dissolved organic carbon (DOC) in bioreactor effluent in the initial 4 months of bioreactor operation.
Tile drain effluent had consistently high NO3-N concentration, ranging between 100 and 180 mg L−1 at site 1, and 60 and 120 mg L−1 at site 2 (fig. 3). There was no clear seasonal NO3-N trend. Denitrification rates were quite consistent between sites and across years. During the summer, NO3-N concentration declined by an average of 8 to 10 mg L−1 per day of HRT (equivalent to approximately 6.4 to 8.0 g N denitrified per cubic meter of bioreactor volume per day of HRT, fig. 4). Denitrification slowed during the winter, undoubtedly due to lower water temperature; NO3-N decreased by an average of approximately 5 mg L−1 per day of HRT from November through March.

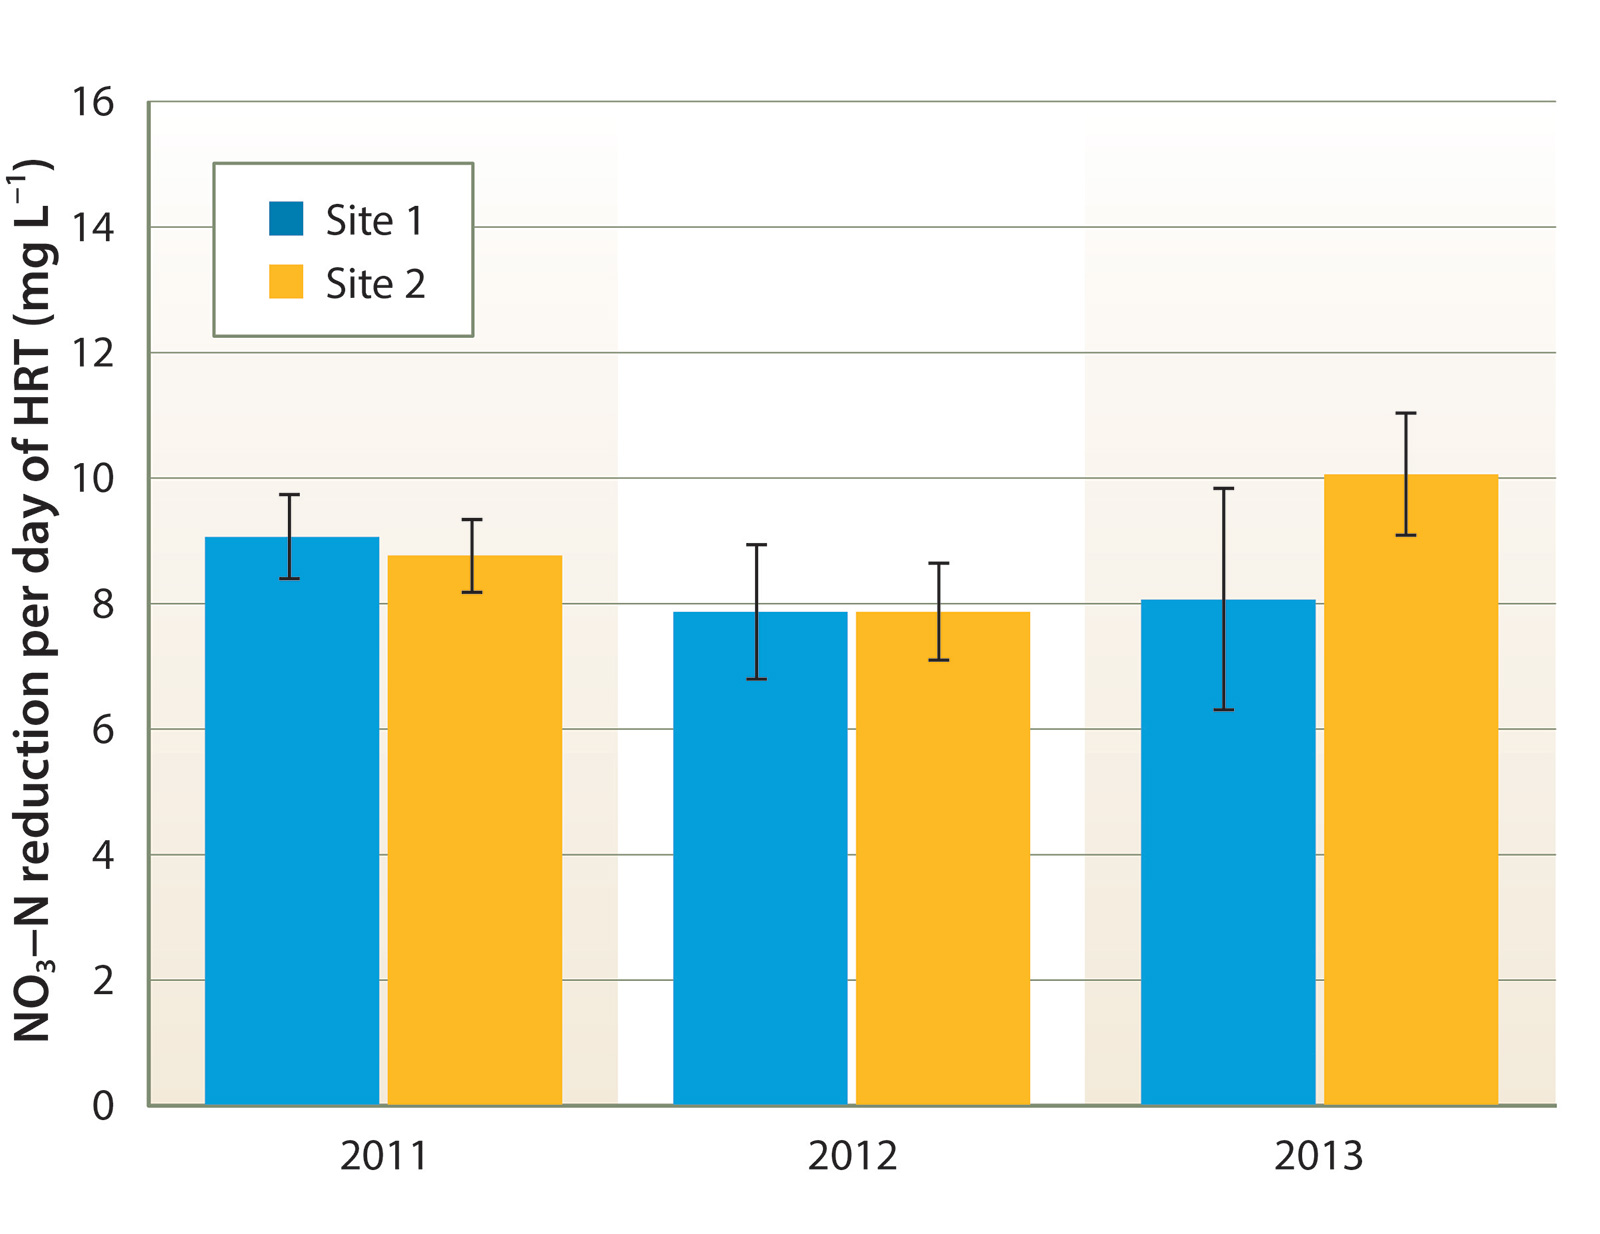
Fig. 4. Mean summer (June to September) denitrification rates achieved per day of hydraulic residence time (HRT); bars indicate standard error of measurement.
At both sites, tile drainage NO2-N was typically < 0.2 mg L−1. In the initial months of operation in 2011, bioreactor treatment increased NO2-N concentration by several mg L−1, but NO2-N in bioreactor effluent gradually declined to < 0.3 mg L−1 by that fall and remained below that level thereafter.
The denitrification rate observed during the summer was similar to that reported for a wood chip bioreactor treating a high-nitrate solution discharged from a greenhouse in New Zealand (Schipper, Cameron et al. 2010; Warneke et al. 2010) and higher than reported from sites treating water with lower NO3-N (Schipper, Robertson et al. 2010). However, due to the high NO3-N concentration of the tile drainage at these sites, water leaving the bioreactors after 2 days of HRT was often still above 100 mg L−1. To reach an environmentally acceptable NO3-N level, bioreactor treatment would have to be extended for many days, or much more rapid denitrification achieved.
We found it necessary to annually apply new wood chips at a rate of about 10% of the bioreactor volume to maintain the chip level. Most of the wood chip degradation undoubtedly occurred at the saturated/unsaturated interface, because wood chip half-life in the saturated zone has been reported to be > 30 years (Moorman et al. 2010). Chip degradation could be significantly reduced by installing an impermeable cover to separate the saturated and unsaturated zones.
C enrichment removes most NO3-N
Results from the laboratory studies confirmed that the wood chips were carbon-limited and that C enrichment dramatically increased denitrification rate. Across the range of C concentrations evaluated, there was a stable stoichiometric ratio between C enrichment and denitrification rate. That ratio was approximately 1.4:1 (C applied: N denitrified, on a mass basis) for methanol and 2.0:1 for glycerin. When C was provided at these ratios, nearly complete removal of 160 mg L−1 NO3-N was achieved within 2 days of HRT (table 1).
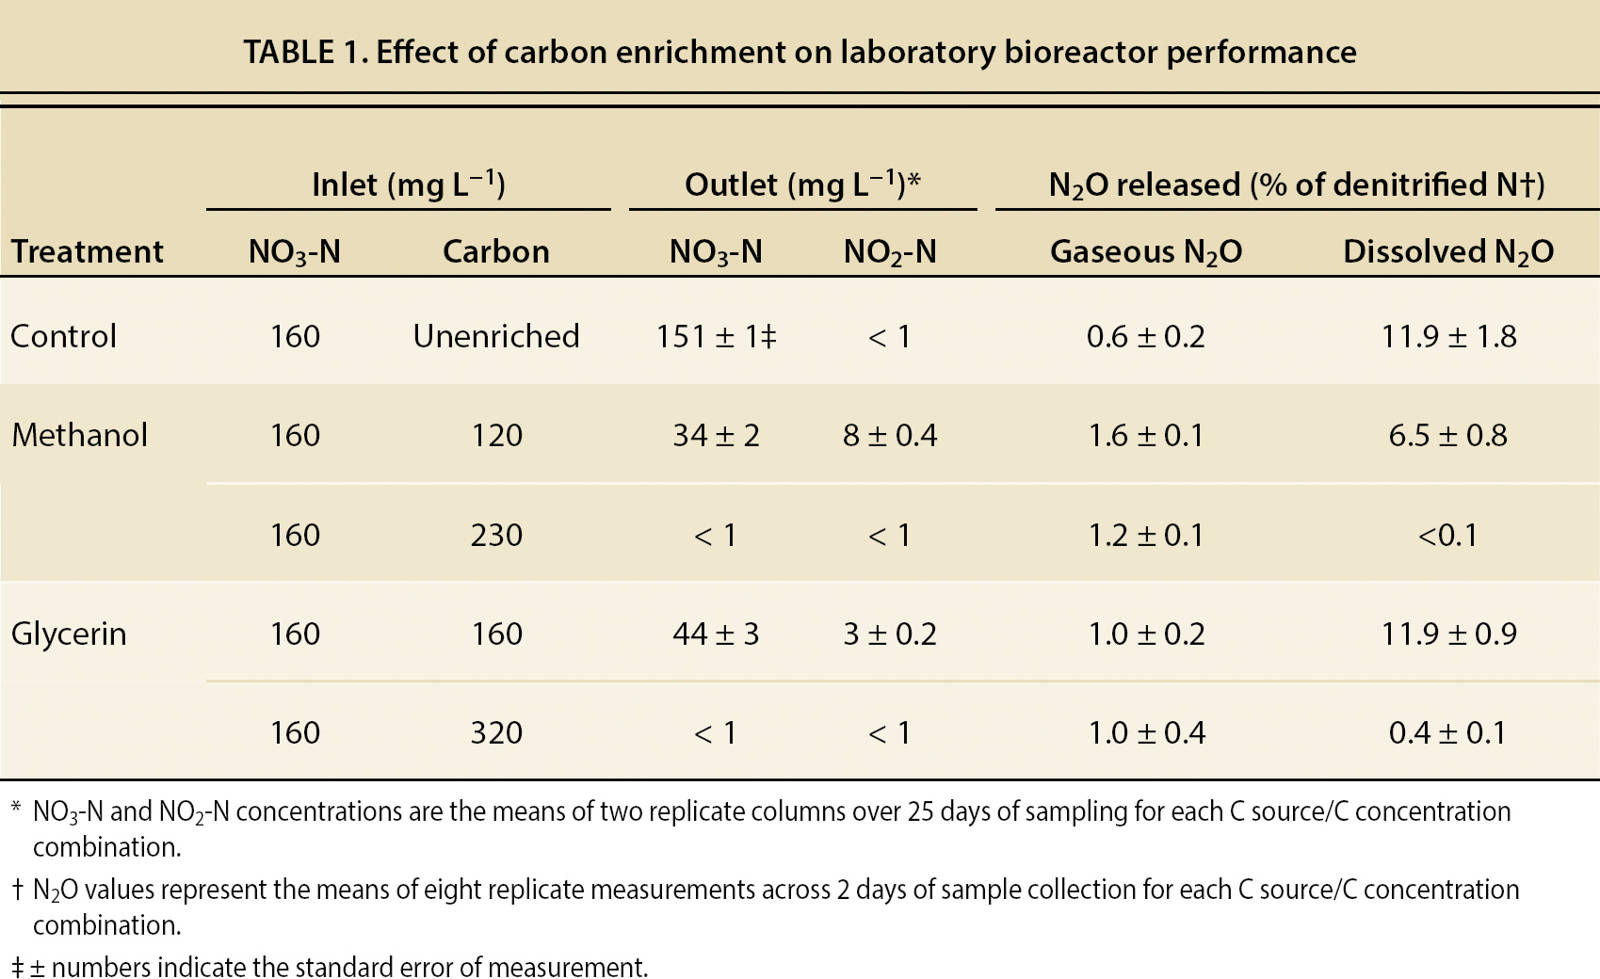
At lower levels of C enrichment, significant amounts of NO2-N and N2O were present in outlet water, signaling incomplete denitrification. In the unenriched control bioreactors, gaseous N2O release was slight, but dissolved N2O release in outlet water was substantial (when expressed as a percentage of denitrified N). A low level of C enrichment resulted in gaseous and dissolved N2O release as high as 1.6% and 11.9% of denitrified N, respectively. However, gaseous N2O release was reduced and dissolved N2O release nearly eliminated when C enrichment was sufficient to complete denitrification.
C enrichment using methanol dramatically increased denitrification rate at the site 1 bioreactor. Constant enrichment at 270 mg L−1 C resulted in nearly complete denitrification (fig. 5A). From May 5 through June 17, 2015, inlet NO3-N averaged 170 mg L−1, varying from 150 to 193 mg L−1. Outlet water NO3-N was consistently below 1 mg L−1, with no measureable NO2-N. DOC in outlet water averaged 41 mg L−1 higher than inlet water across five sampling dates.
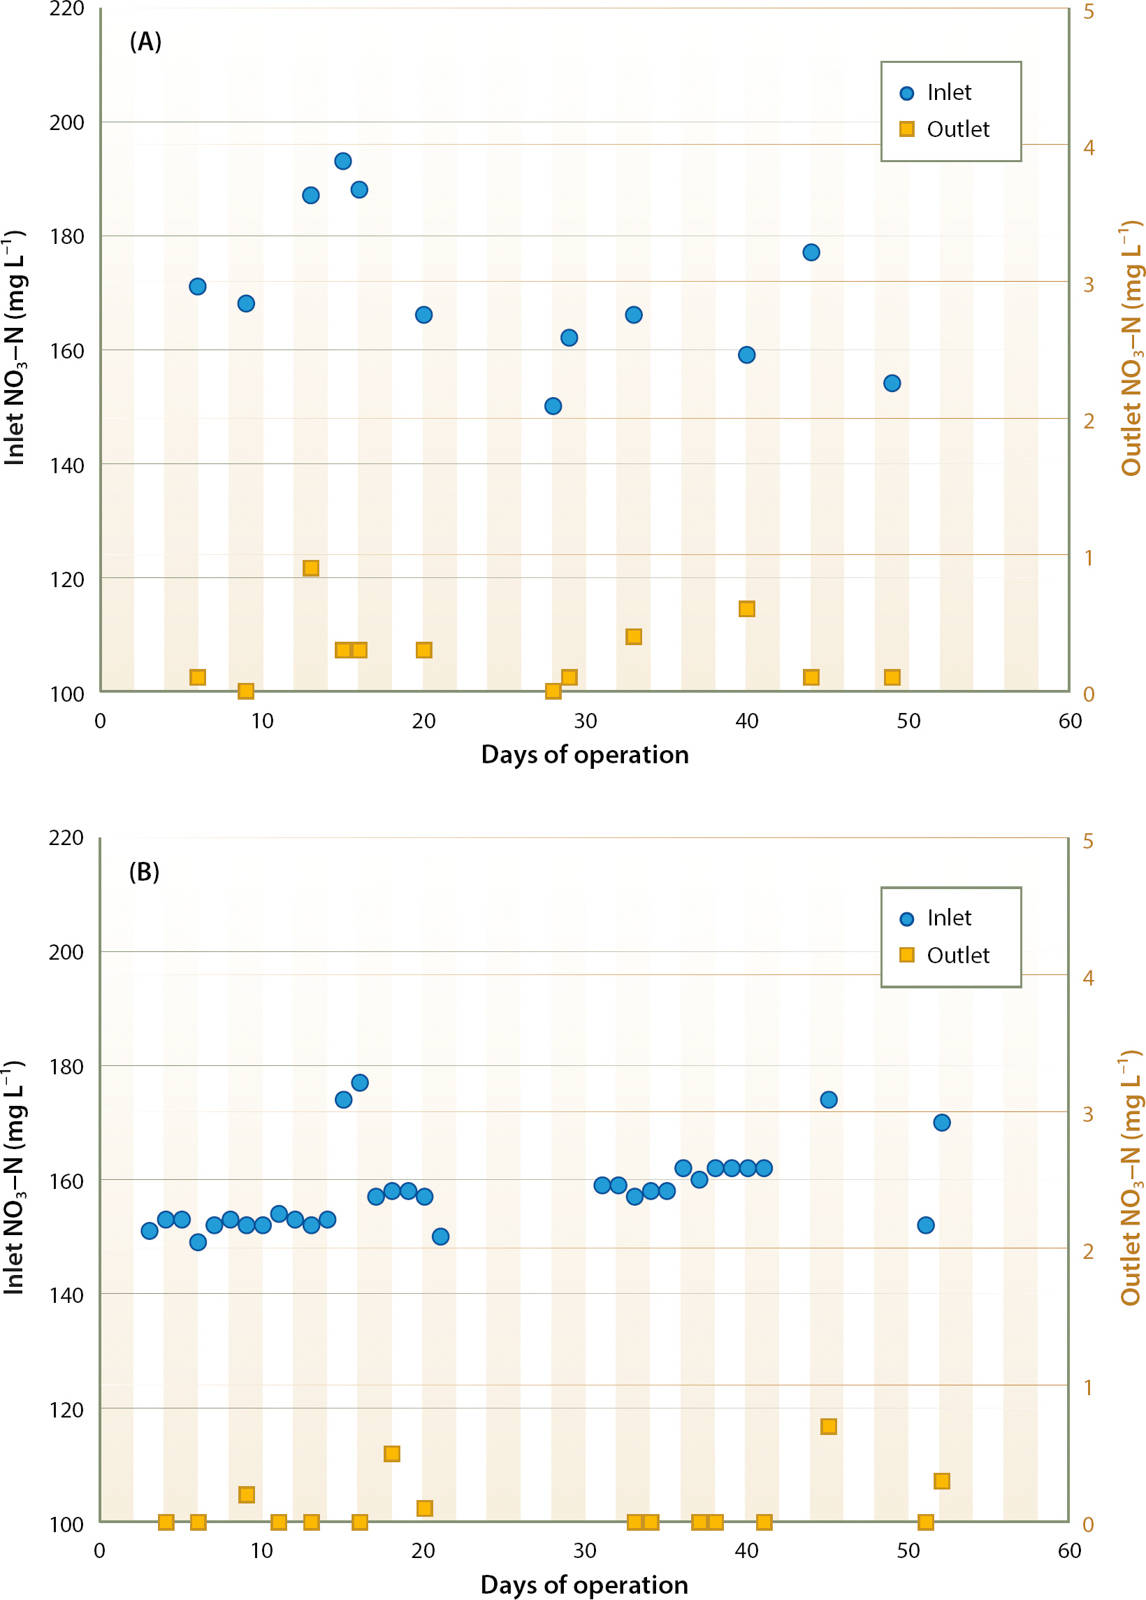
Fig. 5. Effect of carbon enrichment on bioreactor outlet NO3-N (mg L−1) at site 1; constant enrichment of 270 mg L−1 C (A), and proportional enrichment at a C:N ratio of 1.4:1 in inlet water (B).
Had the bioreactor been operated without C enrichment, denitrification of approximately 15 mg L−1 NO3-N would have been expected, meaning that denitrification of about 155 mg L−1 N could be attributed to the enrichment. Therefore, the estimated C:N ratio achieved was

This result was similar to the 1.4:1 C:N ratio for methanol determined in the laboratory studies.
Controlling C enrichment based on real-time NO3-N monitoring worked well (fig. 5B). Nitrate concentrations reported by the sensor were validated by comparison of sensor values with laboratory determinations on 26 discrete samples of the inlet water; the mean difference was 1 mg L−1 NO3-N. Across 7 weeks of operation, the ISUS sensor showed that inlet NO3-N concentration varied from 57 to 184 mg L−1. Proportionally injecting methanol at a 1.4:1 C:N ratio consistently reduced NO3-N in outlet water to < 1 mg L−1.
Dissolved N2O in outlet water during the period of proportional C enrichment represented < 0.1% of denitrified N, indicating that essentially complete denitrification was achieved. There was undoubtedly significant gaseous N2O emission still occurring along the length of the bioreactor, but this could be minimized by covering the bioreactor with a totally impermeable film (TIF), as is commonly used during soil fumigation. The use of a TIF cover would limit gaseous losses as water moves through the bioreactor, allowing sufficient time to complete the reduction of N2O to N2.
During the period of proportional C enrichment, outlet water DOC averaged approximately 10 mg L−1 higher than inlet water DOC, confirming that efficient denitrification can be achieved with C enrichment without greatly increasing DOC (and the associated increase in biochemical oxygen demand) in discharged water.
Economic feasibility
Given the high N load in tile drainage from coastal vegetable farms, a denitrification bioreactor operated in a passive mode (no C enrichment) would have to be quite large to come close to meeting the environmental target NO3-N concentration in discharged water (< 10 mg L−1). We estimated the costs of installation, operation and maintenance of a wood chip bioreactor 200 feet long, 55 feet wide and 6 feet deep (61 by 16.8 by 1.8 meters). This size was calculated to be adequate to achieve a mean discharge water NO3-N concentration of 10 mg L−1 during the irrigation season from a 200-acre (80-hectare) coastal vegetable farm producing 65,000 gallons (250 cubic meters) of tile drainage daily, based on the very conservative assumption that farm management could limit tile drainage NO3-N to 60 mg L−1.
Over a projected 10-year life, the total system was estimated to cost (net present value) approximately $92,000, or about $1.50 per pound ($3.30 per kilogram) of N denitrified (Hartz et al. 2015). At higher tile drainage NO3-N concentrations (like those observed at both field sites), the bioreactor size would have to increase, and in a passive operation mode there would be no way to effectively treat periodic fluctuations in NO3-N load.
Carbon enrichment provides a tool for handling fluctuating N loads, and it can substantially reduce the bioreactor size requirement. Our data suggest that a bioreactor employing C enrichment could achieve complete denitrification within 1.7 days of HRT, regardless of tile drainage NO3-N concentration. Therefore, a bioreactor 100 feet by 30 feet by 6 feet (30.5 by 9.1 by 1.8 meters) should be adequate for a 200-acre (80-hectare) farm producing 65,000 gallons (250 cubic meters) of drainage water daily.
We estimate the construction and operational costs for such a bioreactor to be approximately $33,000 over a 10-year period. Assuming complete nitrate removal and a mean inlet NO3-N concentration of 150 mg L−1 (similar to site 1), this expense would equate to approximately $0.60 per pound of N denitrified, exclusive of the costs associated with C enrichment. The cost of methanol fluctuates with the price of oil, but at an estimated bulk price of $2.50 to $3.00 per gallon ($0.66 to $0.79 per liter), methanol would cost approximately $1.40 to $1.70 per pound ($3.10 to $3.70 per kilogram) of N denitrified. Currently, sensors capable of continuously measuring NO3-N concentration are expensive; commercial NO3-N sensors based on the ISUS technology are at least $15,000. Also, more active management would be required to keep a C enrichment system operating efficiently than to operate a bioreactor in a passive operation mode.
Clearly, C enrichment would be more expensive than passive bioreactor operation per unit of NO3-N denitrified. However, C enrichment appears to offer the only practical way to sufficiently treat tile drainage with high but fluctuating NO3-N to consistently meet TMDL nitrate targets. Furthermore, the ability to apply C proportionally to NO3-N load is critical to efficient C utilization and to minimize both the emission of N2O and dissolved C in effluent.
Remediating tile drainage using denitrification bioreactors and proportional C enrichment may be a technology more appropriately employed on an area larger than an individual farm. A larger installation could achieve an economy of scale, reducing construction, management and NO3-N sensing costs per unit of N denitrified.
Wood chip denitrification bioreactors can reduce nitrate in tile drainage

