


All Issues
Revised chloropicrin use requirements impact strawberry growers unequally
Publication Information
California Agriculture 70(3):116-123. https://doi.org/10.3733/ca.2016a0002
Published online August 01, 2016
NALT Keywords
Abstract
Buffer zone requirements are by nature spatial and their effects are site-specific, with some fields — because of their location — more impacted than others. Using a set of strawberry fields in Ventura County that were preplant soil fumigated in 2013 as a baseline, we examined how much acreage eligible for chloropicrin fumigation would have been lost if either of two buffer zone distance regulations had been in effect: any one of the four sets of alternative distances proposed in May 2013 by the California Department of Pesticide Regulation (DPR) or the buffer zone distances DPR released in January 2015. Buffer zone distances are based on several factors including the anticipated protection of human health, referred to as the percentile of protection. We find that the effects are highly dependent on the percentile of protection. From 4% to 29% of the fumigated blocks analyzed would have had an increase in buffer zone acreage depending on the percentile of protection. In those blocks, the share of total acreage that would no longer have been eligible for fumigation with chloropicrin varied from 3% to 45%. We also identify strategies that growers employed to reduce required buffer zone distances under use requirements in effect in 2013. The most frequently used strategies were using a tarp type with the lowest buffer zone requirements (“60% tarp”), extending a buffer onto a neighboring property, road and/or farm path, and reducing application rates. The results have an important policy implication: spatially defined use regulations have very different effects for different fields; aggregated industry-level analyses will miss the range of impacts on growers.
Full text
Pesticide regulations and label requirements are increasingly defined in terms of spatial parameters. Rather than specifying uniform use regulations for all applications or banning a product, regulators restrict use according to the location of identified negative environmental or human health effects. For example, to manage humans’ chronic exposure to an active ingredient, regulators may limit total use at the township level. In addition, many label restrictions specify a buffer zone distance regarding how close pesticides can be applied to bodies of surface water. Buffer zone distance requirements sometimes result in buffer zones that reduce the treatable acreage in a field. The buffer zone is the area established around the perimeter of each application block by extending the buffer zone distance from the perimeter in all directions.
While buffer zone distances intended to protect surface water quality are dependent on the physical landscape, buffer zone distances intended to address human health effects are dependent on the location of nearby residents, workers and possible bystanders relative to the field being treated.
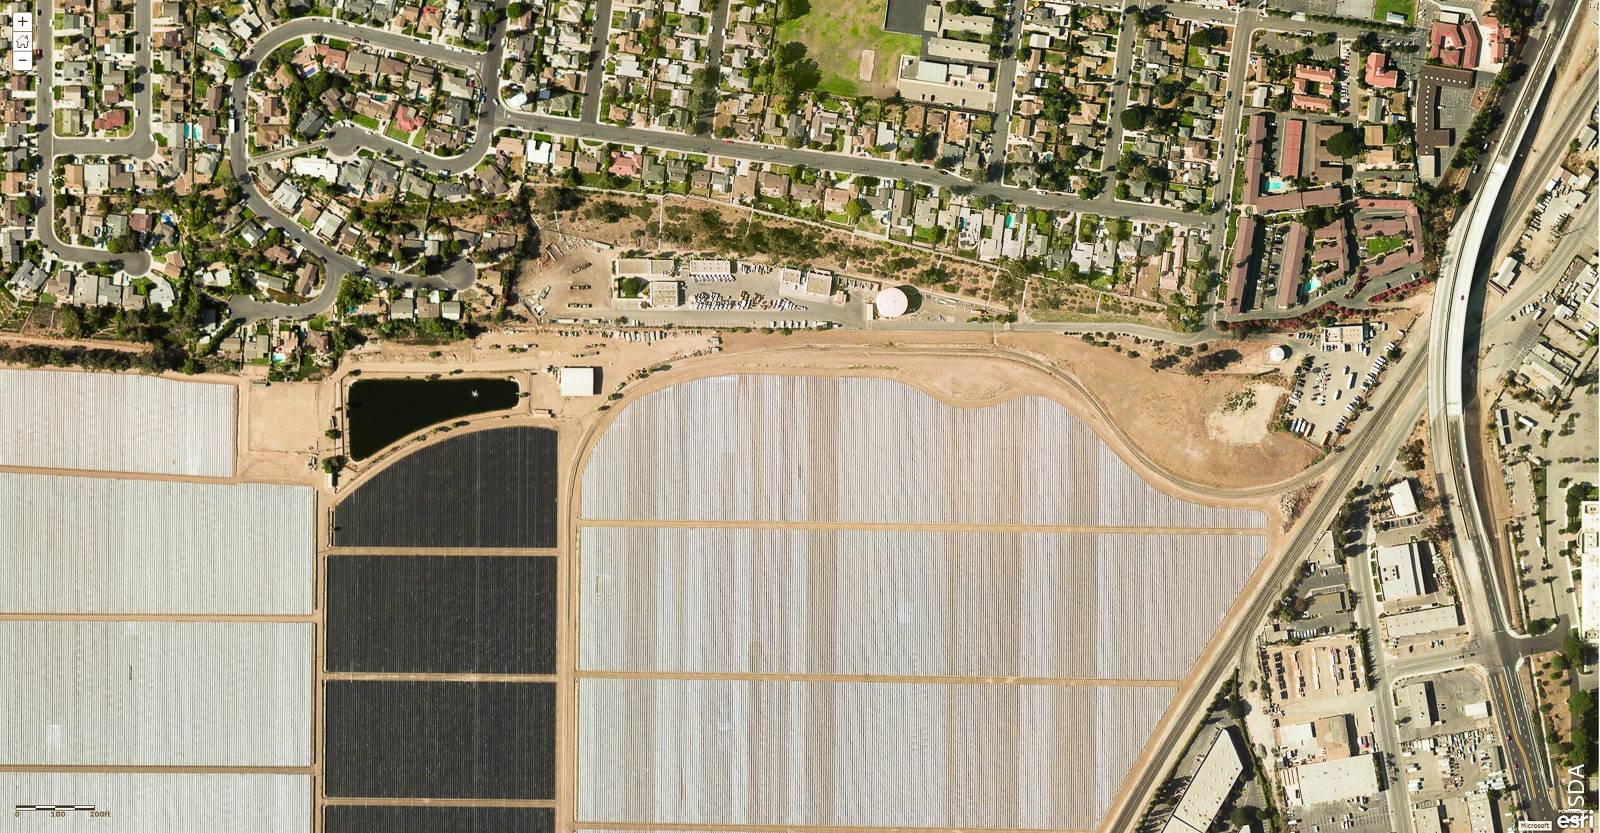
Buffer zone regulations for the fumigant chloropicrin are designed to limit human exposure. Where farms abut developed areas, such regulations may restrict treatable field area.
To comply with buffer zone regulations, a grower can sometimes set up a buffer zone outside the field, for example, if a field that needs treatment is surrounded by agricultural land that doesn't need treatment (fig. 1). But in other cases, such as when the field borders a subdivision, or a farm road or storage building, for example, the required buffer zone distance must extend inside the field, effectively reducing the treatable area of the field (fig. 2).
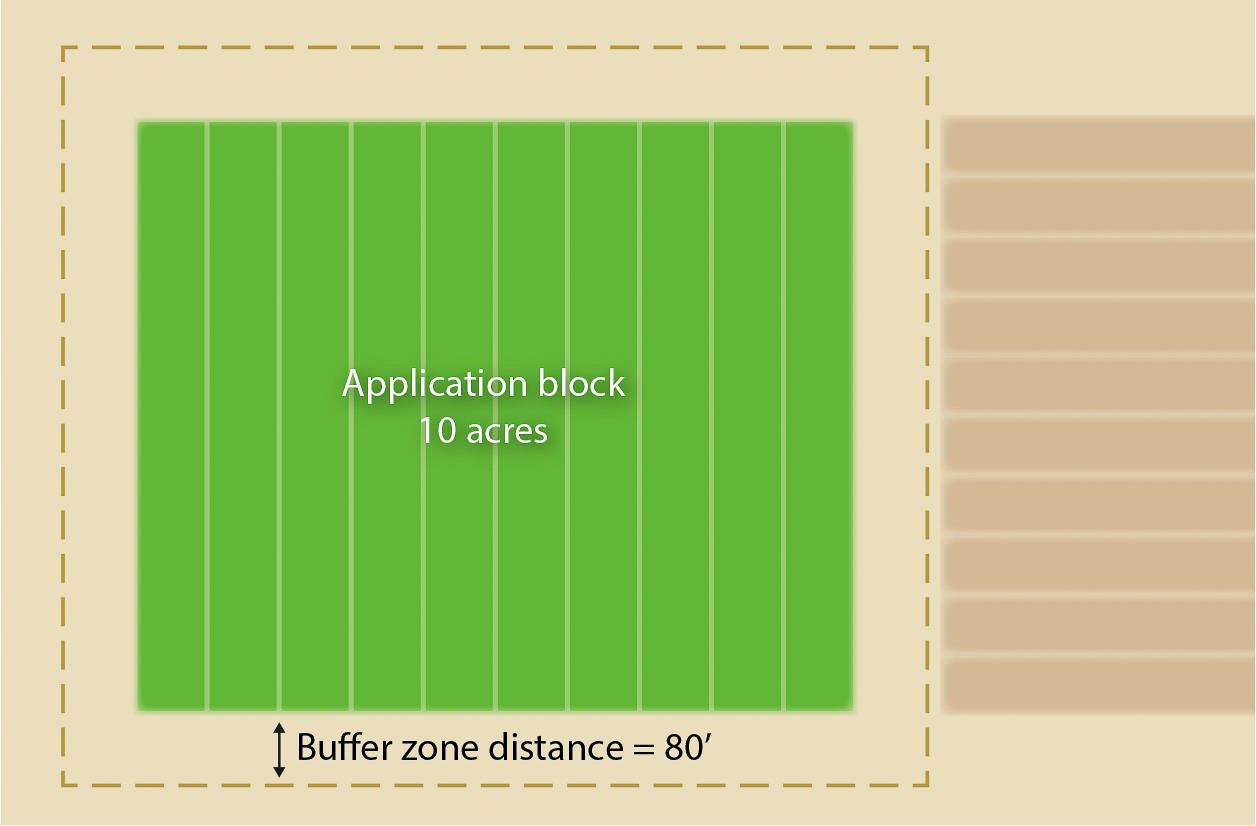
Fig. 1. Buffer zone lies outside the fumigated block so the size of the treatment application block is not affected.
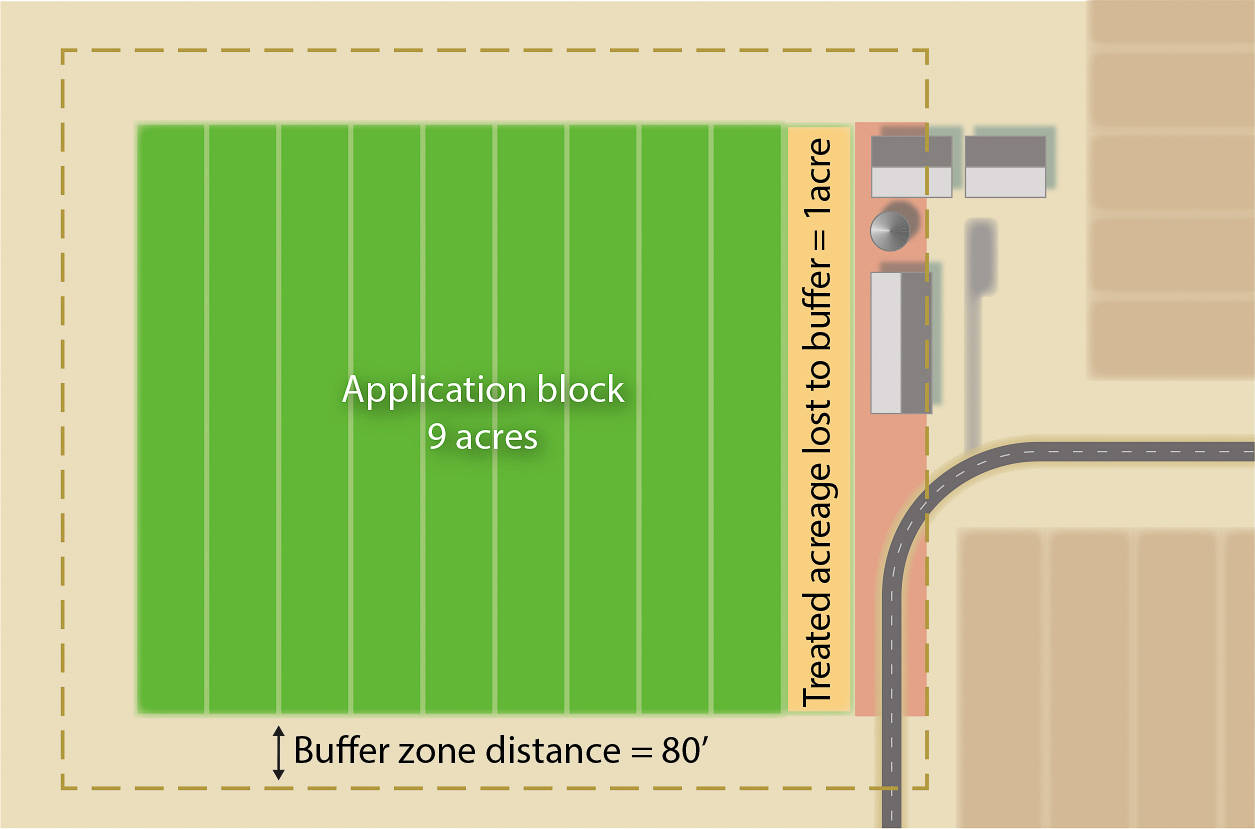
Fig. 2. When a buffer zone cannot be extended outside a field, the size of the treatment application block is reduced.
Such differences mean that the effects of a buffer zone distance requirement are heterogeneous across fields. Our objective was to evaluate how much the effects vary, and the extent to which growers are able to mitigate the loss of treatable acreage using various management strategies. We addressed these questions using a set of strawberry fields in Ventura County that had been treated with chloropicrin preplant soil fumigation in 2013. We considered the losses of treatable acreage that would have occurred if different buffer zone distances had been necessary: the four sets of buffer zone distances proposed in May 2013 by the California Department of Pesticide Regulation (DPR) and the buffer zone distances DPR released in January 2015. We also identified strategies that growers were employing in 2013 to reduce the effects of required buffer zone distances and the frequency with which they were used.
Preplant treatments of chloropicrin are widely used to control nematodes, soil pathogens and some weeds. Chloropicrin may be applied as a sole active ingredient or in a product that also contains methyl bromide or 1,3-D. Products containing both chloropicrin and methyl bromide are also subject to regulations governing the use of methyl bromide, including minimum buffer zone distance requirements (DPR 2016a).
Strawberries account for roughly 70% of the chloropicrin applied annually in California, primarily on the Central Coast between Ventura and Santa Cruz counties (DPR 2016b). Treated soil is covered with plastic tarps during the fumigation application. Potential risks are eye, nose, throat and upper respiratory irritation for people working or living near fields as a result of volatilization of chloropicrin (DPR 2010). Safety measures to reduce exposure are in place at the county, state and federal levels.
Baseline regulations
The strawberry fields in Ventura County that served as the baseline for our study were treated in compliance with two sets of regulations in place in 2013: the Phase 2 U.S. Environmental Protection Agency's (EPA's) label requirements for chloropicrin and DPR's 2013 recommended permit conditions as implemented by the county. State regulations must conform to U.S. EPA's requirements; for a state regulation to have an effect it must be stricter than federal requirements.
The regulatory provisions relevant for our analysis were buffer zone distance, buffer zone distance credits (e.g., allowing smaller buffer zone distances if high-barrier tarp is used), minimum buffer zone distance, maximum application block size and requirements for applications with overlapping buffer zones. We omit discussion of other regulatory provisions that are not relevant for strawberry production in Ventura County, e.g., regulations related to tree hole fumigation.
Phase 2 EPA requirements
The key features of the Phase 2 EPA requirements are as follows: Buffer zone distances are based on application block size, fumigant application method and rate, and tarp type, and are implemented on product labels. Buffer zone distance credits are given for the use of specific high-barrier tarps that reduce fumigant emission rates and associated human health effects, as well as for other practices not relevant for this study such as untarped applications. The minimum buffer zone distance for all fumigations is 25 feet. Maximum application block size for a 24-hour period is between 120 and 160 acres depending on the material and rate applied. Applications with overlapping buffer zones must be made at least 12 hours apart and the required buffer zone distances are dependent on the tarp types used on the individual application blocks.
2013 DPR recommended permit conditions
Recommended permit conditions were issued by DPR as guidance for counties issuing restricted material permits; although they are not mandatory, they were adopted by all permitting counties in 2013. Among tarp types, only 60% tarp (eligible for a 60% buffer credit from EPA due to its lower permeability) qualified for a buffer zone distance credit; tarps with 20% or 40% credit from EPA were not given credit in the permit conditions. Minimum buffer zone distances increased for non-60% tarps (other tarps). The minimum buffer zone distances are 25 feet for 60% tarp (EPA is 25 feet minimum for any tarp). For other tarps, the minimum is 60 feet for treatment blocks less than or equal to 6 acres and 100 feet for blocks greater than 6 acres and up to 40 acres. Otherwise, buffer zone distances are the same as in the EPA regulations.
The maximum application block size is 40 acres within a 24-hour period. Applications with overlapping buffer zones are subject to additional requirements: within a 36-hour period after the completion of the first application, only a combined maximum of 40 acres can be treated, and buffer zone distances depend on tarps and acreage for all applications. If both blocks use 60% tarp, the buffer distances are calculated per individual block acreage. However, if at least one block is other tarp, then the buffer distances are calculated with the combined acreage and the resulting buffer distance is applied to all of the combined blocks.
Recent DPR regulatory initiatives
The fumigation decisions reported for the strawberry fields in Ventura in 2013 were made under the 2013 DPR recommended permit conditions and the Phase 2 EPA regulations, described above. Our study examines what the consequences would be in terms of buffer zone acreage if the 2013 mitigation proposal or 2015 mitigation measures had been in effect at that time.
2013 DPR mitigation proposal
In May 2013, DPR issued the chloropicrin mitigation proposal (referred to below as the proposal) regarding potential future use requirements for fumigant products that contain chloropicrin as an active ingredient, either alone or with 1,3-D or methyl bromide in California (DPR 2013a). The objective of the proposal was to offer means of mitigating short-term adverse health effects for nearby residents and bystanders in addition to the measures in the Phase 2 EPA requirements. The proposal contains five types of mitigation measures: buffer distances, acreage limits for applications, waiting periods between applications in instances where buffer zones overlap, emergency preparedness and response requirements, and notice of intent (NOI) requirements.
The proposal details buffer zone distances based on four possible percentiles of protection for human health (80th, 85th, 90th and 95th). For each percentile of protection under consideration, buffer distances are presented for three categories of tarp (60%, other, and no tarp). The percentile of protection is the probability of not exceeding the 73 parts per billion target concentration outside the buffer zone. DPR estimates the buffer zone distance required to achieve each percentile of protection using available scientific information such as air monitoring, computer modeling and the results of toxicology studies. The four percentiles of protection were proposed as four alternative human health standards with associated buffer zone distances to be considered for future implementation. The intent of the proposal process was for DPR to ultimately select one percentile of protection for the final mitigation measures following public comment and further analyses of the proposal.
The buffer zone distance requirement for applications using 60% tarp is the same in the proposal as in the Phase 2 requirements. For other tarps, the buffer zone distances in the proposal vary with the application method, application rate, acreage treated and the percentile of protection. For some fumigation block sizes and application rates, buffer zone distances are larger than the EPA ones for applications using other tarps. The maximum application block size and requirements for applications with overlapping buffer zones were the same as those in the 2013 recommended permit conditions.

Strawberries account for roughly 70% of the chloropicrin applied annually in California, primarily on the Central Coast between Ventura and Santa Cruz counties.
2015 DPR mitigation measures
In January 2015, DPR announced its decisions and intent with regard to required mitigation measures involving applications of chloropicrin (DPR 2015). The document includes an explanation of the decision process and the scope of the mitigation strategy. A few months later, DPR released the exact requirements added to the pesticide enforcement program standards (DPR 2016a). These mitigation measures include modifications to many of the measures in the proposal and effectively replace the 2013 recommended permit conditions. The 2015 mitigation measures used for this analysis were modified in February 2016. DPR is currently working with registrants (manufacturers and distributors) to develop California-only labels for chloropicrin products consistent with the mitigation measures. Amendments to the product labels must be approved by EPA before those labels can be approved for use in California. In other words, the mitigation measures are final, although the way in which they are implemented will change from DPR interim recommended permit conditions to EPA approved product labels.
The 2015 control measures are based on the 95th percentile of protection of human health standard (DPR 2015); however, due to the inclusion of additional weather data (that allowed refinement of buffer zone distances by region), refining of buffer zone distances based on application method, and corrections of errors, the buffer zone distances in the 2015 mitigation measures are smaller than the 95th percentile buffer zone distances in the 2013 proposal except for the lowest application rate for small treatment blocks.
There are two additional changes in buffer zone distance requirements relative to the 2013 proposal. First, when applications with overlapping buffers use 60% tarp, then the buffer zone distance remains at 25 feet but the applications must treat no more than 60 acres in total. Second, when one or more applications using 60% tarp have overlapping buffers with one or more applications using other tarp, the acres treated under 60% tarp do not need to be included when calculating the required buffer zone distances for the applications using other tarp.
Field fumigation data collection
We examined a subset of restricted material permits for preplant soil fumigation of Ventura County strawberry fields in 2013. At that time, the county permit conditions were equivalent to DPR's 2013 recommended permit conditions plus an added requirement that areas treated within a 12-hour period that have overlapping buffers are treated as a single field for the purpose of calculating buffer zone distances.
The notice of intent (NOI) data we examined report growers’ actual 2013 preplant soil fumigation decisions. An NOI is part of a restricted materials permit. Each NOI describes the fumigation of a designated field. Each field may be subdivided into any number of blocks, with each block treated as a unique fumigation event (“a fumigation”).
Each NOI contains a map (or maps) of the site, the fumigation method, the fumigant, broadcast rate in pounds of product and the tarp used. All applications we examined used some type of tarp, as is standard in California strawberry production. The NOI also may include information about the individual blocks within the site to be fumigated each day, such as the block size, the date of each fumigation and the buffer zone distance for each fumigation block. In addition, the maps show the shapes of the blocks and location of the buffers. Most importantly, they depict the physical relationships among the fumigation blocks and between the fumigation blocks and adjacent land, including the property operator of adjacent farmland, urban areas, and occupied structures. In most cases, the maps are the only way to identify overlapping buffer zones because the available GIS data do not provide information on fumigation blocks and buffers, only on fields.
The Ventura County agricultural commissioner's office provided the NOIs in response to our request for public records. To get a diverse sample, we requested NOIs associated with permits for fields adjacent to urban areas, adjacent to strawberry fields owned by other growers, and adjacent to agricultural land in crops other than strawberries. The data include preplant fumigations using chloropicrin with and without 1,3-D, and chloropicrin without methyl bromide. The data cover 17 permits containing 80 NOIs, accounting for a total of 271 fumigations, which represent about two-fifths of Ventura County's 2013 fumigations using chloropicrin that did not include methyl bromide. As explained earlier, each permit corresponds to one grower, each NOI to one field. Each field can be divided into fumigated blocks that each have a related buffer distance and buffer zone meeting all requirements. Therefore, the number of blocks equals the number of fumigations and, for the permits we examined, is larger than the number of fields.
For each fumigation, we entered the date, block size and buffer zone distance and indicated whether the grower extended the buffer zone distance onto his or her own property outside the fumigated block. For other tarp fumigations only, we noted the percentage of the perimeter for which there was an opportunity to extend the buffer farther outward. In addition, we entered information from the corresponding NOI, including permit number, site ID, planted and treated acres, total product and broadcast rate (pounds), and method (including use of 60% tarp).
We also entered the use of three buffer zone–reducing practices: increasing the number of hours between adjacent applications to 36 hours or more, extending buffers onto adjacent fields, farm paths or roads, and reducing block size to 6 acres or less when using other tarp.
Growers’ response to 2013 regs
As noted earlier, buffer zone distances are determined by fumigation block size, application method, tarp type and fumigant. First, we summarized the number of blocks by size. Almost a quarter of blocks (25%) were 6 or fewer acres. Another 19% were between 6 and 10 acres. Overall, 230 fumigations (85%) were 20 or fewer acres.
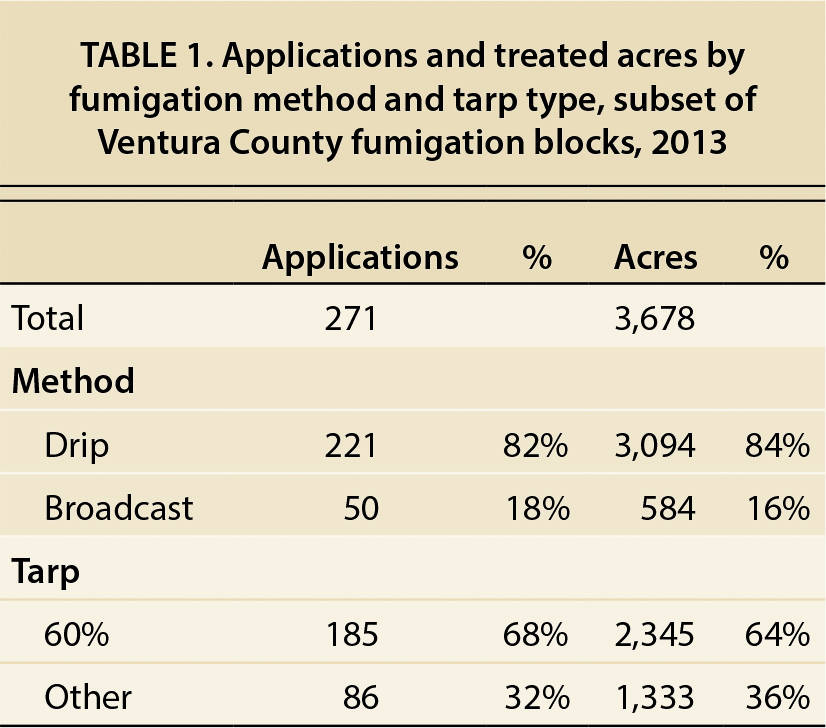
TABLE 1. Applications and treated acres by fumigation method and tarp type, subset of Ventura County fumigation blocks, 2013
Next, we summarized the number of fumigations and treated acreage by method (drip/chemigation, or broadcast) and tarp type (60% or other). Table 1 reports the share of applications and acreage using each of the two application methods and each of the two tarp types. The majority of applications (64%) used 60% tarp — for 60% tarp, buffer zone distances did not change under the 2013 proposal or 2015 mitigation measures. Drip was used over 80% of the time.
Table 2 reports the share of fumigations by tarp type for each method. Although the largest number of fumigations used drip and 60% tarp, almost all broadcast applications used 60% tarp compared to 62% of drip applications. This may be because the average application rate is higher for broadcast than for drip, and buffer zone distances increase with the application rate. Thus, growers using broadcast have more of an incentive to use a tarp that provides a 60% buffer reduction credit. (It is important to note that there are two important non-regulatory factors that may have driven the difference in the use of 60% tarp by application method: using 60% tarp represents a $320 per acre increase above the cost of using other tarp, and 60% tarps that were physically flexible enough to cover mounded strawberry beds for bed fumigations have only recently become available.)

TABLE 2. Applications and treated acres by combinations of fumigation methods and tarp types in 271 Ventura County fumigation blocks, 2013
There are a number of strategies growers can use to reduce the buffer zone for a fumigation block. First, it can be reduced by altering the governing factors: tarp type, product application rate, block size, and overlapping buffers across blocks using other tarp or across neighboring blocks fumigated at least 12 hours apart. Growers have additional options in some cases. They can locate the buffer on a road, on other property they own or operate, or on property owned by another entity.
We report in table 3 the number of fumigations and acres where such strategies were used. These numbers do not reflect entirely the importance of these strategies because it is not always feasible for a grower to choose a specific strategy. For example, growers can only choose to extend a buffer zone on other acreage they own or operate if they own or operate adjacent land. Percentages are reported as a share of the total number of NOIs where each measure was feasible, not as a percentage of all fumigations.
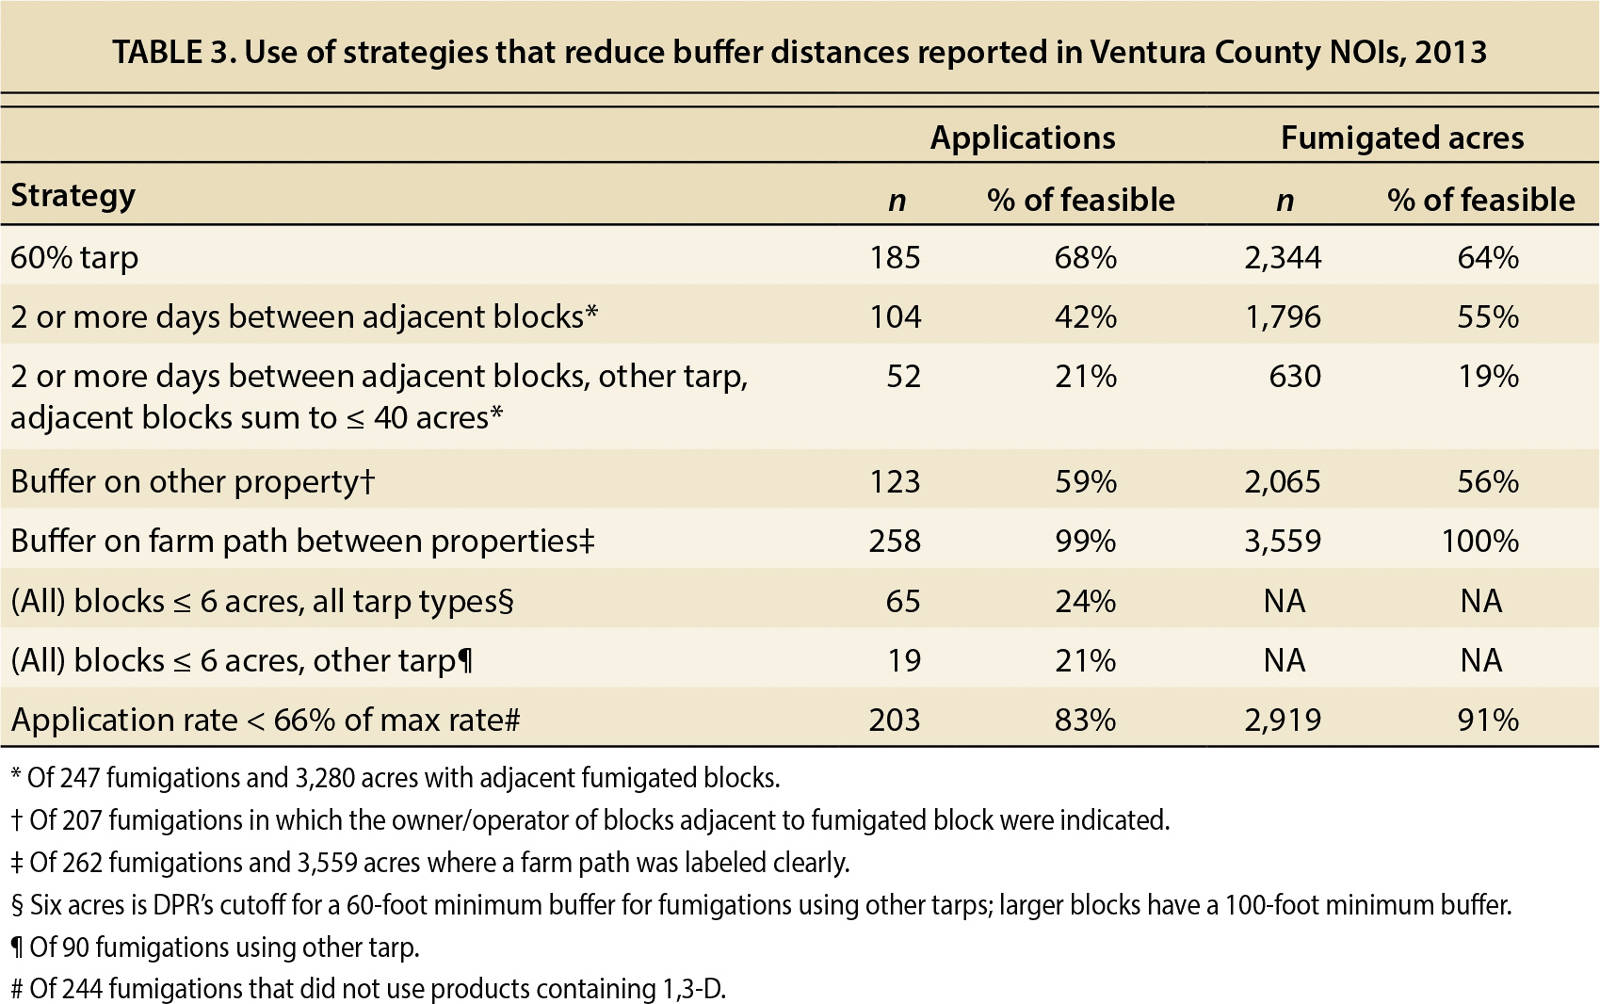
Table 3 shows that using a 60% tarp, putting a buffer on a neighboring property, road or farm path, and using lower application rates were the most common strategies to reduce buffer zone acreage. Virtually all fumigations extended buffer zones onto farm paths. Most fumigations used application rates substantially lower than the maximum application rate allowed on the EPA label: 83% of fumigations and 91% of treated acreage used application rates less than 66% of the permitted maximum. (The base for this percentage excludes applications of products also containing 1,3-D because 1,3-D is subject to township caps — limits on the total amount of the material that can be applied in each 36-square mile township — which could also drive a reduction in the application rate.)
Of course, growers may have used these measures for reasons other than buffer zone reduction. For example, a grower may have needed to wait 2 or more days between fumigations due to the unavailability of irrigation equipment or fumigation rigs. Growers may have used a lower product application rate to save money or because of a history of low disease pressure in the block. However, regardless of the reasons for their use, the factors reported in table 3 did determine buffer zone distance.
Valuation of buffer zone sizes
We estimated buffer zone distances for each fumigation block under the baseline 2013 conditions (Phase 2 EPA regulations and 2013 recommended permit conditions), the 2013 DPR proposal, and the 2015 DPR mitigation measures. The distances were based on the tarp type, block size and application rate.
The 2013 baseline buffer zone distances were computed using the EPA's online calculator (US EPA 2015) and checked against permit requirements for each NOI; we excluded two fumigations from the analysis because the EPA buffer for both fumigations was much smaller than the buffer on the NOI and we could not determine the reasons for these differences.
We estimated what the buffer zone distances would have been if the 2013 DPR proposal requirements had been in effect by using the tables for the four percentiles of protection in the proposal (DPR 2013a). Similarly, we used the tables in DPR's 2015 mitigation measures to estimate what the buffer zone distances would have been if that regulation were in effect (DPR 2016a). It should be noted that we used the tables in effect in 2015 and not the 2016 revisions to those tables. We did not consider any changes in growers’ choices regarding block size, application method, rate or tarp; many factors affect treatment decisions including pest and disease pressure, terrain, irrigation system design and cost.
After determining the applicable CDPR 2013 proposal buffer zone distance for each percentile of protection for each fumigation block, we calculated the total estimated acres in the buffer zone. If the fumigation buffer zone distance and buffer zone acreage were based on combined acreage with other blocks due to the overlapping buffer rule, we used the combined acreage to calculate them.
The buffer acreage calculations required the simplifying assumption that fumigation blocks were square due to limitations of the NOI map data, and that the buffer extended outside the fumigation block for the percentage of the perimeter that the information in the map indicated. This approach results in an approximation of the buffer zone acreage because the fumigation blocks in reality have a broad range of shapes and proportions. However, we could not discern the lengths of all block sides from the maps, and GIS data of the quality necessary to address buffer requirements were not available. Because the approach is consistent across buffer requirements, the approximation does not introduce distortions in the comparison of different requirements.
To evaluate the incremental effect of the 2013 DPR recommended permit conditions, we compared the calculated Phase 2 EPA buffer zone distances to the NOI buffer zone distances and calculated the associated buffer zone acreages. Seventy-six of the 269 fumigations analyzed had NOI buffer distances larger than the EPA buffer distance, increasing total buffer zone acreage by 186 acres. There were 53 fumigations where NOI and EPA buffer distance differed by 5 feet or more, accounting for virtually all of the increase in buffer zone acreage (183 acres in total). On average, these 53 fumigations saw an increase of 3.34 acres in buffer zone acreage.
Overall, these numbers indicate that DPR's 2013 recommended permit conditions increased buffer zone distances for 28% of blocks, with variation in the extent of this increase and the associated effects on the number of treated acres. Note that these acreage effects regard total buffer zone acreage, not the planted acreage lost to incremental increases in buffer zone distances. Technically, growers are not restricted from planting in untreated areas. We used the same approach to compare the buffer zone distances and resulting buffer zone acreage that would have been required in the 2013 DPR proposal and 2015 DPR mitigation measures to the buffer distances and buffer zone acreage in the NOIs.
Calculating the treated strawberry acreage that would have been lost to buffer zones as a consequence of the 2013 proposal or 2015 mitigation measures was more complex than calculating the actual 2013 buffer zone acreages. This calculation was only necessary for fumigations using other tarps, as these tarps are the only ones where buffer zone distances increased. We assumed that growers using other tarps would be able to expand buffer zones onto their own fields, and would be able to expand onto other growers’ fields if the 2013 buffer zones already did so. Only 30 fumigations would not have been able to extend the buffer zone distance outward, in full or in part, due to being adjacent to a residential area, industrial property or permanent walking path.
Buffer zone acreage effects
In the case of applications using 60% tarp, there was no difference in buffer zone acreage between that reported in the NOI and the acreage that would have been necessary under the 2013 proposal or 2015 mitigation measures (the EPA buffer zone distance for 60% tarp was larger than that in the state regulations, and therefore the EPA distance takes precedence in all cases). Disaggregating applications using other tarp by application method, all fumigations with increases in buffer zone distances are drip applications with the exception of a single block with a broadcast application at the proposal's 95th percentile of protection.
Our analysis of the acreage effects of the 2013 proposal and 2015 mitigation measures has three components. The first estimates the total increase in buffer zone acreage due to increases in buffer zone distances (table 4). The second estimates the reduction in acreage that can be fumigated due to increases in buffer zone distances (table 5). The reduction in acreage that can be fumigated is smaller than the increase in buffer zone acreage if growers can extend buffer zone distances farther outside the field. The third focuses on the subset of 30 blocks for which the recent buffer zone rules result in a reduction in the acreage that can be fumigated (table 6).
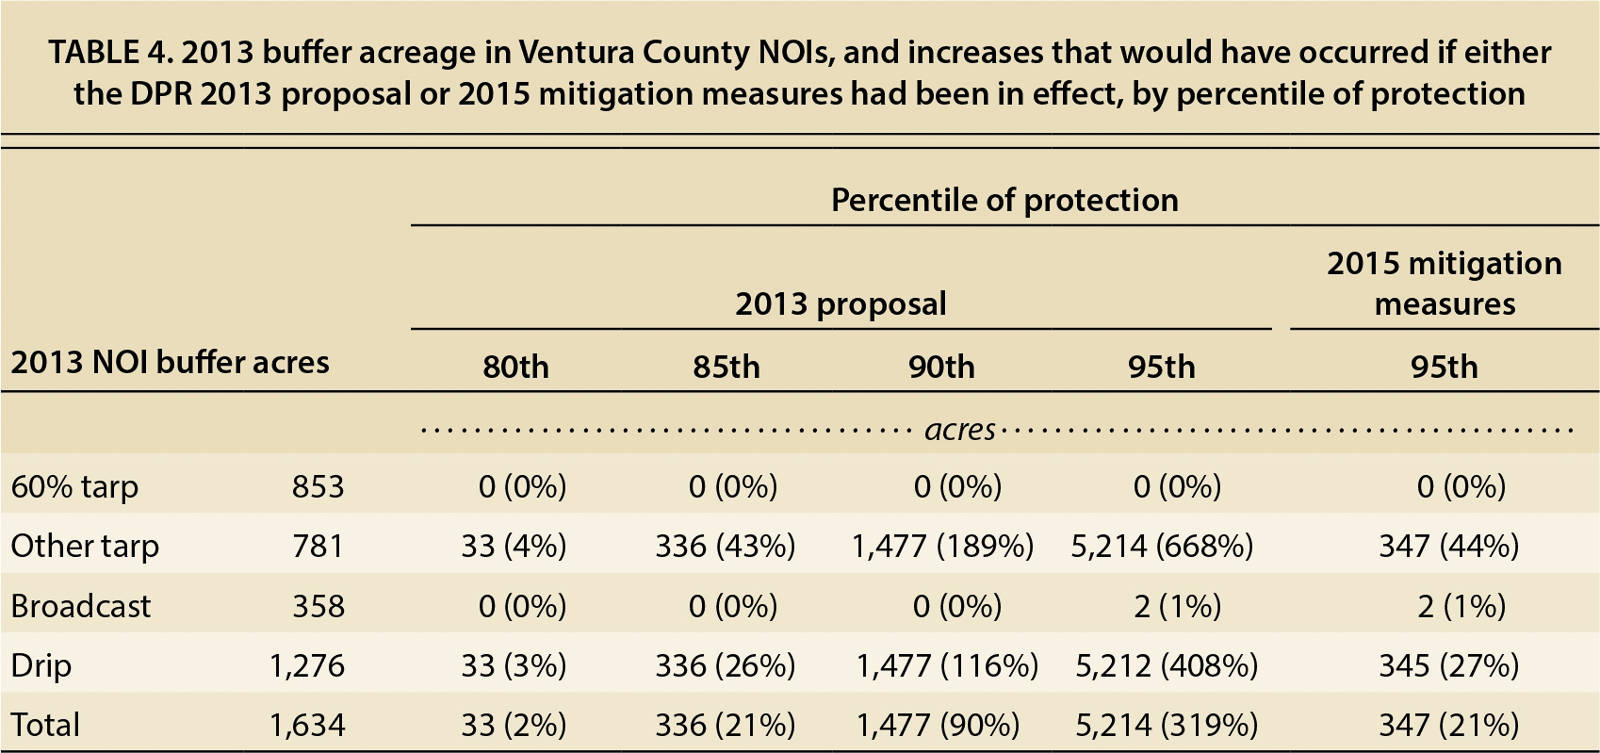
TABLE 4. 2013 buffer acreage in Ventura County NOIs, and increases that would have occurred if either the DPR 2013 proposal or 2015 mitigation measures had been in effect, by percentile of protection
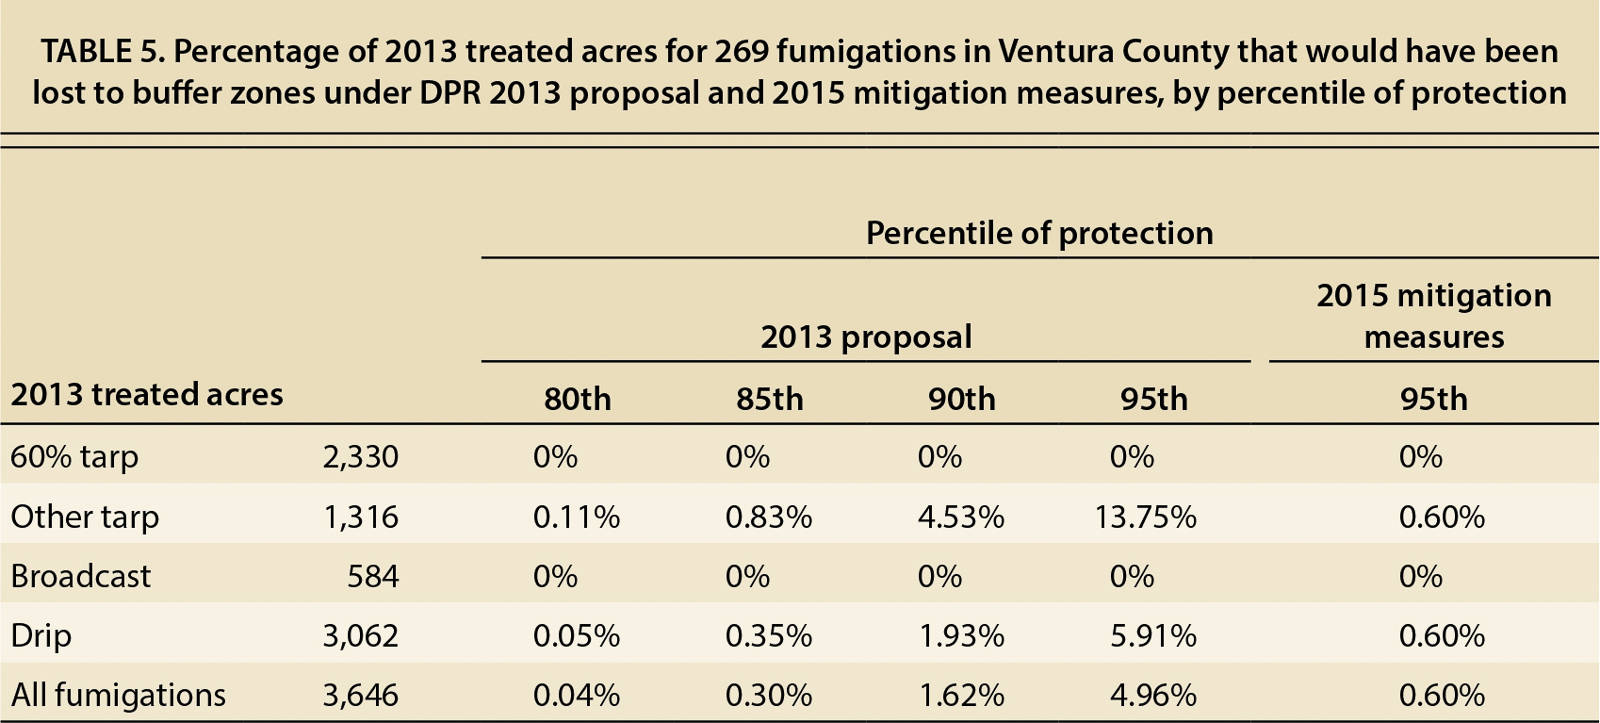
TABLE 5. Percentage of 2013 treated acres for 269 fumigations in Ventura County that would have been lost to buffer zones under DPR 2013 proposal and 2015 mitigation measures, by percentile of protection
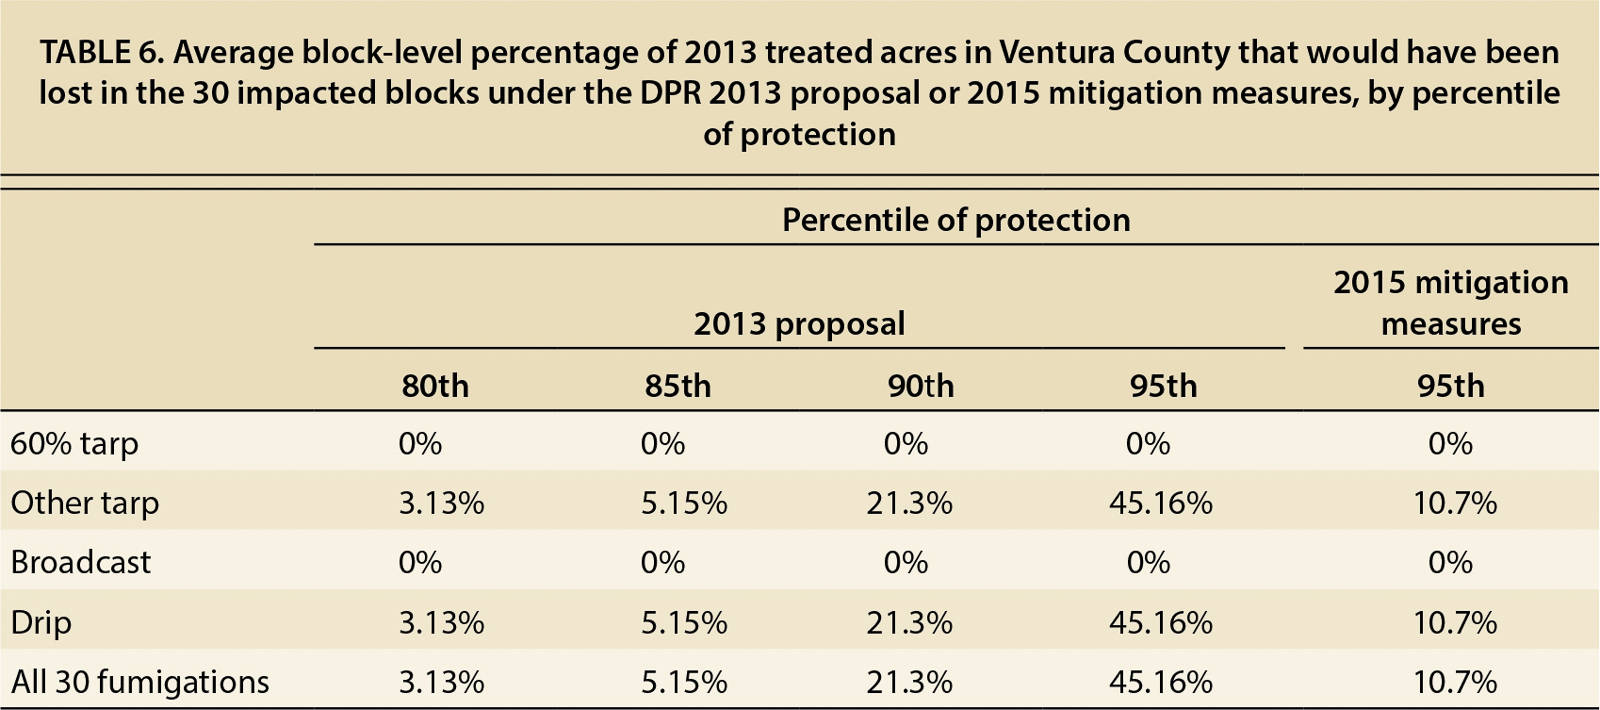
TABLE 6. Average block-level percentage of 2013 treated acres in Ventura County that would have been lost in the 30 impacted blocks under the DPR 2013 proposal or 2015 mitigation measures, by percentile
Figure 3 summarizes the number of fumigations for which the buffer zone distance would increase under the 2013 proposal and 2015 mitigation measures compared to the distances reported in the NOIs. The number increases as the percentile of protection increases in the DPR 2013 proposed regulations. The number drops under the 2015 mitigation measures, affecting only 30 fumigations (11% of the total number of fumigations).
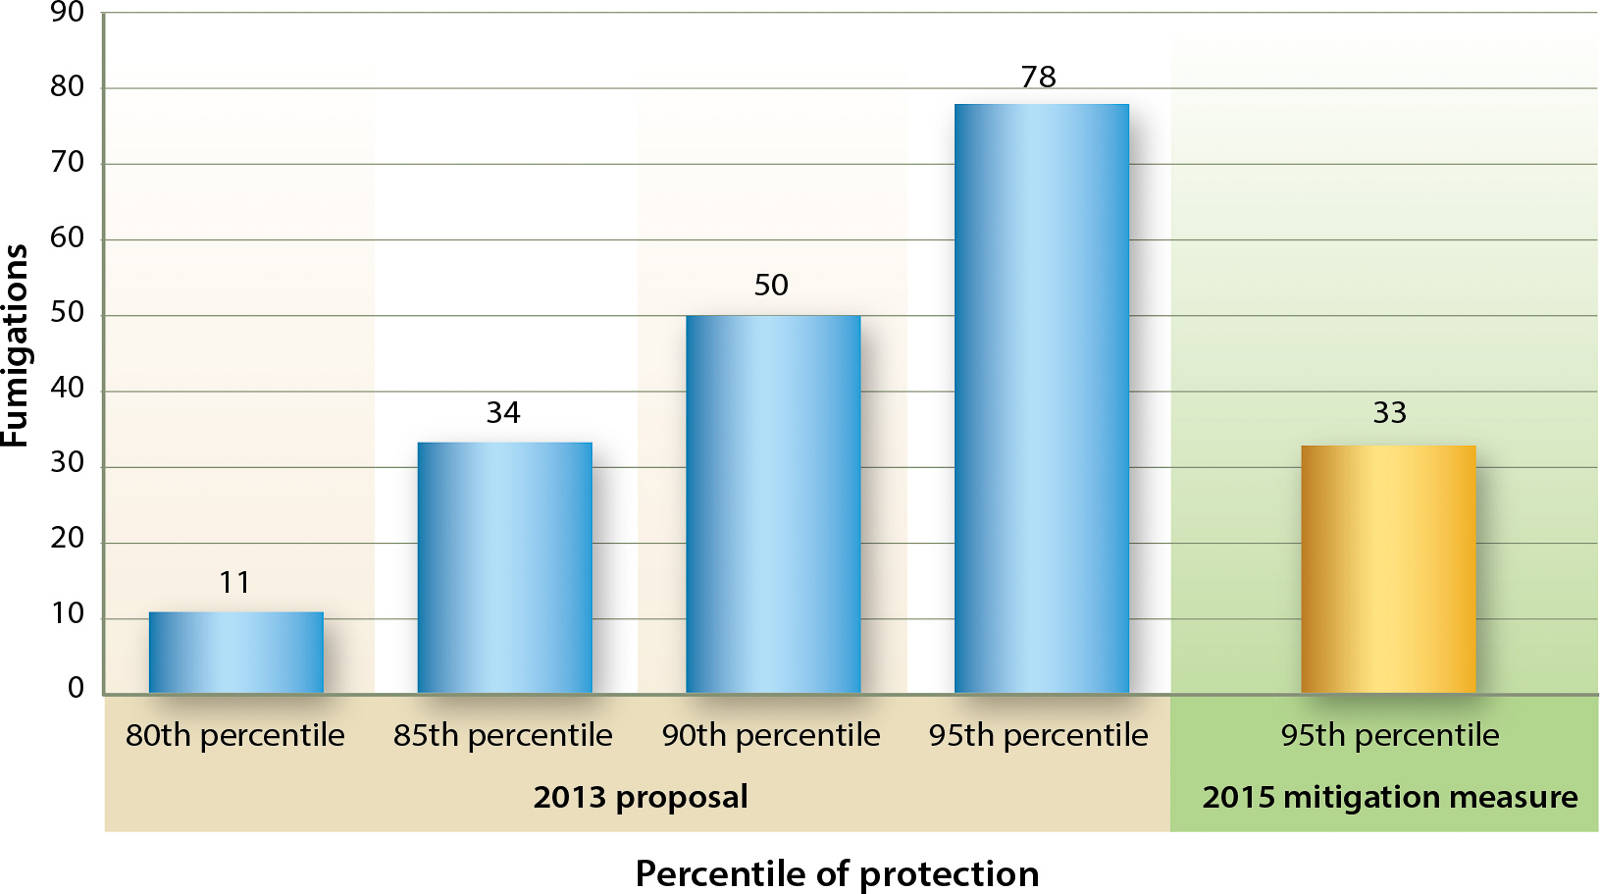
Fig. 3. Number of the 269 Ventura County strawberry fumigation blocks in 2013 that would have sustained an increase in buffer zone distance if the DPR 2013 proposed or 2015 mitigation measures had been in effect, by percentile of protection.
For each fumigated block, we calculated the increase in buffer zone acreage by comparing the actual buffer zone acreage derived from the 2013 NOIs to the buffer zone acreage that would have resulted under the proposed and implemented mitigation control measures. Table 4 summarizes the results. There were 1,634 acres in buffer zones in the applications reported in the 2013 NOIs. Some applications using other tarp would have sustained increases in buffer zone acreage. The estimated additional 33 total acres that would have been required at the 80th percentile of the 2013 DPR proposal represents a 2% increase in total buffer zone acreage. The impact rises steeply across percentiles of protection. The additional 5,214 acres that would have been needed for buffers at the 95th percentile is a 319% increase over the actual 2013 buffer zone acreage. The DPR 2015 mitigation measures results in a considerably smaller increase in acres in buffers: 21%. Critically, not all of the additional buffer zone acreage will displace acres treated with preplant soil fumigation for strawberry production because of the ability to extend the buffer zone further outside the fumigation block in most cases.
Treated acreage effects
To estimate the effect of increases in buffer zone distances on treated strawberry acres, we examined the maps for the 30 fumigations that would have faced some limitations to expanding the buffer outside the field. In each case, using the percentage of the perimeter that could not expand, we estimated the loss in treated acres due to the buffer zone distance extending into the field.
In terms of the loss in treated acres across all the fumigations, not just the 30 most impacted ones, under the DPR 2013 proposal, the incremental loss was negligible at the 80th percentile (see table 5), under 0.05% of total acreage (1.43 acres out of 3,645.5 treated acres). It was substantial at the 95th percentile, almost 5% (181 acres). Under the DPR 2015 mitigation measures, the loss was only 0.6% of treated acreage.
For the 30 impacted blocks, however, the average percentage of treated acres lost was obviously significantly higher. Under the proposed mitigation measures at the 80th and 85th percentiles, it was 3% and 5%, respectively. The impacts were much more pronounced at the higher percentiles, with an average of 21.3% of treated acres at the 90th percentile becoming part of the buffer, and 45.2% at the 95th percentile (table 6). Under the DPR 2015 mitigation measures, the affected blocks lost an average of only 10.7% of treated acreage.
Implications, lessons
Recent DPR buffer zone distance requirements for chloropicrin applications would have impacted a few of the strawberry growers in our study much more than the majority of growers, primarily due to the location of their fields and nearby land uses. The heterogeneity of the buffer zone distance requirements across tarp types also would have impacted growers differently: buffer zone distances for 60% tarp are determined by EPA label restrictions and are not affected by the recent DPR requirements; for other tarps, the percentile of protection in the DPR requirements does influence the buffer zone distances, which affect buffer acreage and can affect treated acreage.
An important caution is necessary. Extrapolating values from the results of this case study to infer potential effects for the rest of the strawberry industry, or for other commodities, could be misleading for a number of reasons. First, the NOIs examined here were a subset of NOIs in Ventura County for 2013 resulting from a request for a set of NOIs with applications for which buffer zone distance regulations are likely to have an effect. Fields surrounded completely by other agricultural fields, in contrast, could have no effects of the regulation on fumigation blocks. At the regional level, other strawberry-producing regions differ from Ventura County in several ways, including but not limited to total strawberry acreage, the timing of fumigation, the size distribution of strawberry fields, neighboring land uses, yields and local use permit requirements. Further, our analysis did not consider how the 2013 proposal or 2015 mitigation measures may interact with other regulatory requirements, including DPR's requirements regarding VOC emissions and 1,3-D township caps. Any of these factors could alter acreage effects. Nonetheless, some general lessons can be derived from this case study.
First, when growers have flexibility in terms of altering practices to reduce the impact of buffer zone requirements, they will utilize them based on their field-specific circumstances; hence, mitigation measures should provide opportunities to growers to reduce the impact of those measures. As a result, the mitigation measures will encourage growers to select practices that mitigate health hazards of offsite movement of pesticides without mandating the use of specific practices. For example, the 2013 recommended permit conditions corresponded to extensive use of 60% tarp.
Second, the buffer zone distance is a key driver of the resulting acreage in buffers, dramatically changing affected acreage according to the percentile of protection in the 2013 proposal. Therefore, the science underlying the determination of a buffer zone distance should be carefully evaluated. Importantly, new scientific data resulted in substantial adjustments to buffer zone distances for the 2015 mitigation measures compared to the 2013 proposal at the 95th percentile. Investing in the science underlying regulations should be a priority for policymakers.
Finally, when a buffer zone distance requirement depends on site-specific characteristics, the impacts will be distributed unequally, because some growers can accommodate the buffer zone requirement outside the treated blocks while others cannot. As the buffer zone distance increases, this inequality is magnified. Investing in the information necessary to study the impacts of spatially defined regulations, such as detailed GIS data, should be a priority for policymakers and regulators engaged in developing these regulations.
Citations
Revised chloropicrin use requirements impact strawberry growers unequally

