


All Issues
A qualitative evaluation of UC CalFresh Plan, Shop, Save, Cook curriculum reveals additional outcomes
Publication Information
California Agriculture 70(2):83-88. https://doi.org/10.3733/ca.v070n02p83
Published online April 01, 2016
NALT Keywords
Abstract
UC ANR Cooperative Extension (UCCE) conducted six focus groups in 2013 with CalFresh-eligible adults to determine how to improve the existing evaluation method for the Plan, Shop, Save, Cook nutrition education classes. Focus group participants (n = 54) cited many behavior changes that are captured by the existing method. During the focus groups, changes in cooking practices and types of food purchased emerged as two domains that are not currently captured. A small pilot study conducted on 22 of the 54 focus group participants suggests that using a telephone interview to survey participants is a feasible and practical approach to collect follow-up data on long-term behavior changes. More rigorous follow-up studies may guide the development of policies aimed at increasing diet quality and food security of adult CalFresh participants.
Full text
In 2013, 42% of the poorest American households lacked access to enough food, compared to 14.3% of all American households (Coleman-Jensen et al. 2014). People living in poverty have to make hard choices among basic needs and often run out of money for food before the end of the month. To reduce food insecurity and improve nutrition among low-income families, the U.S. Department of Agriculture (USDA) funds the Supplemental Nutrition Assistance Program (SNAP). As the largest food assistance program in the United States, SNAP served 45,766,672 participants at a cost of $69.7 billion in 2015 (USDA 2016). The 2010 Healthy, Hunger-Free Kids Act provided an additional $407 million in 2015 (SNAP-Ed 2015) for SNAP Education (SNAP-Ed). SNAP-Ed teaches SNAP-enrolled or SNAP-eligible audiences how to make healthy food choices with their food assistance benefits and to adopt physically active lifestyles.
California is home to the largest SNAP program, known as CalFresh. CalFresh reaches about 4.16 million Californians in 1.91 million households each month. The majority of CalFresh recipients are Hispanic (56% Hispanic, 21% white, 13% black, 7% other and 3% mixed race), and most (71.9%) are female-headed households (CDSS 2011). More than half (57%) of CalFresh recipients are children under 18 years old. On average, CalFresh recipients receive $130 a month for groceries. Eligibility is based on having an annual income that does not exceed 200% of the federal poverty level. In California, only 6.2% of CalFresh-eligible households have cash income above the poverty level, compared to 16.6% nationally (Strayer et al. 2012). Due to the recent economic downturn, the percentage of Californians receiving CalFresh rose sharply, from 6% in 2008 to 11% in 2013 (Danielson 2014).

CalFresh, California's SNAP program, reaches over 4 million people each month.
History of UC CalFresh
UC Davis is one of several organizations that subcontract with the California Department of Social Services to deliver the SNAP-Ed program. The program was known as the UC Food Stamp Nutrition Education Program (FSNEP) when it began in 1994 but changed its name to UC CalFresh Nutrition Education Program (UC CalFresh) in 2012. Today, UC ANR Cooperative Extension (UCCE) delivers adult, family-centered and youth UC CalFresh programs in schools and other community settings in 31 counties. In 2013, the program reached 120,449 participants directly through classes and an additional 478,975 CalFresh-eligible Californians through indirect nutrition education in venues such as health fairs, farmers markets and back-to-school nights.
Historically, UCCE nutrition education to low-income audiences has included one lesson on food resource management practices, including budgeting, meal planning and smart shopping (e.g., comparing unit prices, using coupons, etc.), as part of the eight-lesson curriculum Eating Smart Being Active (extension.colostate.edu/topic-areas/nutrition-food-safety-health/eating-smart-%E2%80%A2-being-active). When household food insecurity rates escalated during the 2007 recession, UCCE nutrition advisors identified the need for greater emphasis on building food resource management skills in UC CalFresh audiences. In 2011, UCCE nutrition advisors developed a four-lesson series called Plan, Shop, Save, Cook (PSSC), which was adapted from a single lesson in Eating Smart Being Active. During each one-hour lesson, participants practice skills and discuss ways to help them eat healthier on limited budgets. Activities include planning healthy meals, writing a shopping list, reading food labels, using unit pricing to choose the lowest cost product, watching a cooking demonstration and tasting easy-to-prepare, low-cost, healthy recipes. (For details on the PSSC curriculum, please contact the UC CalFresh state office at uccalfresh_support@ucdavis.edu.)
Statewide evaluation of PSSC
To evaluate PSSC, UCCE nutrition advisors developed a seven-item evaluation tool (ucanr.edu/u.cfm?id=138 ) to measure the frequency of planning meals, shopping with a list, comparing unit prices, reading food labels, thinking about healthy food choices, eating a variety of foods and, as a measure of food insecurity, running out of food before the end of the month. All items have a 5-option Likert-type response: 1 = never; 2 = seldom; 3 = sometimes; 4 = most of the time; and 5 = always. These items were chosen because previous research has reported significant associations between several of them and diet quality (Hersey et al. 2001). Moreover, they are used nationally to evaluate similar nutrition education classes offered through the Expanded Food and Nutrition Education Program, a program funded by the USDA to reach low-income families with children (EFNEP; Dollahite et al. 2014).
During fiscal year 2012–2013, 22 counties collected complete pre-post surveys from 2,371 participants in the PSSC series. Of these participants, 66% were Latino and 73% were female (table 1). More than half (54%) were currently enrolled in the SNAP program, and the rest were income-eligible but not enrolled. Statewide program evaluation data covering the period from 2011 to 2013 found significant pre-post changes in the frequency of food resource management behaviors (Kaiser et al. 2015). The percentage of PSSC participants who reported performing these behaviors more often after the PSSC series ranged from 38.8% in comparing prices to 54.0% in reading nutrition labels. The group who reported the greatest reduction in the frequency of running out of food before the end of the month were those PSSC participants who currently received SNAP benefits and who reported the greatest pre-post change in food management skills.
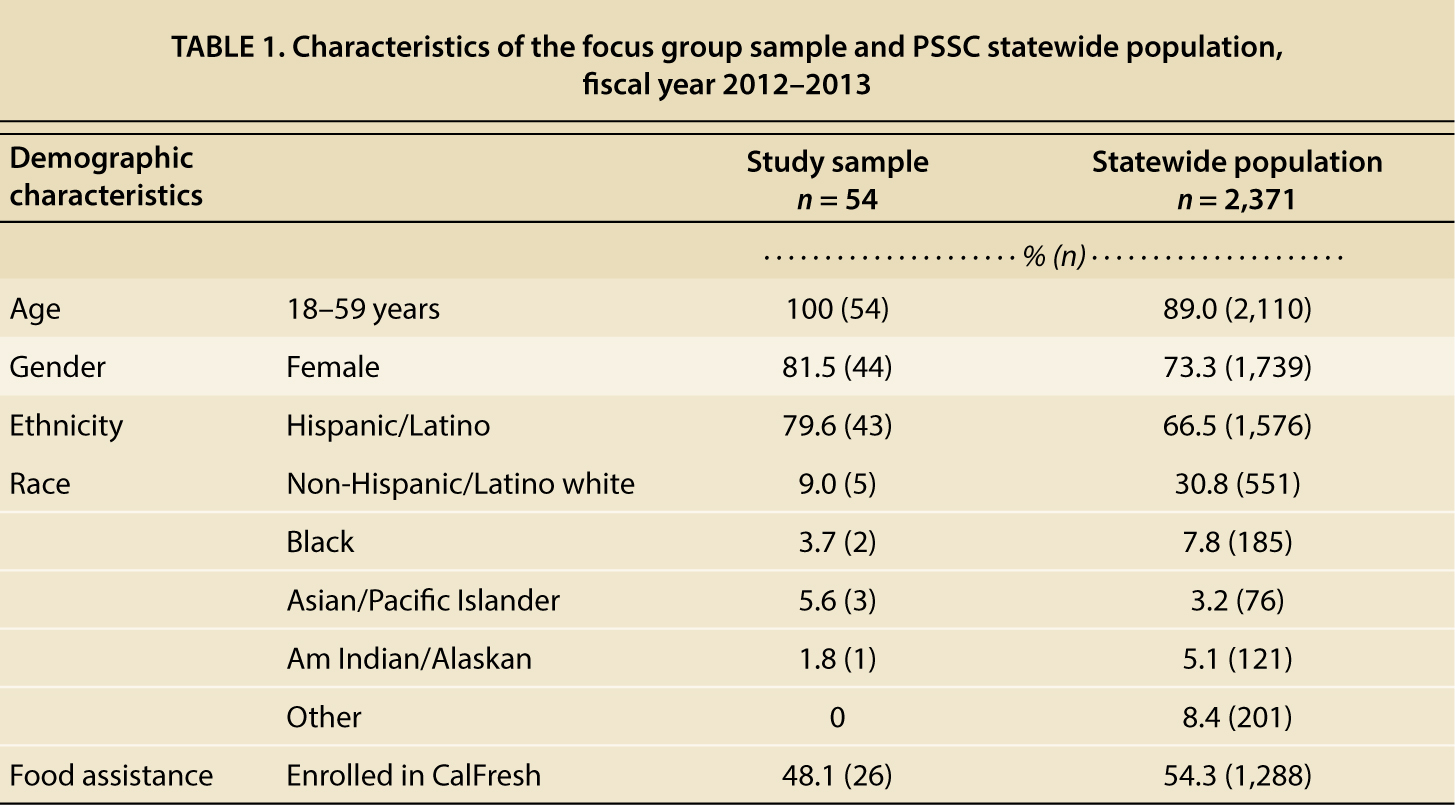
TABLE 1. Characteristics of the focus group sample and PSSC statewide population, fiscal year 2012–2013
Need for a qualitative evaluation
Given the federal debate on reducing SNAP funding and increasing emphasis on evidence-based SNAP-Ed, UC CalFresh must demonstrate a positive impact on CalFresh recipients’ food management behaviors. The existing seven-item PSSC evaluation tool only measures pre-post changes in seven behaviors over a one-month period. As a result, there may be additional outcomes that are not captured using this evaluation approach. The study's objective was to determine how PSSC evaluation methods might be improved to capture program outcomes more fully. This paper explores the following questions: (1) What behavioral changes do PSSC participants cite, in addition to those currently measured with the existing evaluation tool? and (2) What is the feasibility of tracking behavioral changes beyond a one-month follow-up period?
Focus group structure
To answer these questions, UC CalFresh conducted six focus groups among PSSC participants in the spring and fall of 2013 in San Joaquin, San Mateo and Santa Clara counties. Selection criteria for the counties were as follows: expressing interest in hosting PSSC focus groups, using the PSSC curriculum as designed, having rural and urban sites and being able to convene both English- and Spanish-speaking groups.
The UC CalFresh state office hosted a webinar for county staff with an overview of focus group methodology and specific expectations for a county's role in conducting the focus groups. The state office sent each county a packet with recruitment guidelines, a script and a demographic survey. The UC Davis Institutional Review Board determined the protocol to be exempt from full review.
A UCCE nutrition specialist (fluent in Spanish) and a UC CalFresh state office staff member moderated focus group discussions — one in Spanish and one in English — in each of the three counties. Each county provided a staff member to take notes. All discussions took place immediately after the fourth and last PSSC class. Participants completed a seven-item PSSC evaluation tool before lesson one (pre-test) and at the end of lesson four (post-test), just before starting the focus group discussion. The researchers informed participants that their decision to stay for the discussion was voluntary, and all agreed to participate.
During the focus groups, the moderators asked participants why they decided to attend PSSC classes, what they had learned, how they had applied the information and what areas can be added or improved for future classes. Each focus group lasted about one hour and was au-diotaped. Participants received an incentive, typically a cookbook, for their time.
Student assistants transcribed and/or translated the audiotapes. The two moderators examined the final versions for main themes and conferred with co-authors for interpretation. One moderator used NVIVO 10 software (QSR International, Burlington, MA, 1999–2012) with the coding query function to establish thematic areas and cross-tabulate themes with PSSC terms.
Focus group participants
Fifty-four PSSC participants attended the focus groups in San Joaquin, San Mateo and Santa Clara counties. Table 1 compares the demographic data of the focus group sample (n = 54) to the statewide PSSC population served in 2012–2013. The study sample and statewide populations were predominantly female (81.5% study population versus 73.3% statewide population), of Hispanic ethnicity (79.6% versus 66.5%) and between 18 and 59 years old (100% versus 89.0%). Two participants from Spanish-speaking groups and two from English-speaking groups did not complete all of the PSSC lessons, each missing one to two lessons.
What participants learned
In explaining why they attended PSSC classes, participants commonly mentioned health-related reasons, although a few also cited a desire to be more organized and save money. Many wanted to learn how to prepare healthier meals to improve existing health conditions or prevent the onset of new problems, particularly diabetes. One Santa Clara County attendee stated that coming to class was important “… because in my family, we have diabetes and there are some that are overweight and this is what we want to improve, so we can be healthier.” Participants repeatedly talked about wanting to learn healthy ways to lose weight and have a more balanced diet for their families. They also wanted to learn how to shop for healthy foods on a limited budget.
Many mentioned that the classes helped them refine their nutrition knowledge and decision-making skills. Participants most commonly mentioned having a greater awareness of healthy food choices and tools to choose nutritious foods, plan meals and save money. They felt that the ability to read Nutrition Facts labels would help them select healthy foods. They also gained useful information on writing and “sticking to” a grocery list, using coupons and watching portion sizes.

In Plan, Shop, Save, Cook nutrition education classes, participants learn how to compare unit prices and monitor spending while shopping.
Participants reported that they learned how to compare unit prices and recognize the influence of branding on food prices. One San Mateo County attendee told facilitators that “after taking this nutrition class, I would first look at planning cooking, plan out what I would buy, and see if I could get the best economic buy”. When asked what she had learned about shopping, a Spanish-speaking woman stated, “that the (name) brand costs more … but it's the same thing [as the generic product]”.
Focus group participants also mentioned that they learned about using healthier oils in food preparation, steaming and baking rather than frying, incorporating vegetables and fruit into the daily diet, measuring ingredients and using seasoning to improve food taste without adding salt. Comments on cooking included “I have learned that we shouldn't cook with so much oil … what the right portion of oil one should use is …”, “at the house lettuce and broccoli was almost never eaten … and I am adding lettuce and broccoli, celery, cauliflower … and (using) other recipes” and “My cooking skill level was the microwave … and now I'm gonna probably steam a fish or something ….”
The moderators asked participants to think about “what they had in their kitchen today” and whether they had changed the foods they buy after attending the classes. Participants mentioned changes in eating habits, purchasing a greater variety of fruits and vegetables, including more legumes (peas, beans, lentils), buying less soda, consuming more water and switching to healthier types of oils (canola or olive). A few reported purchasing more fish and chicken and less red meat or pork.
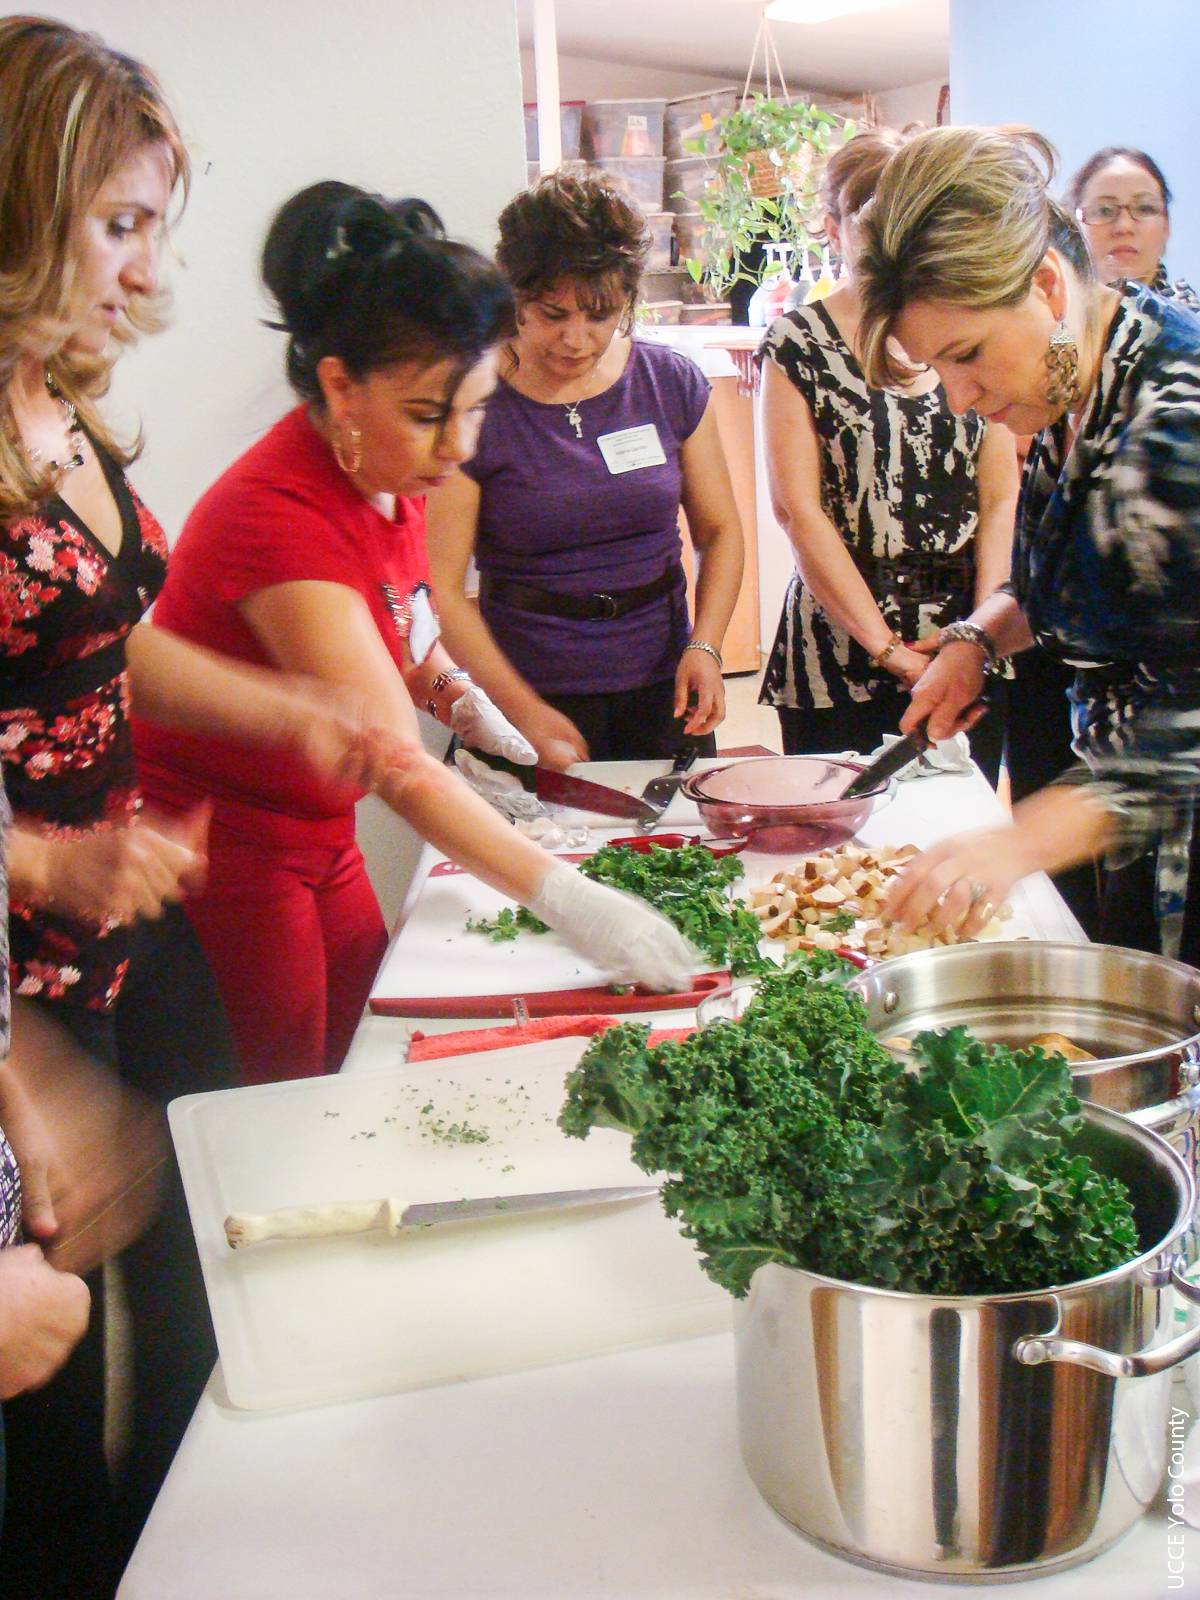
Plan, Shop, Save, Cook lessons include a cooking demonstration and feature healthy, low-cost recipes that are easy to prepare.
Attendees stressed that by learning food resource management skills rather than just buying what looked good, they assessed food choices and “looked at foods differently now”. One San Joaquin County participant stated, “I never did plan ahead of time. I always came home and was just asking, ‘what am I going to make?’ Incorporating all the food groups, whether it is on one plate or throughout the day and then portion control … having the plate [MyPlate, a USDA info-graphic depicting the five food groups] on your fridge really helps.”
The focus groups also discussed topics to include in future classes. Attendees suggested including more recipes and food preparation tips, recipes for children, and materials on food safety and vitamin content in foods. Participants also wanted more information on how food affects the body and how to incorporate more exercise into their daily schedule.
At the end of the focus group sessions, attendees were asked to name the most important tip from the PSSC lessons that they would use regularly. Overall, they recalled several tips, including reading nutrition labels, choosing smaller portions, using a calculator while shopping to monitor spending, looking at expiration dates, planning meals and using a grocery list. Some emphasized the importance of eating healthier through changing food selection, purchasing and eating habits. Participants also mentioned incorporating a variety of food groups for “balanced” meals and “watching” sugar, sodium and fat content.
Long-term follow-up
To explore the feasibility of administering a longer-term follow-up to evaluate behavior change, UC CalFresh county staff interviewed participants by phone from one to six months after the focus groups using the same seven-item tool. Complete follow-up data was available for 22 of the 54 focus group participants. Beyond one month after the last classes, 32 participants were no longer at their phone numbers and/or could not be reached by email addresses. Those who were interviewed said they made changes in food consumption and preparation techniques, in addition to improving their food resource management skills. For example, four months after the last PSSC class, a San Mateo County man stated, “I never did any of the above before the workshops. I would just buy food but did not look at labels …. I'm taking it seriously now. I don't feel sluggish anymore — now I have a lot more energy.” Preliminary results suggest that further study is warranted to see if participant behavior changes are sustained or improved over time. Ideally, this would be a study with a large sample size and a comparison, or control, group.
Discussion and implications
Results indicate that PSSC participants cite many attitudinal and behavior changes that are consistent with those measured using the existing evaluation tool, such as greater awareness of healthy food choices and reading the Nutrition Facts label (table 2). The statewide evaluation identified reading Nutrition Facts labels as the behavior showing the most improvement (Kaiser et al. 2015).

Two areas were identified that are not captured by the current tool: changes in cooking practices and the types of food purchased. Both of these areas may influence diet quality. To capture these changes, additional questions could be added to the PSSC evaluation tool to ask about use of healthier cooking methods (such as steaming or baking rather than frying) and purchase of healthier options (such as fish, poultry or beans rather than red meat).
The longer-term benefits of food resource management education have been documented in a recent randomized, delayed controlled study conducted in an EFNEP population in New York where the Eating Smart Being Active curriculum was delivered (Dollahite et al. 2014). Designing a SNAP-Ed program evaluation that captures additional dietary behaviors with a longer follow-up time can help inform the development of policies aimed at improving diet quality and food security. While research documents the beneficial effect of SNAP on food security (Nord 2012), the program's impact on diet quality is modest at best (Gregory et al. 2013). To address the dual SNAP mandate of promoting food security and diet quality, several policy options can be assessed, including incentives such as farmers’ market vouchers to purchase more fruits and vegetables, restrictions on foods and beverages allowable for purchase, increased frequency of issuing SNAP benefits and improvement in the retail environment (Leung et al. 2013). Experts also agree that more effective nutrition education might be another strategy, but call for more research on the effect of SNAP-Ed on participants’ diet quality.
Several challenges and limitations to this study should be mentioned. First, members of our target audience tend to have more transient housing situations than the general population, which poses problems in conducting follow-up interviews. In this instance, the follow-up phone calls, taking place one to six months later, could not locate many participants who were no longer at the phone number and/or email addresses they provided when the focus groups were conducted. Second, the sites where the focus group meetings occurred (the same location as the classes) often introduced noise and interruptions, which disrupted the meetings, hampered a thorough probing of the questions and hindered a clear audiotape. Finally, some focus group participants were enrolled in job training or health-related programs or did not complete all lessons, both of which may have influenced their responses.
Nonetheless, the study's qualitative findings suggest that PSSC participants learned to make healthier food choices at the store and change some cooking practices at home. While adding one or two more questions about these skills to the current evaluation tool is an option, ultimately a randomized study, possibly with a delayed control design, needs to examine the effect of building food resource management skills on food security and diet quality in SNAP audiences. Loyalty cards or other methods can be used to determine the effects of PSSC and similar curricula on food purchases of SNAP participants targeted in healthy retail environment interventions (e.g., instore marketing such as expanded shelf space and/or signage to promote healthy foods).
A qualitative evaluation of UC CalFresh Plan, Shop, Save, Cook curriculum reveals additional outcomes

