


All Issues
Modeling the effects of local climate change on crop acreage
Publication Information
California Agriculture 70(1):9-14. https://doi.org/10.3733/ca.v070n01p9
Published online January 01, 2016
NALT Keywords
Abstract
The impacts of climate change on agriculture depend on local conditions and crops grown. For instance, warmer winter temperatures in a given area would reduce chill hours, potentially cutting yields for some crops but extending the growing season for others. Using a century of climate data and six decades of acreage data, we established quantitative economic relationships between the evolution of local climate and acreage of 12 important crops in Yolo County. We then used the historical trend in climate change to project future crop acreages in the county. Only marginal changes in acreage in 2050 were projected for tree and vine crops there, in part because chill hours, although lower, remained above critical values. Walnuts were the most vulnerable tree crop, and the projections indicated some cultivars might be marginal in years with particularly warm winters. Processing tomato acreage might increase, due to a longer growing season, and also alfalfa acreage, if water availability and other factors remain constant.
Full text
Climate change is a global phenomenon, with global-scale market impacts. However, the impacts of climate change on agriculture in a given region are also determined by local climate parameters such as temperature and precipitation, as well as by the local geography and mix of crops.
In this study, using 105 years of local climate data and 60 years of local crop acreage information, we investigated, in the context of underlying economic forces, how growers in Yolo County have responded to past climate change. Our goal was to uncover statistical relationships between climate change and changes in crop acreage patterns (based on historical data) that will in turn help us to understand how growers may respond to climate change in the future.

A walnut orchard near Winters. If the current trend of warmer winters continues in Yolo County, chill hours may be insufficient for many walnut varieties by the year 2100.
Crop agriculture in Yolo County
Yolo County is in the northern Central Valley. The county has small urban areas, but agriculture, with its 368,000 acres of farmland, is significant to the county economy. Agriculture generated farm revenue of $721 million in 2013, with crops accounting for 95% of that amount (fig. 1).
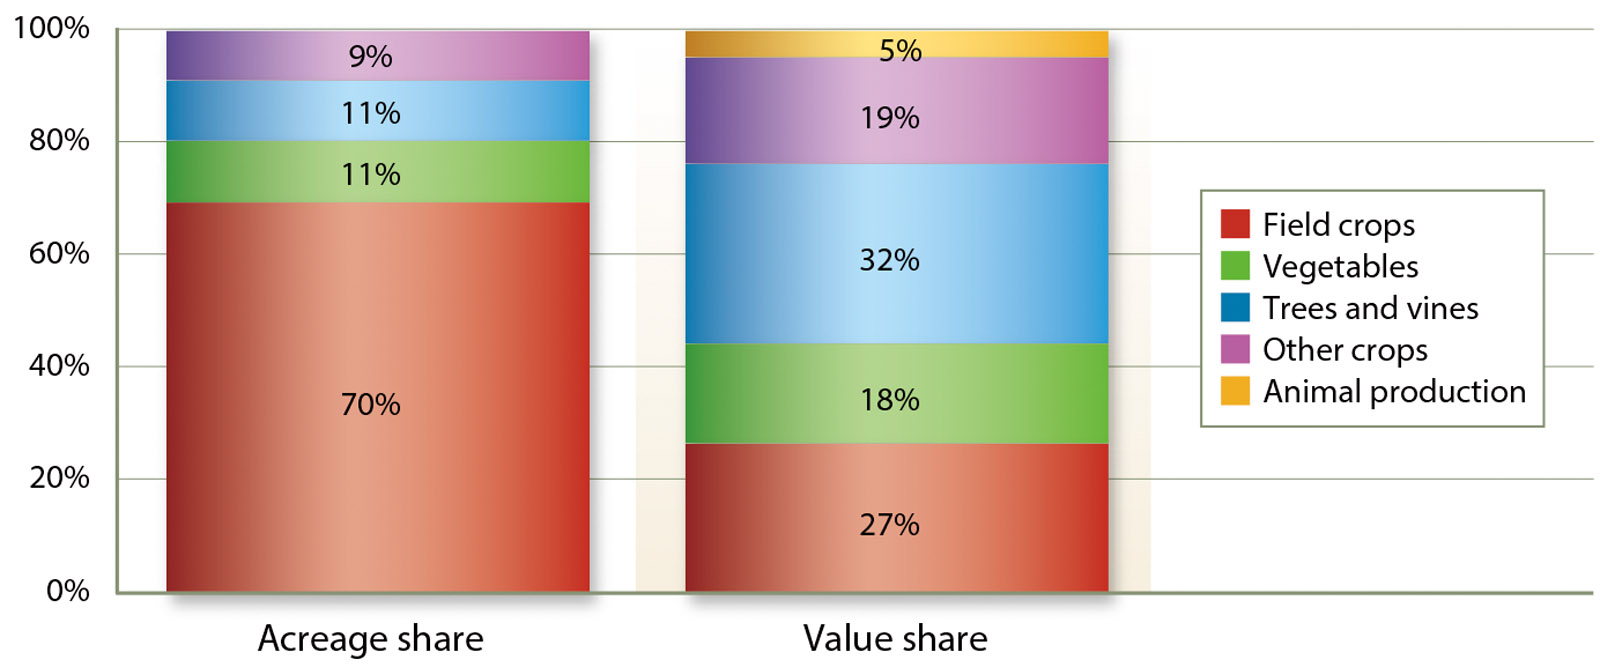
Fig. 1. Yolo County agriculture in 2013, showing acreage share and value share by commodity category. Shares are calculated based on total areage, 368,000 acres, and total value, $721 million. Field crop acreage does not include nonirrigated (dry) pasture land. “Other crops” includes organic crops, nursery products and seed crops. Source: 2013 Yolo County Agricultural Crop Report.
The cropland, almost all irrigated, is devoted to a wide variety of crops, including tree and vine crops such as almonds, grapes and walnuts, annual crops such as processing tomatoes, and field crops with differing seasonal cycles such as alfalfa, rice and winter wheat. Although total crop acreage is dominated by field crops, revenue shares are more evenly distributed among field crops, tree and vine crops, and vegetables (fig. 1). The distribution of acreage within these categories has shifted over time; for example, apricots and plums, which were important in Yolo County in the past, have been replaced by wine grapes, almonds and walnuts; and barley, once a major field crop, has virtually disappeared. Wheat acreage has also declined. Processing tomatoes acreage continues to be significant, accounting for 90% of vegetable acreage.
Climate history in Yolo County
Figure 2 shows the climate trends for Yolo County from 1909 to 2013, based on daily minimum and maximum temperatures at the Davis weather station available from the National Oceanic and Atmospheric Administration (NOAA 2014). Annual average temperatures document an unmistakable long-term warming trend (fig. 2A). Monthly average minimum temperatures are unambiguously increasing for both January and July (fig. 2B), with January temperatures increasing at more than double the rate of July temperatures. Perhaps surprisingly, monthly average maximum temperatures are declining for July and roughly constant for January. That is, overall climate warming is evidenced by rising minimum temperatures, with a marked increase in winter. Similar findings are reported for California more broadly by Bar-Am (2009), who found winter average minimum temperatures increasing in wine grape regions.
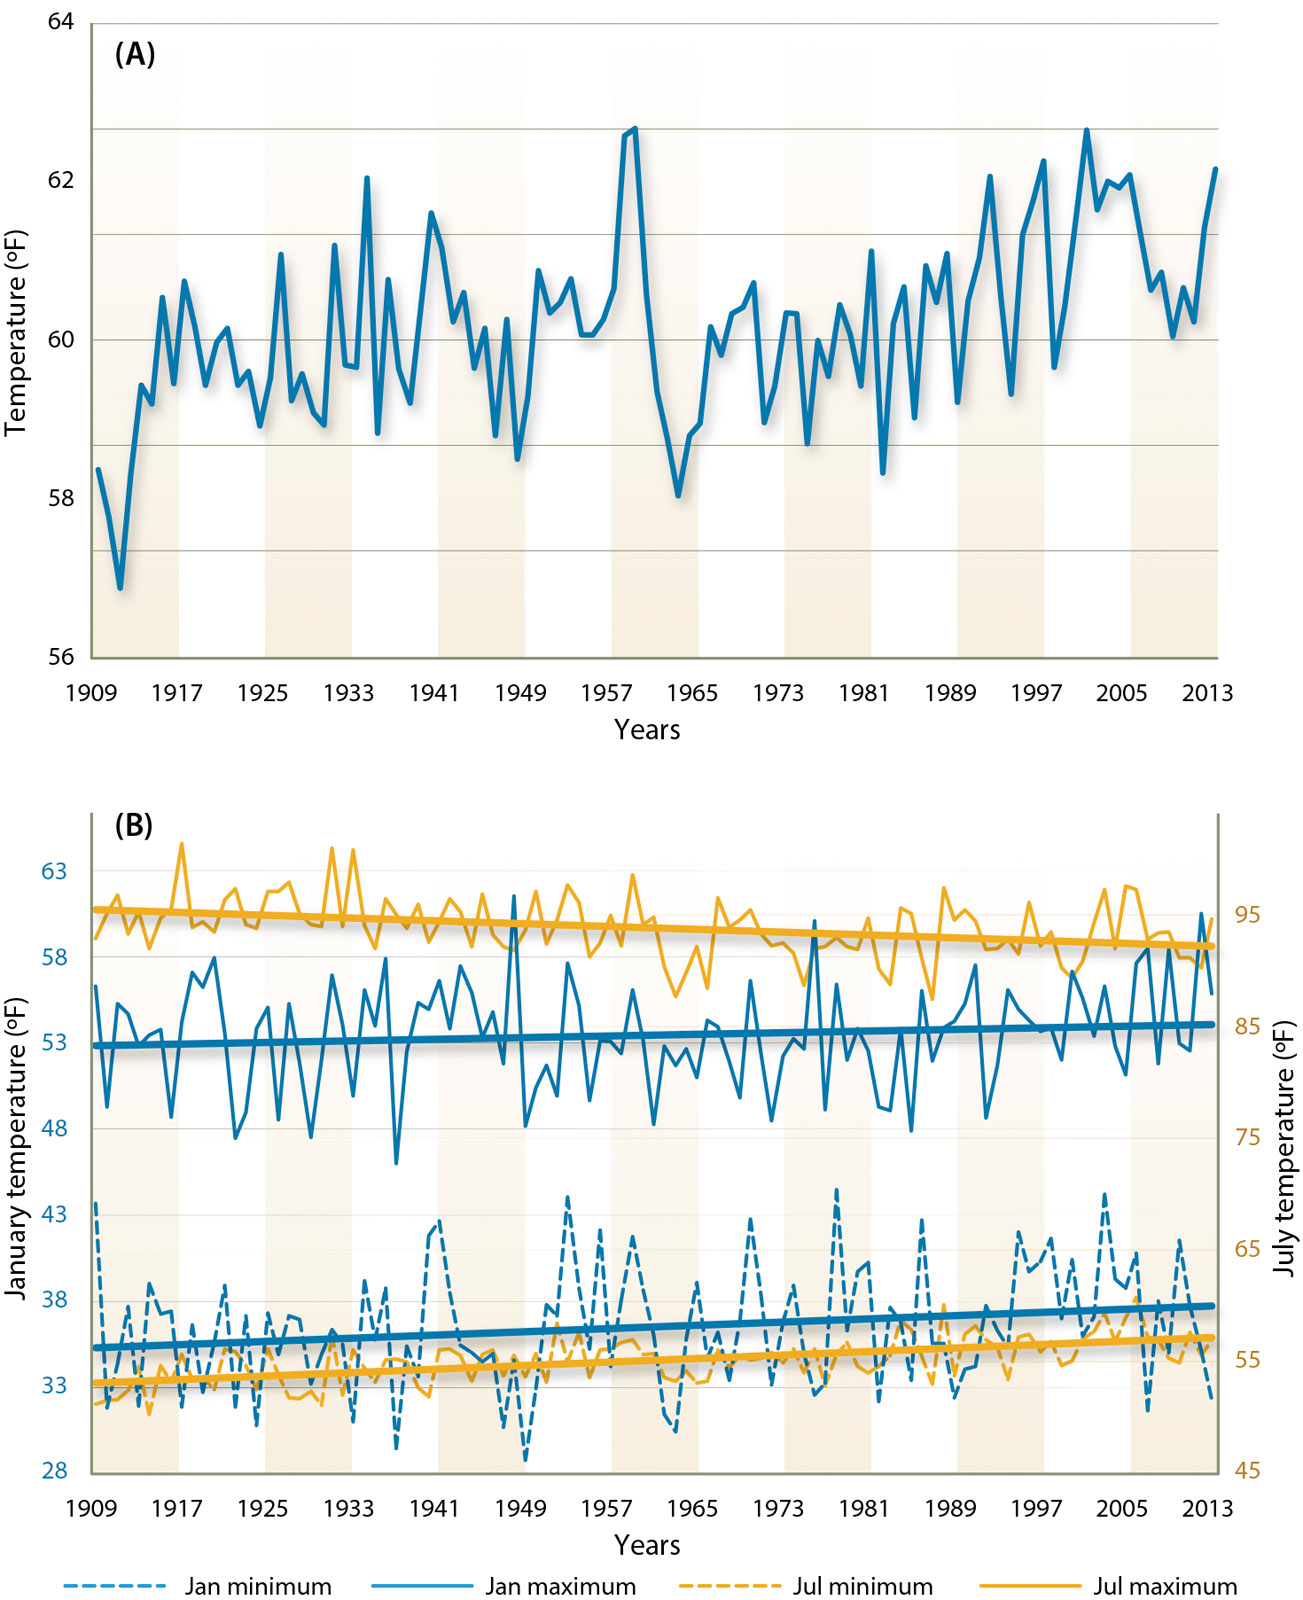
Fig. 2. Historical temperatures in Yolo County, California, 1909 to 2013, showing (A) annual average temperatures and (B) monthly average minimum and maximum temperatures for January and July. Both are derived from daily minimum and maximum temperatures.
Calculating climate indexes
The climate indexes we use in this study are growing degree days and chill hours, which are commonly used as measures of accumulation for heat and chill, respectively. Two immediate implications of the observed pattern of climate warming for crop agriculture are a decline in chill hours, which are crucial for deciduous trees and vines, and longer growing seasons for many annual crops. Changes in the duration of a growing season can be quantified by growing degree-days (GDD), which measures heat accumulation based on daily air temperature. Chill hours are the number of hours below a certain temperature in wintertime. Insufficient winter chill provides inadequate physiological stimulation to renew growth, causing a delay in the opening of leaf and flower buds. This leads to excessive shedding of flower buds or smaller blossoms, resulting in reduced fruit yield.
As convenient summary measures, annual GDD and chill hours were used to characterize agriculturally relevant climate warming changes in the Yolo County temperature data. Other climate measures such as occurrence and duration of extreme events like periods of heavy rainfall or extreme heat may also be important to crop viability, but were left for further research.
GDD is calculated as the difference, for a given day, between the daily average temperature and a lower-bound temperature below which plant growth is impaired. The daily average is also bounded by a temperature above which photosynthetic function is reduced. This study sets these two bounding temperatures at 46.4°F and 89.6°F, following Deschenes and Greenstone (2007). Thus, a daily mean temperature below 46.4°F or above 89.6°F registers as zero GDD. Annual GDD is the sum of daily GDD for the relevant growth period.
Chill hours are the number of hours below a critical temperature — most commonly 45°F (Aron 1983). A chill hours calculation requires data on hourly temperatures, but hourly temperature data was unavailable, so we approximated chill hours as a function of daily minimum and maximum temperatures, following Baldocchi and Wong (2008). Their approach assumes that temperature changes over a 24-hour period are gradual, and bounded by the daily maximum and minimum temperatures, with a linear process in which the daily temperature declines to the minimum, rises to the maximum and declines again to the minimum the next day. Assuming this process of daily temperature change, we estimated the daily chill hours. We calculated annual chill hours as the sum of chill hours during November through February, which is the usual dormant season for California's tree and vine crops.
In this study, we calculated two different GDDs, each representing a different growth period. The first growth period was from April 1 to August 31, for summer-harvested (or spring-planted) crops, denoted as GDDsummer. The second growth period was from November 1 to May 31 for spring-harvested (or late fall–or winter-planted) crops such as fall-sown hard red wheat, denoted as GDDwinter. Both summer and winter GDDs have increased over the last century, from 3,233 to 3,509 for GDDsummer and from 1,383 to 1,754 for GDDwinter, measured on the linear trend lines (fig. 3A). GDDwinter increased by about 0.26% per year, more than three times the rate (0.08%) observed for GDDsummer. Our finding of the more rapid increase in GDDwinter is especially noteworthy. In California, the amount of warmth measured by GDD is rarely a limiting factor for summer crops. However, an increase in GDDwinter likely results in positive winter growth.
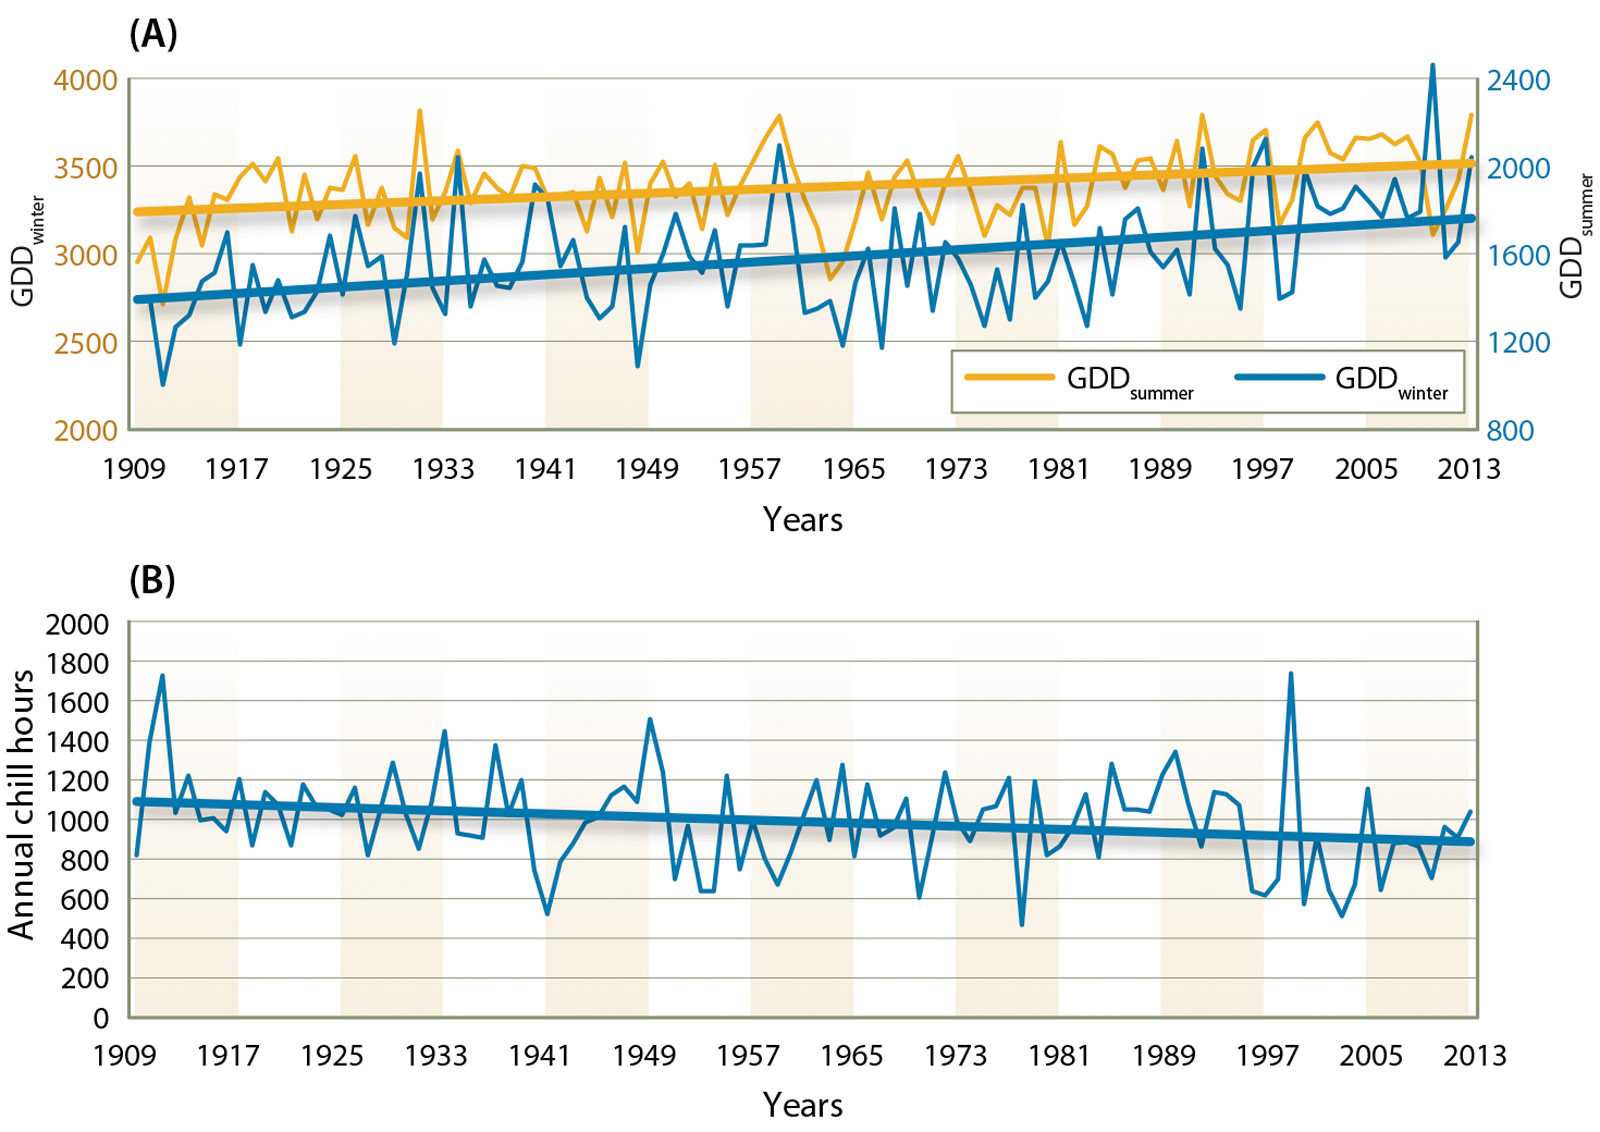
Fig. 3. Historical growing degree-days (GDD) (A) and chill hours (B) in Yolo County, 1909 to 2013. In (A) the GDDsummer period is April through August and the GDDwinter period is November through May. In (B) the annual chill hours were accumulated during November–February. Note that GDDwinter and chill hours span two consecutive calendar years: for example, for chill hours, the total for a winter includes the chill hours in November and December of one year and the chill hours in January and February of the following year. We report the total for each winter under the year that begins with January of that winter.
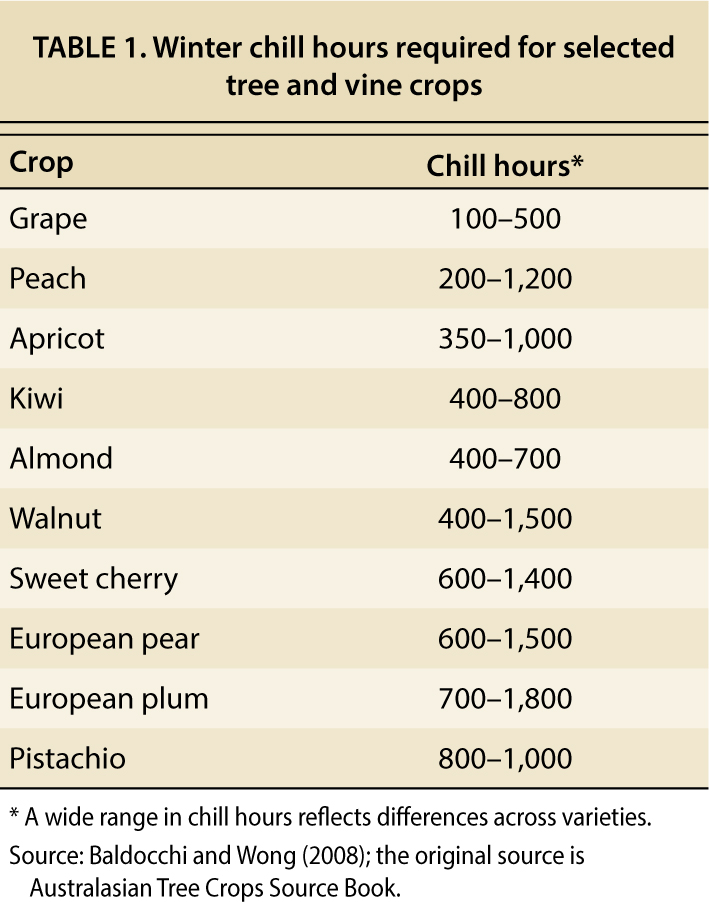
Estimated chill hours have fallen by about 2 hours per year over the last 105 years (fig. 3B). Though varying in magnitude, the declining trend in chill hours is also found in other studies (Luedeling et al. 2009). The importance of chill hour declines depends on the chill requirements of the crops grown (see table 1). The current trend of chill hours reduction does not indicate major concerns for grapes or almonds, but chill hours could become binding for walnuts — these three crops account for more than 90% of tree and vine acreage in Yolo County.
If the present trend continues, chill hours would fall from the current trend value of 882 hours to a trend value of 712 hours by the end of the present century. Thus, by 2100 many varieties of walnuts would have insufficient chill hours in years with average weather, and severely insufficient chill hours in some years with usually warm winters, which would mean lower yields. Likely responses by growers would be either to shift away from walnuts, or to shift to walnut cultivars that require fewer chill hours.
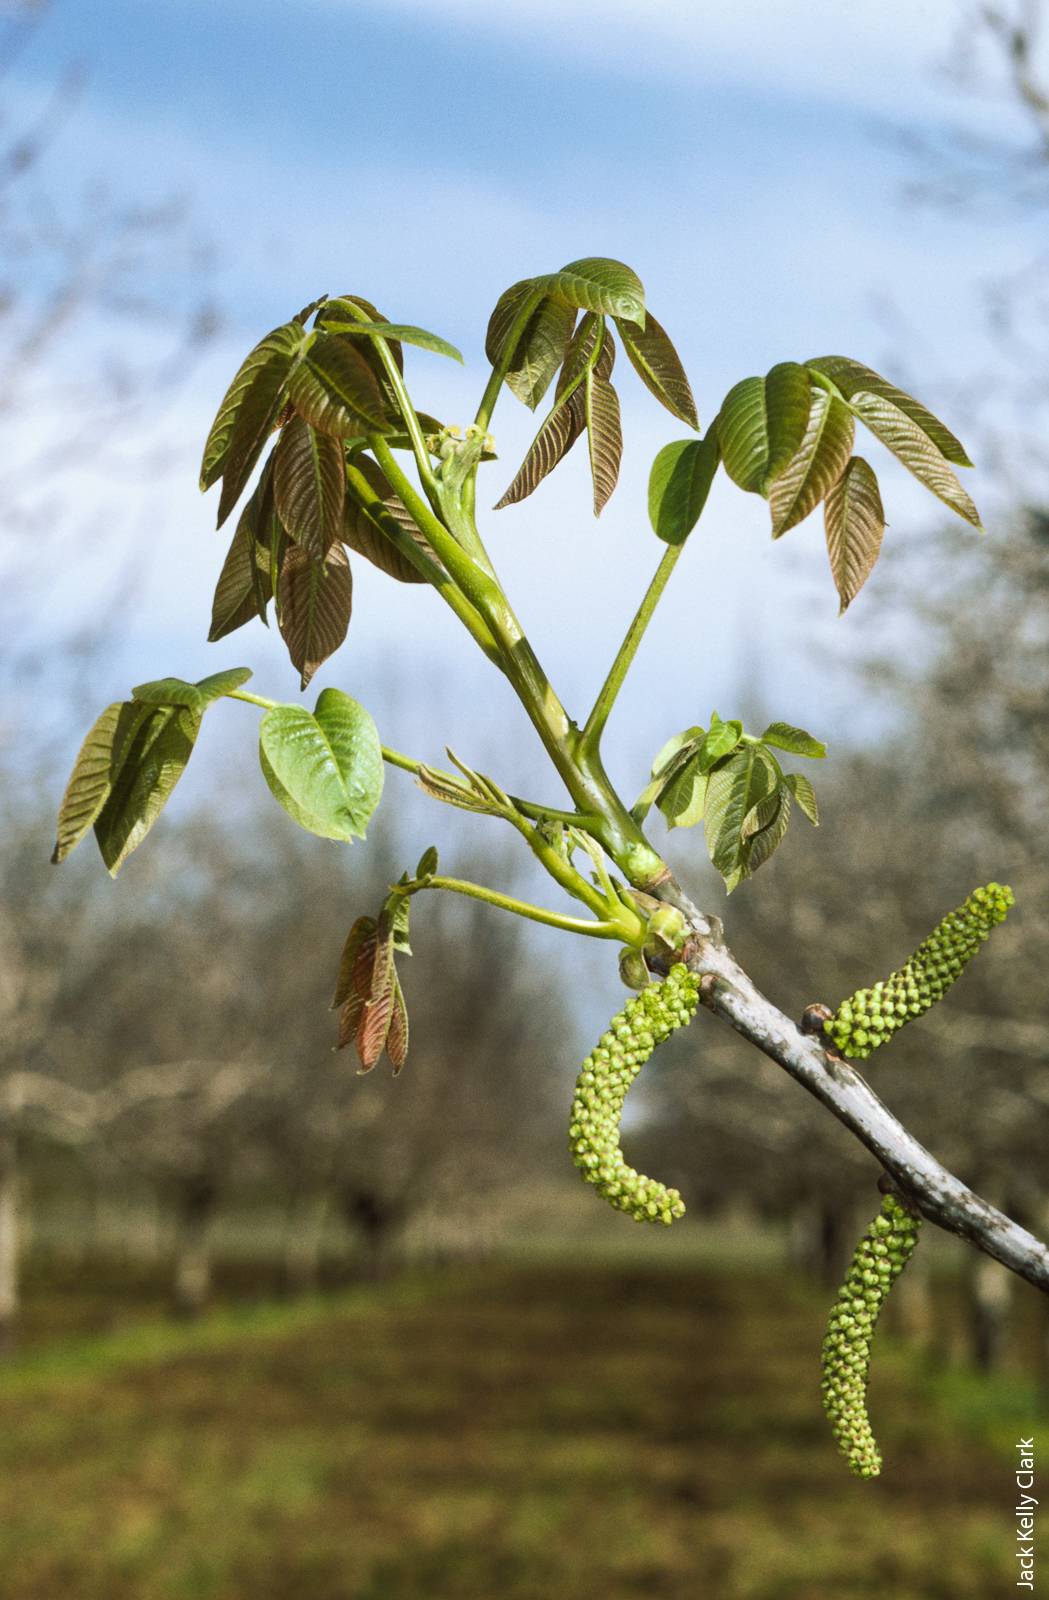
Insufficient chill hours can cause a delay in the opening of leaf and flower buds in crops such as walnuts, which may result in reduced fruit yield.
The Chandler walnut cultivar, for example, which is common in Yolo County (UCCE 2012), requires a chilling portion of 45 to 50 (UCD 2015), which converts to 549 to 690 chill hours, using a conversion rate of 13 ± 0.8 (Luedeling and Brown 2011). In years in which chill hours fall below the current trend of decline (due to climate variability), or if the reduction in chill hours occurs at an accelerated rate, even Chandler walnuts could have insufficient chill hours.
Climate–acreage relationships
The economic reasoning relating climate to growers’ acreage decisions is straightforward. Change in climate affects expected crop productivity and profit and therefore growers’ choices about allocating crop acreage. For annual crops, current climate is most relevant. For tree and vine crops, the climate prospects over longer decision horizons are relevant. To quantitatively investigate climate–acreage relationships, we developed statistical models that specify crop acreages as functions of many economically relevant variables, including climate variables. The models allow us to isolate the effects of climate change on acreage, while statistically controlling for other relevant factors.
Equations.
We specified an equation to characterize the planting for each of the 12 crops that have significant acreage in Yolo County currently (see table 2). Each of the 12 equations describes acreage of a specific crop as a linear function of variables relevant to the acreage decision of that crop. We assume that acreage decisions are guided by variables representing four broad categories: market conditions, water availability, agronomic practices (such as crop rotations) and climate. General description of the variables in each category is provided below. Detailed information about the specification of our regression equations can be found in Jackson et al. (2012) and Lee and Sumner (2015); this study uses improved and updated time series of the relevant data but the same equation specifications reported there.

TABLE 2. Model results: Yolo County crop acreage response to changes in crop price (implied price elasticity) and climate indices
Explanatory variables and data.
Market conditions are represented by the expected product price for each crop and prices of crops that are considered substitutes in the planting decision. To represent current price expectations, we used one-period lagged prices for most field crops and other annual crops. For tree and vine crops, we used moving averages of multiple lagged prices.
Irrigation water supply is represented by previous years’ precipitation, because replenishing sources of irrigation water often takes multiple years. We did not directly incorporate non-surface water such as groundwater or water transfers, but note that water transfers and groundwater access in Yolo County are influenced by availability of surface water.
Crop rotation often constrains acreage decisions. To reflect its effects on crop acreage decisions, we included the one-period lagged acreage of rotation crops where relevant.
Climate variables represent expected outcomes of temperature, not year-to-year short-term fluctuations in weather. To smooth out short-term fluctuations, we adopted 10-year moving averages of annual climate variables in the acreage estimation equations. Because GDD and chill hours are highly correlated, we used one or the other of the variables (that is, not both) in each equation. We used the 10-year moving average of chill hours for tree and vine crops, the 10-year moving average of GDDwinter for wheat, tomatoes and alfalfa, and the 10-year moving average of GDDsummer for the rest of the annual crops. Even though tomatoes and alfalfa are harvested mostly in the summer, tomatoes intended for early harvest are planted as early as February and the first cut of alfalfa occurs in April. Thus for these crops as well as wheat, warm temperatures during the winter growth period are particularly relevant.
We used crop acreage data spanning more than 60 years from the early 1950s to 2013, which are available from the Yolo County Crop Reports (Yolo County Agricultural Department 2014). The first available data year for analysis varied by crop between 1952 and 1954. The price data was collected from USDA sources over the same time periods. (The prices used in the acreage regressions are at the California state level, to reflect markets for Yolo County crops.)
Estimation results.
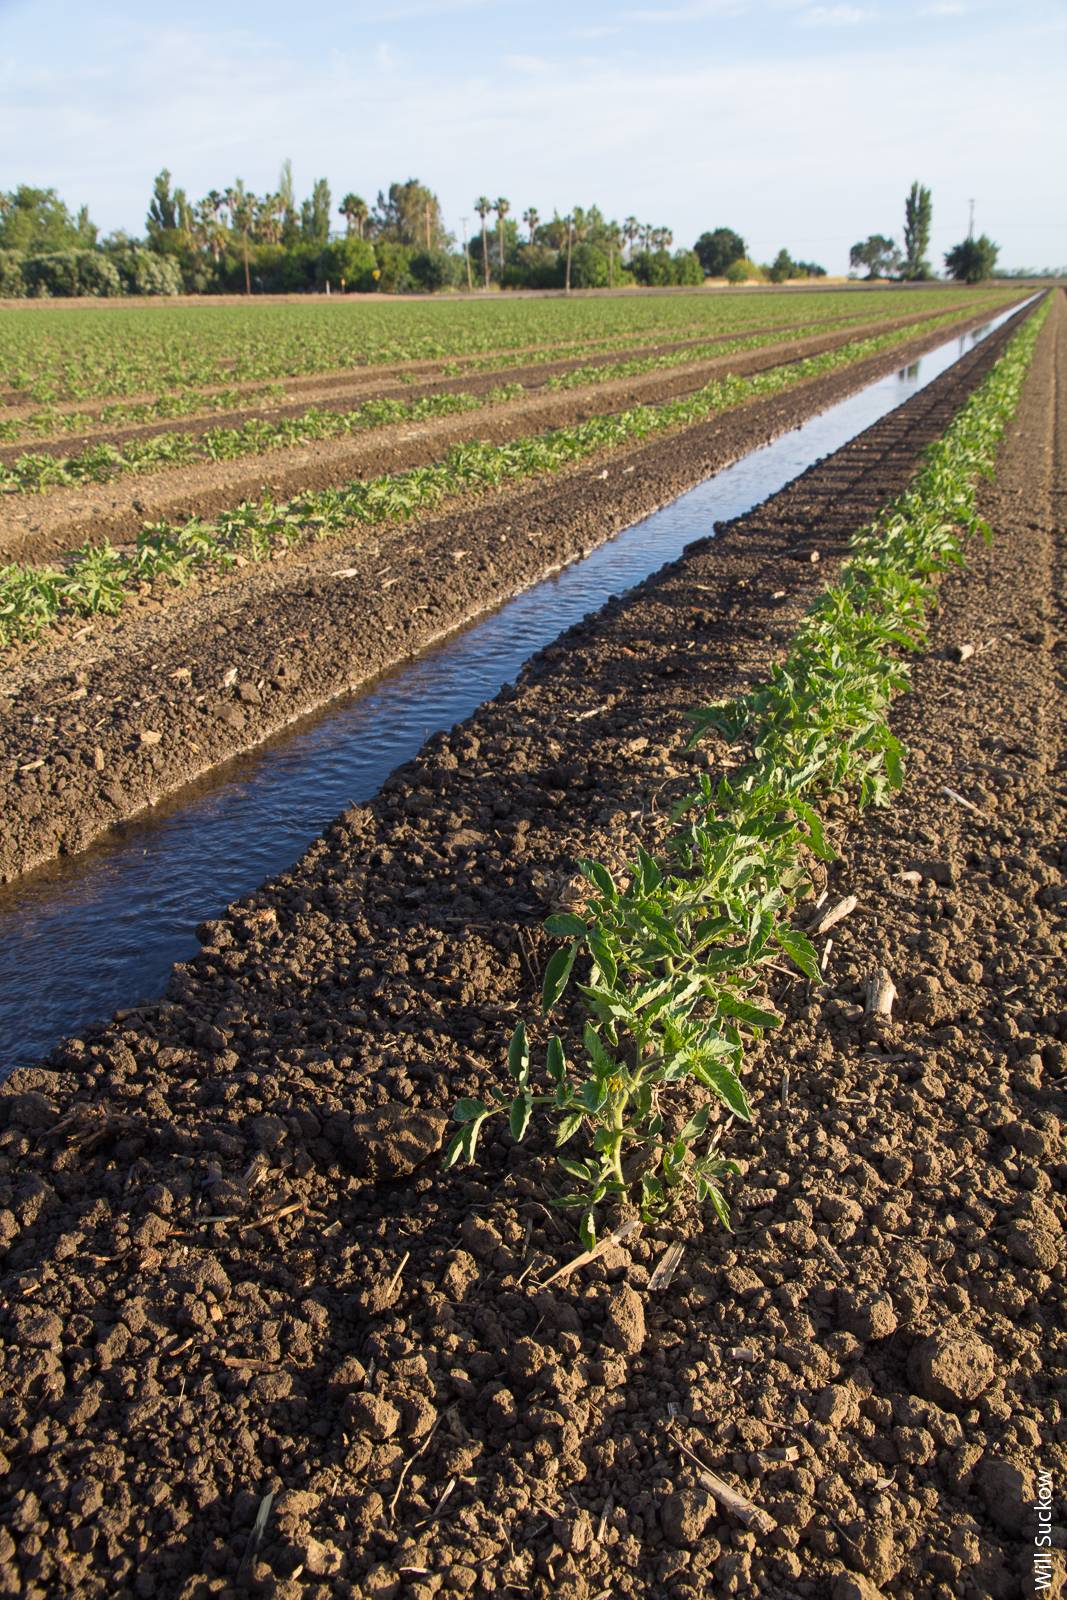
Models predict that processing tomato acreage, which accounts for 90% of vegetable acreage in Yolo County at present, could increase by 14% by 2050 if current climate trends persist with all other variables held constant.
Each of the 12 acreage equations was estimated separately. For each equation, crop acreage was regressed against explanatory variables discussed above. We found that crop prices and climate variables were more significant than other explanatory variables. Crop rotation was rarely statistically significant. Annual current water availability was relevant for a few annual crops, especially alfalfa, safflower and corn. Increased water availability tended to increase acreage of alfalfa and corn, but it reduced acreage of safflower. Water availability was less significant in explaining the variation in tree and vine acreage, which might be expected, because current water availability would be more important in year-to-year crop acreage decisions for annuals than for perennials. Likewise, it is expected that no one starts an orchard without already securing access to water given the long-term nature of orchard farming.
Crop prices affected acreage of rice and wheat with very strong significance (P < 0.01) and affected acreage of tomatoes, prunes and grapes with less, but still strong, significance (P < 0.05) (table 2). The implied price elasticities on acreage, calculated at the data means, were moderate for rice, wheat, tomatoes and prunes, and highest for grapes, about 1.6 (table 2), indicating that a 10% change in the expected grape price induces a 16% change in grape acreage. Such a strong price effect for grapes is consistent with the rapid emergence of grapes as the fruit crop with the largest acreage in Yolo County.
Climate variables were important for several crops. Moving averages of GDDwinter (MGDDw) showed strong statistical significance for alfalfa and wheat acreages, but with different signs, positive for alfalfa and negative for wheat (table 2). A warmer winter provides favorable conditions for alfalfa production, given alfalfa is harvested six or seven times a year starting in the spring. The negative effect on wheat is less clear, but it might be due to the fact that many old wheat varieties (important in the earlier years of our data period) required a period of cool growing conditions known as vernalization.

If current climate trends continue and all other variables such as wheat price hold steady, there could be a 45% decline in Yolo County wheat acreage by 2050.
None of the moving average variables measuring GDDsummer (MGDDs) were statistically significant (table 2). GDDsummer is hardly a binding factor in most of California, but higher average temperatures may increase the frequency of extreme heat events. Our initial investigation of the incidence of consecutive days of extreme heat did not show any systematic patterns. Extreme climate events are important in agriculture and deserve more investigation in California research.
Moving averages of winter chill hours were statistically significant for walnuts and other fruit at 5%, and for prunes at 10% (table 2), indicating that continuing warming in winter (or reduction in chill hours) would reduce the acreage for these crops. Walnuts and prunes are among the crops that require relatively high chill hours (table 1).
Climate change and future acreage
The statistical relationships between climate variables and the local pattern of crops planted over the past six decades in Yolo County may provide insight about future acreage there, if the current patterns of climate change continue. We projected changes in future acreage in 2050 relative to acreage in 2013, assuming determinants of acreage other than climate variables remained constant (we did not project changes in prices, technology or any other relevant drivers such as water availability). In other words, we assumed each climate variable will change each year along the estimated trend for the past century — +2.66 for GDDsummer, +3.57 for GDDwinter, and −1.96 for chill hours.
A permanent increase in GDDwinter by 3.57 units per year through 2050 increases alfalfa acreage by 6,036 acres, which represents a 15% increase over the 2013 acreage (table 3). The largest effect is on wheat acreage, which falls by 45%. The effects on tree and vine acreage are modest. Acreages for prunes, grapes, walnuts and other fruit decline due to fewer chill hours, whereas almond acreage expands slightly.

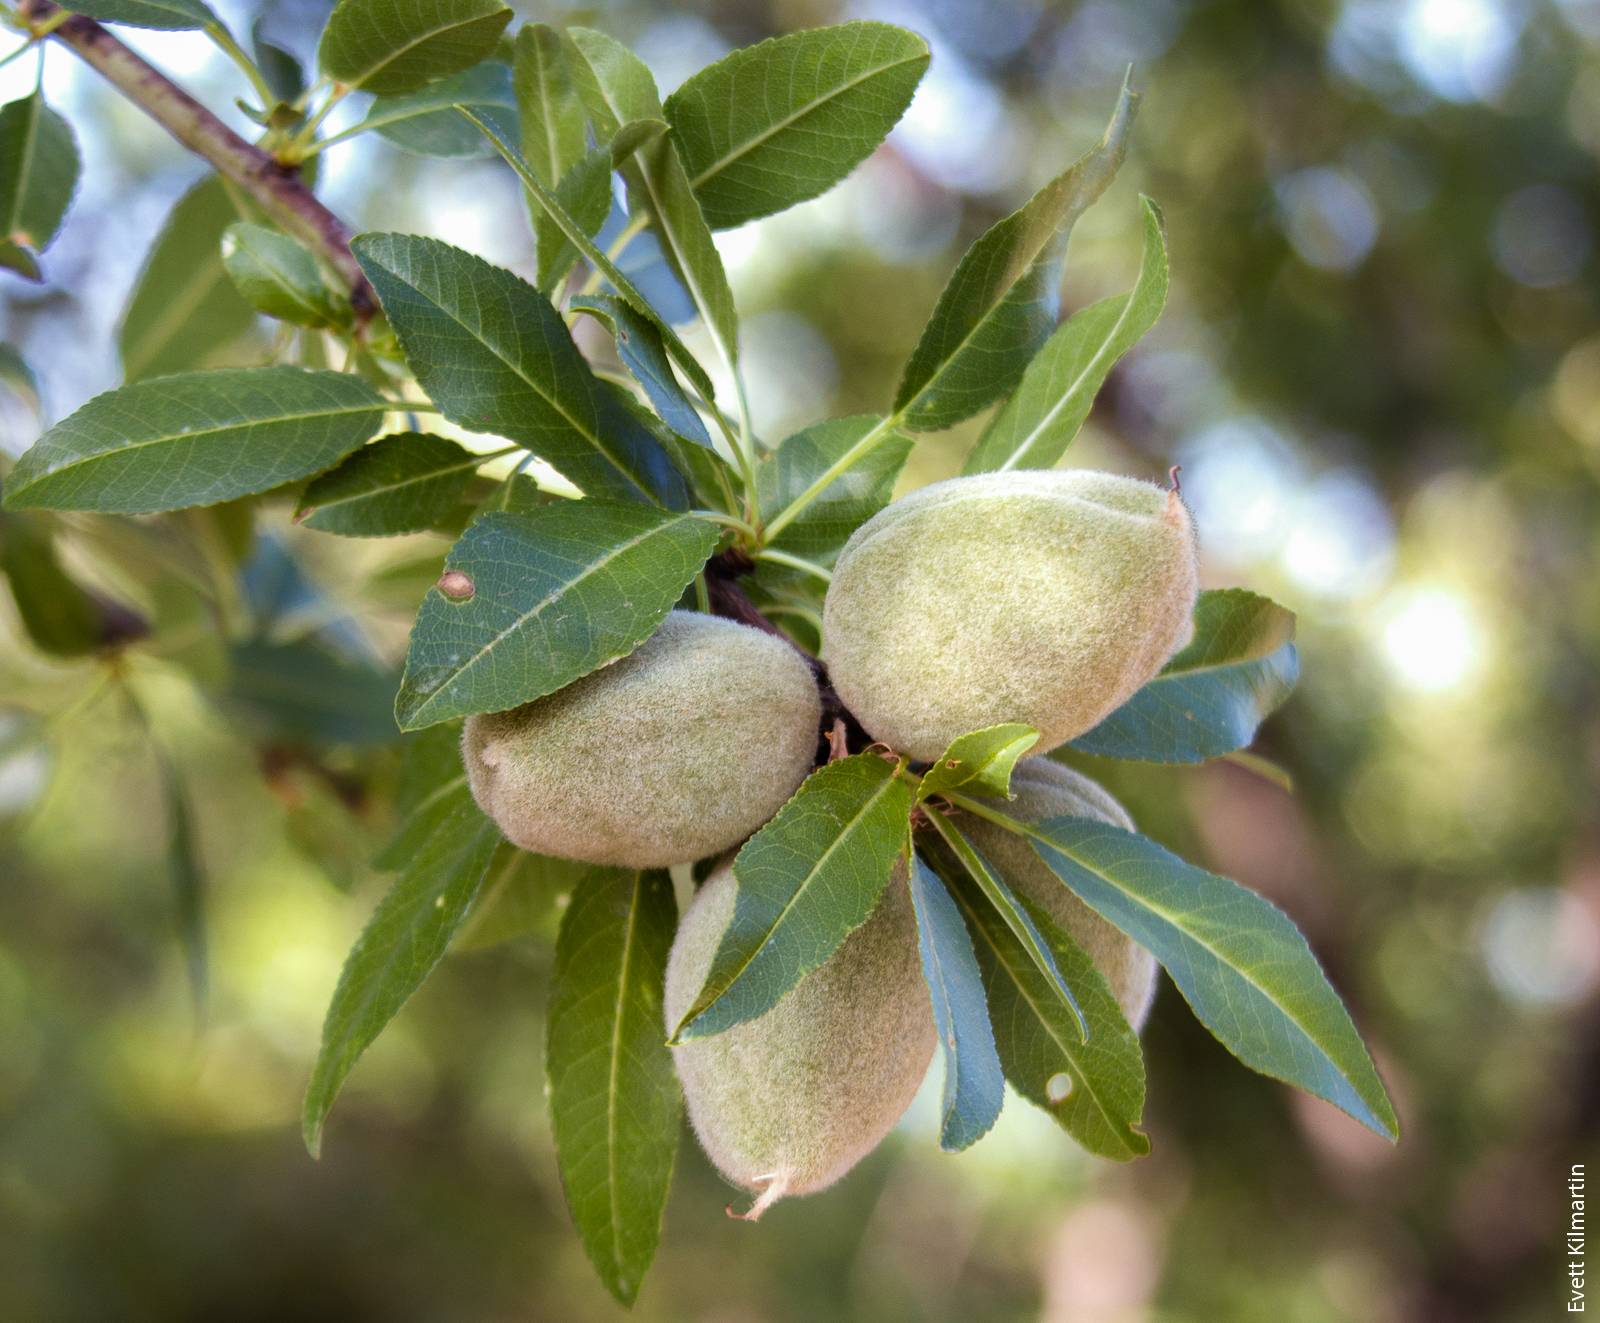
Almond acreage in Yolo County is projected to increase by 1% by 2050 if the current warming trend continues and all other variables remain constant.
The increase in alfalfa acreage relative to wheat presents interesting implications for irrigation water demand. Wheat is one of the least irrigation-intensive crops per acre, partly because much of its growing season coincides with the rainy season in Yolo County. Alfalfa is one of the heavy irrigation water users. Thus, a significant shift of acreage from wheat to alfalfa would increase irrigation water demand.
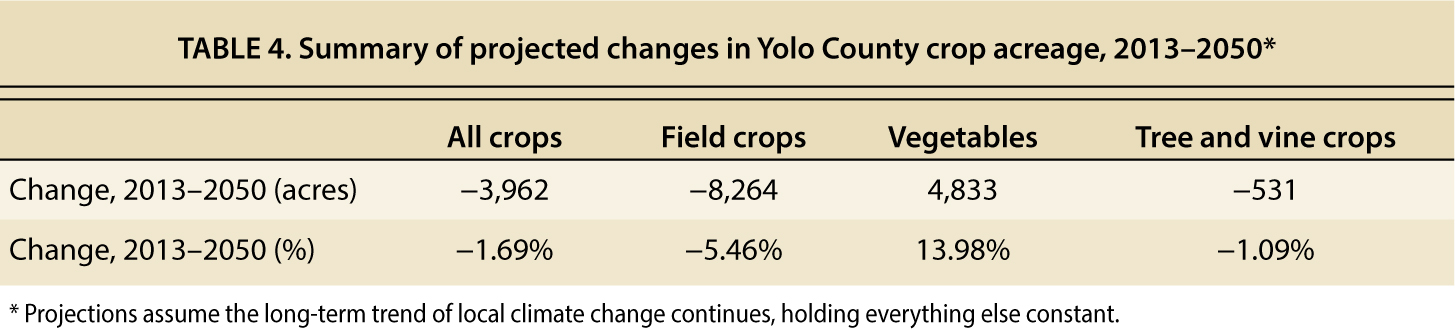
The acreage changes by crop category (table 4) indicate a modest reduction in field crop acreage (about −5.5%), an important increase in vegetable (processing tomato) acreage (14%) and a small decline in tree and vine crop acreage (−1.1%). These calculations indicate that under century-long climate trends, overall crop acreage changes induced solely by climate change would be modest, amounting to less than 2% by 2050.
Interpreting the results
It is important to recognize the following caveats when interpreting the results of this study. Our acreage projections were based on climate change that follows the simple linear trends of climate change for the past 105 years. We did not incorporate climate variability, extreme events or accelerated warming. More importantly, other climate-related factors that occur outside of Yolo County, such as irrigation water impacts caused by lower snowpack, were not incorporated directly. Moreover, our projections did not incorporate market impacts caused by climate change in other regions. Our projections also did not incorporate changes in policy, technology, agricultural practices or growers’ behavior that may be driven in part by climatic change. That is, we did not build in exogenous or endogenous adaptation, such as expanded federal crop insurance or shifts in cultivars that require fewer chill hours. For example, across the three walnut cultivars planted in California, winter chill requirements differ by 40% (UCD 2015) and cultivars requiring less winter chill may be on the horizon.
Citations
Modeling the effects of local climate change on crop acreage

