


All Issues
Sticky traps saturate with navel orangeworm in a nonlinear fashion
Publication Information
California Agriculture 70(1):32-38. https://doi.org/10.3733/ca.v070n01p32
Published online January 01, 2016
PDF | Citation | Permissions
NALT Keywords
Abstract
Trapping is an essential tool used to decide the need for and/or timing of an insecticide application. The assumption is that the information is accurate, but accuracy is dependent on trap reliability and efficacy. One factor that affects reliability is trap saturation, defined as the measurable decrease in trap capture due to reduced trapping effectiveness caused by the accumulation of insects already in a trap. In this study, we used unmated female navel orangeworm (NOW, Amyelois transitella (Walker)) as sex pheromone baits in wing traps that varied by color and glue/trapping surface in order to evaluate saturation thresholds and quantify trap effectiveness. Effectiveness decreased in each type of sticky trap as the number of insects caught increased, because of the accumulation of scales and insect bodies on the glue surface. The continued accumulation of insects further reduced trap capture, and this decrease in capture could be described by a regression using a power transformation. The resulting saturation equations that we calculated will help pest control advisers and growers interpret their trap data by better estimating the relationship between the number of males trapped versus those that visited the trap.
Full text
The navel orangeworm (NOW), Amyelois transitella (Walker) (Lepidoptera: Pyralidae), is the primary insect pest of the multibilliondollar almond and pistachio industries in California. Until 2013, male trapping, a potentially useful tool to monitor the NOW population and aid in control decisions, could only be used by those with access to a NOW colony to provide unmated NOW females for use as pheromone baits. Although the primary component of the sex pheromone was identified over three decades ago by Coffelt et al. (1979), it was only the recent elucidation of other critical NOW sex pheromone components by Kuenen et al. (2010) that enabled the development of commercially produced synthetic lures (Suterra, Bend, OR; Trécé, Adair, OK). These lures produce trap capture yields equivalent to female-baited traps (J. Siegel, unpublished data).
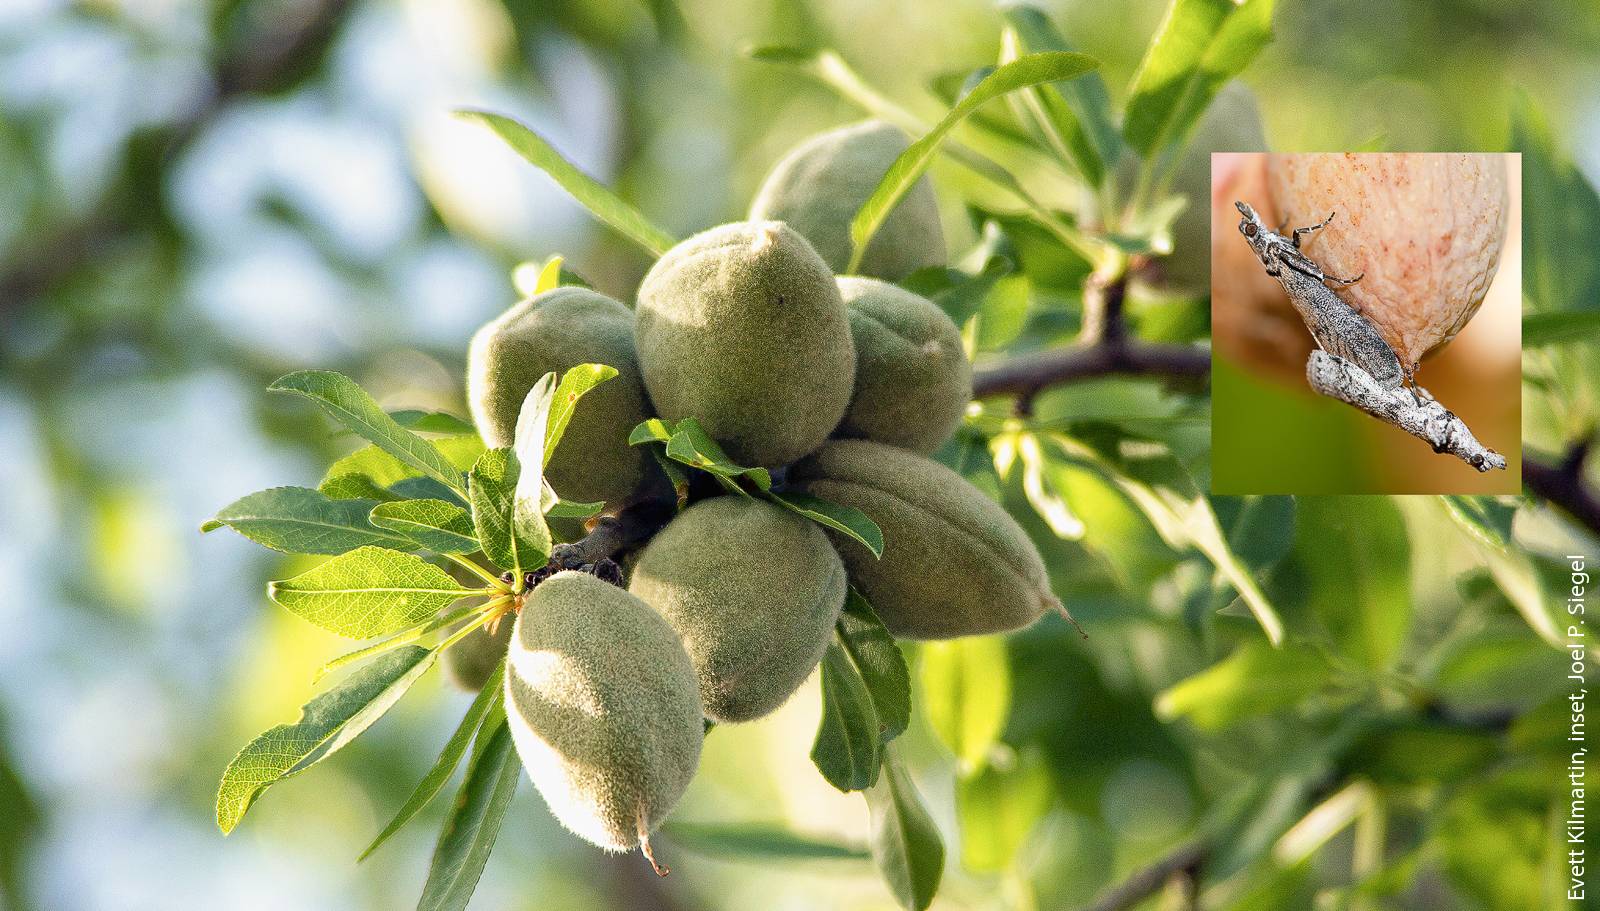
Almonds at West Side Research and Extension Center in Fresno County. Inset, navel orangeworm adults mating on pistachio.
Adoption of this new tool to aid orchard management decisions is dependent on the accuracy of the trap data. Trap accuracy is affected by two issues, trap efficiency (Ramaswamy and Cardé 1982; Sanders 1978) and trap saturation, defined as a decrease in trap effectiveness due to the presence of trapped individuals (Houseweart et al. 1981; Sanders 1986). Understanding the relationship between trap design and these issues is critical for population monitoring and management, especially for insect pest populations that are historically high.
When saturation occurs, the number of insects in a trap does not accurately represent the number of entries into the trap, resulting in an underestimate of the population. Saturation of glue-based traps occurs when the trap's ability to retain insects that enter the trap is reduced by the presence of trapped insects or by the presence of other fouling material, such as scales shed by the trapped insects, dust and plant debris.
Saturation is not an all-or-nothing phenomenon. Rather, the sticky trapping surface becomes increasingly fouled as each trapped insect covers part of the glue surface (fig. 1), and also as trapped insects fan their wings and disperse scales onto the surrounding glue. From years of experience with the field biology of NOW (Kuenen and Siegel 2010; Siegel et al. 2008, 2010), including extensive trapping experiments, we know that trap capture in female-baited traps in some locations can be as high as 150 males per night (J. Siegel, unpublished data), but those trap counts do not reveal how many males visited the trap if the trap became saturated at 50 moths, which is the saturation threshold we suspected from our experience with trapping.

Fig. 1. Trap bottoms from Suterra wing traps containing 5 (left), 79 (middle) and 149 (right) NOW males. Note the fouling of glue surfaces with moth bodies and scales on the two higher-count traps. Saturation begins at approximately 50 moths.
Previous studies of other insects have evaluated differences in trap design (Brown 1984; Knodel and Agnello 1990; Ramaswamy and Cardé 1982; Sanders 1978) and methods to increase trap capture (Houseweart et al. 1981; Ramaswamy and Cardé 1982; Sanders 1986). Our interest, however, was in determining the trap saturation threshold and efficiency of the sticky traps that are industry standards for monitoring insects that are in the same size range as NOW. Our goal was a more accurate estimation of a NOW population from trap capture numbers; eventually the relationship between the size of the population and damage to almonds and pistachios could then be established as part of an integrated control strategy for NOW.
Traps
The traps tested were as follows: (1) BioLure red wing trap (Suterra, Bend, OR; item 12533), with a glue surface area of ∼ 49.6 square inches, (2) Pherocon 1C white wing trap (Trécé, Adair, OK; item 3302-00), with a glue surface area of ∼ 60.5 square inches, (3) No-Mess Adhesive white wing trap (Alpha Scents, West Linn, OR), with a glue surface area of ∼ 60.5 square inches and (4) BioLure red delta trap (Suterra, Bend, OR; item 12777), with a glue surface area of ∼ 40.3 square inches.
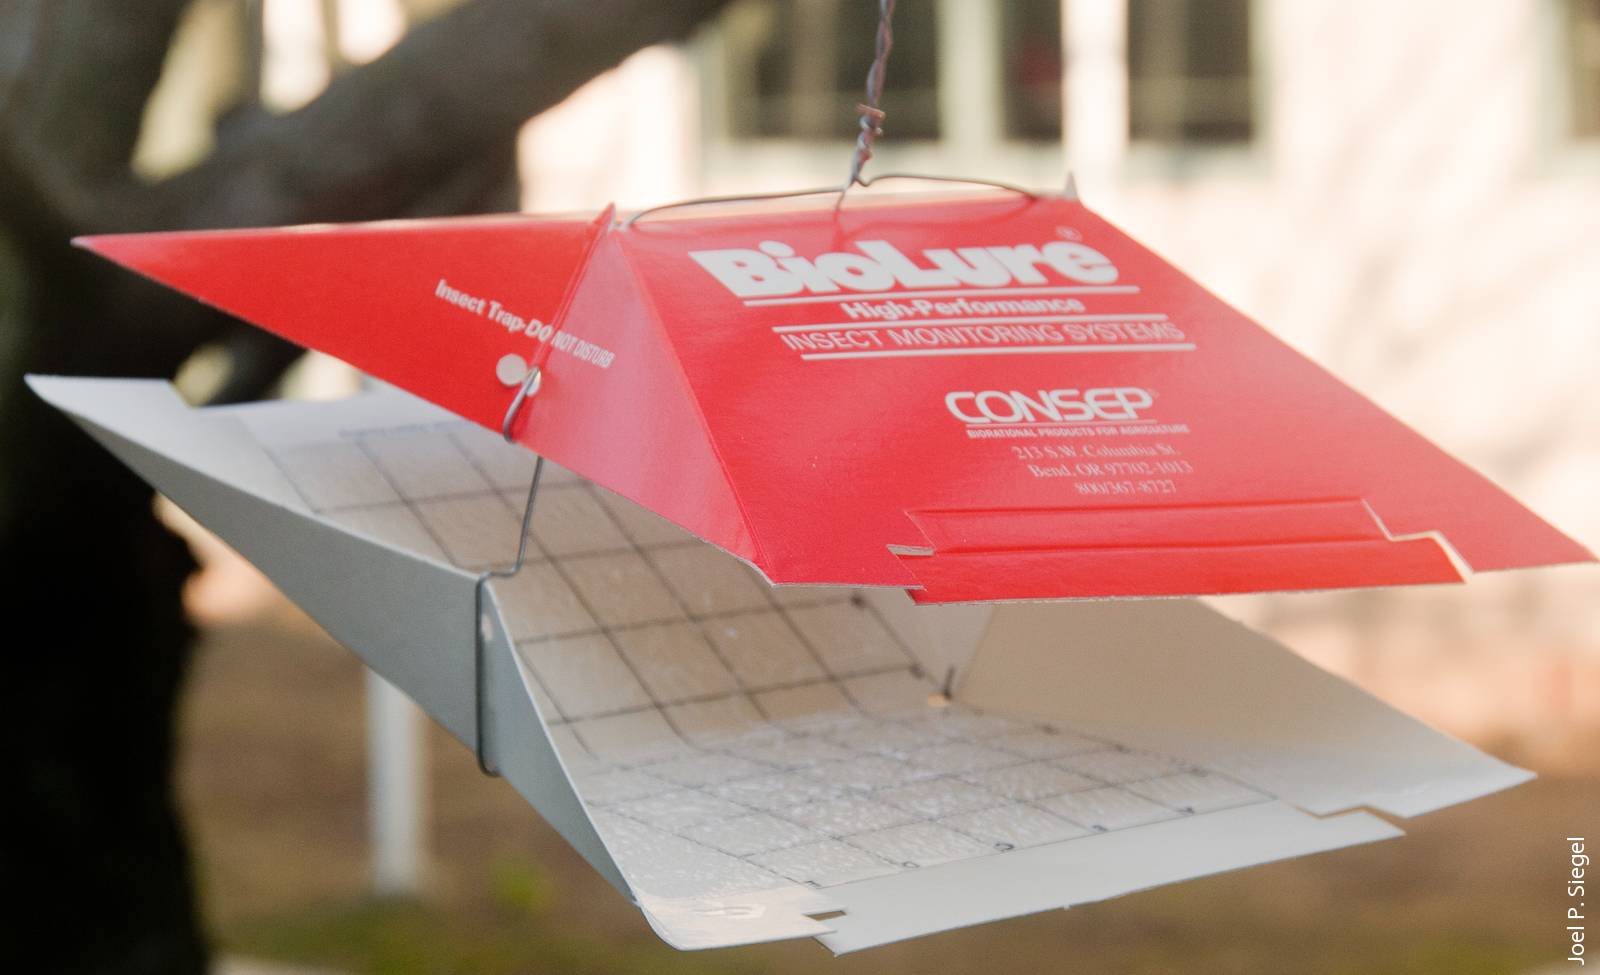
BioLure red wing trap.

BioLure red delta trap.
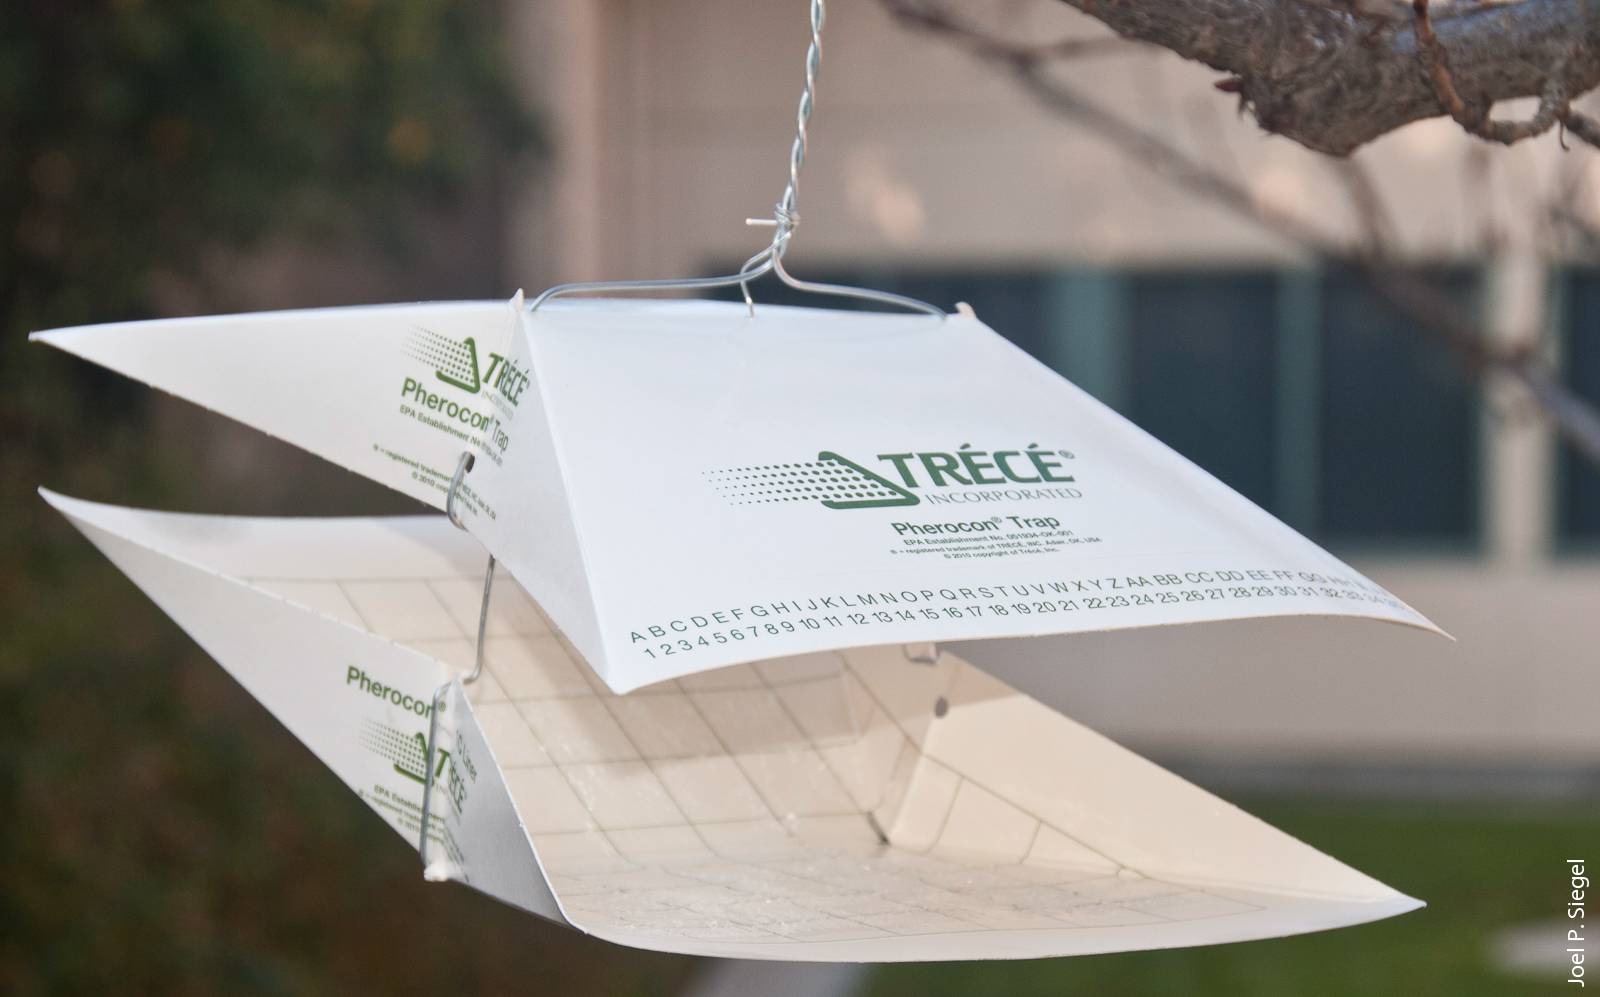
Pherocon 1C white wing trap.
All wing traps were assembled using the methods described by Kuenen et al. (2005). The differences in capture between saturating and nonsaturating sticky traps were evaluated by placing two groups of each trap type in the field: the nonsaturating group had trap bottoms replaced on each day the traps were checked; the trap bottoms in the saturating group were not replaced during an entire test.
As another comparison, we utilized a different type of nonsaturating trap, a water trap, that does not use adhesive to capture moths. The water trap consisted of a 1-pint translucent plastic tub with a surface area of 14.75 square inches, suspended by the trap wires under a Trécé wing trap top; the cup was filled with ∼ 8 ounces deionized water that contained ⅓ teaspoon unscented soap (as a surfactant) per quart of water. Moths were counted after being sieved from the decanted water, and then the trap was replenished with fresh water.
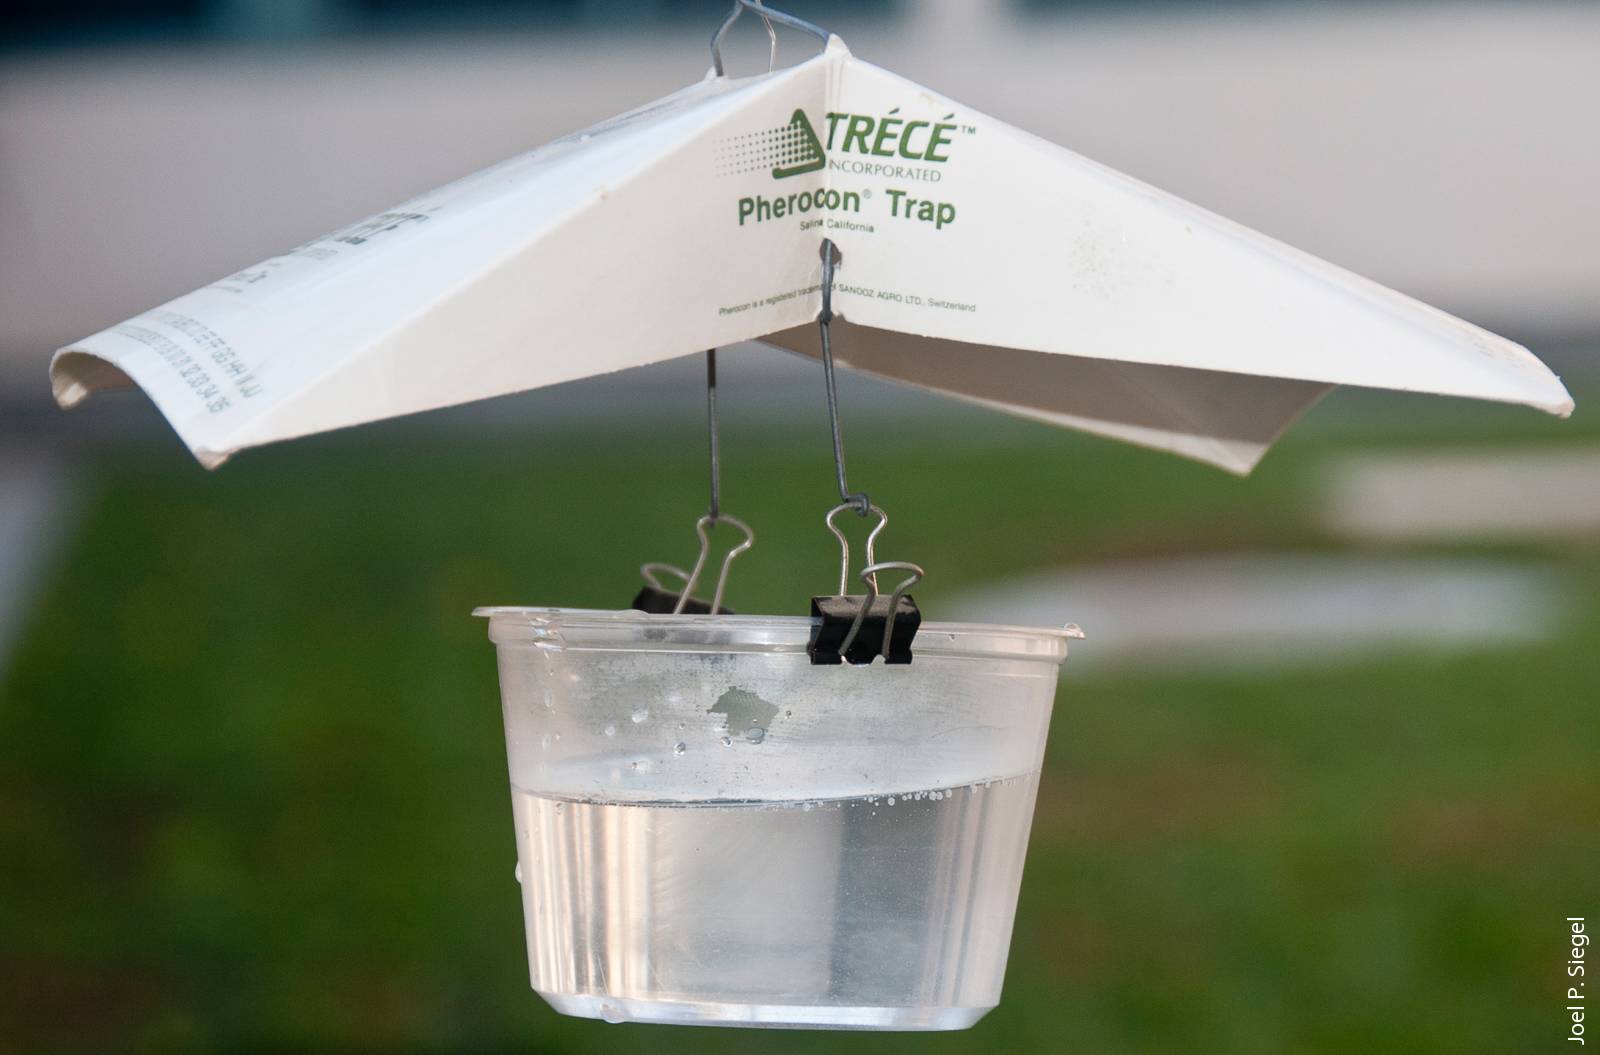
Nonsaturating water trap.
All traps were baited with three unmated NOW females, which served as pheromone sources. The females were hung in fiberglass screen cages (Curtis and Clark 1984) from the top-center of each trap. These female baits were replaced weekly with newly emerged females if daytime temperatures were ≤ 90°F, and at ≤ 4-day intervals when temperatures exceeded 90°F.
Traps were hung in trees 5 to 6 feet above the ground, with at least 150 feet between traps within a row (replicate) and at least 150 feet between replicate rows. Forty-five traps were placed out in a randomized complete block design. Five replicate rows were laid out, with each row containing a saturating trap of each type, a nonsaturating trap of each type, plus a water trap. Trap locations were freshly randomized for each site and test date and trap counts were recorded daily or every second day if daily numbers were low (≤ 10 moths per day in nonsaturating traps). Tests were terminated when saturating trap types had accumulated a mean of 150 or more moths per trap or when cooperators’ orchards received insecticide applications; data from the latter group were excluded if a mean of 40 moths was not attained in the saturating group.
Sampling
Trapping studies were conducted between April and August 2009 to 2011 in pistachio orchards in Madera County, ∼ 6 miles northwest of Fresno, California. Trapping tests were initiated if counts averaged ≤ 30 moths per trap per night so that we could compare both saturated and nonsaturated traps when they were equally effective. In prior studies (Kuenen and Siegel 2010), trap catch from late March through mid-May was less likely to exceed our proposed threshold of 50 moths per trap, and nightly trap catch could exceed 30 moths per trap after mid-July.
We report the results of five tests, comprising 88 days of sampling with the traps described above (table 1). Although we conducted more tests, they were terminated because cooperators’ orchards received insecticide applications or rapid rises in trap capture led to saturation of all traps.
Data analysis
The data were analyzed in two stages. The first stage used the raw data for each trap type but did not account for differences in the surface area of the glue. The relationship between male capture in the nonsaturating and saturating traps during the sample period was evaluated using regression (JMP v 10.0, SAS Institute, Cary, NC). In these analyses, the nonsaturating trap served as the independent variable, because it never reached full capacity.
The data were transformed for both nonsaturating and saturating traps using Log10 (x + 1) when a power transformation was the most appropriate. Total trap capture was compared separately for the saturating and nonsaturating sticky traps. The differences between trap types were then assessed using multiple regression with dummy coding (Cohen and Cohen 1983). In a separate analysis, differences in male capture between nonsaturating and saturating sticky traps and the water trap were evaluated using multiple regression with dummy coding.
In the second stage, the traps were standardized by converting the trap capture for each day into moths per square inch of the glue-covered surface. Differences among trap types were then assessed using multiple regression as described above.
Trap captures, equations
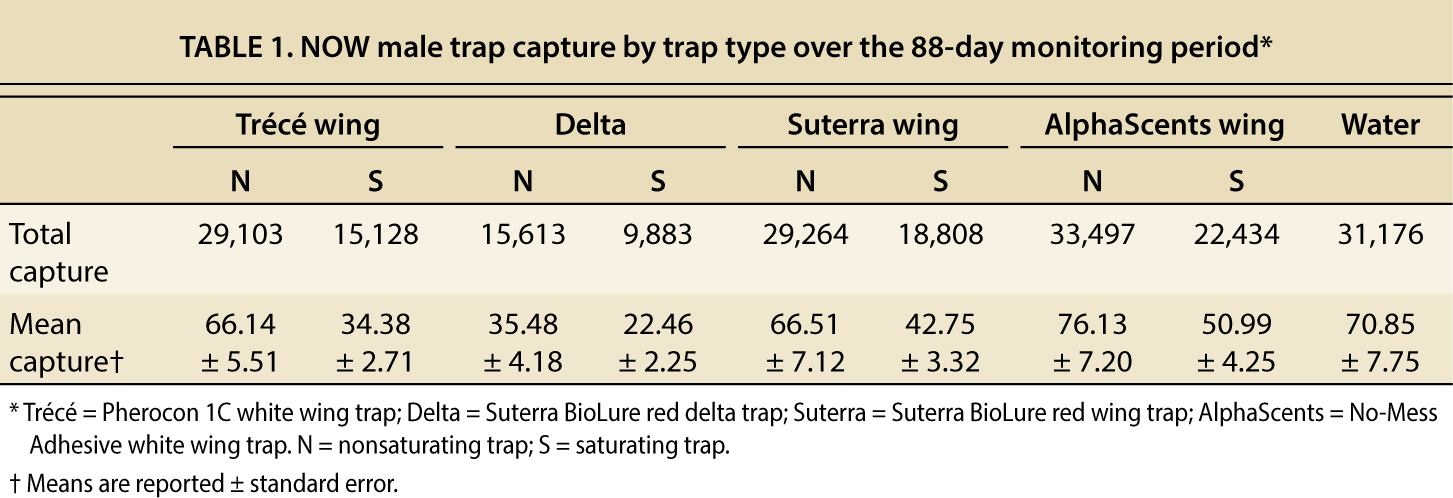
In the tests reported, we captured 204,906 NOW males, and the total traptype captures ranged from 9,883 to 33,497 (table 1). For every trap type, moth capture was greater in nonsaturating traps than in saturating traps, and this difference ranged from 33.0% to 48.0%. Delta traps caught the fewest moths, and the AlphaScents wing trap caught the most.
Figure 1 illustrates how trap glue fouling by insect scales increases as the number of moths caught increases. This fouling of the glue combined with the space occupied by the male captures reduces the ability of the trap to capture additional moths. If we plot data from nonsaturating traps on the x-axis and data from saturating traps on the y-axis, if saturation did not occur we would expect a 1:1 correspondence between the moths captured in the two trap types. This did not occur, and the line through the data points reported in figures 2 to 5 represents the best-fit line. For the wing traps, we drew a vertical line for the nonsaturating traps (x-axis) at 50 moths and a horizontal line showing the number of predicted moths in the saturating traps.
In the following regression equations, saturating trap capture is designated as STC, and nonsaturating trap capture is designated as NTC. Initially, we calculated regressions using 50 moths in the nonsaturating trap as an upper limit (truncated dataset), and then calculated a second regression using our entire dataset for each trap type; the regressions using the entire dataset are illustrated.
Trécé wing trap.
For the Trécé wing trap, using the truncated dataset, the relationship between the saturating and nonsaturating traps is a power function described by the equation
(r2 = 0.605; F = 56.781; df = 1, 38; P < 0.0001). When 50 moths are captured in the nonsaturating trap, the predicted catch in the saturating trap is 21.1, a reduction of 57.9%. The relationship between the saturating and nonsaturating traps for the entire dataset is linear and described by the equation

(r2 = 0.864; F = 546.007; df = 1, 87; P < 0.0001) (fig. 2). If 50 moths visited the trap, approximately 27 would be captured (46.0% reduction in trap capture). The equation derived from the entire dataset slightly improved the predictive ability of this trap.
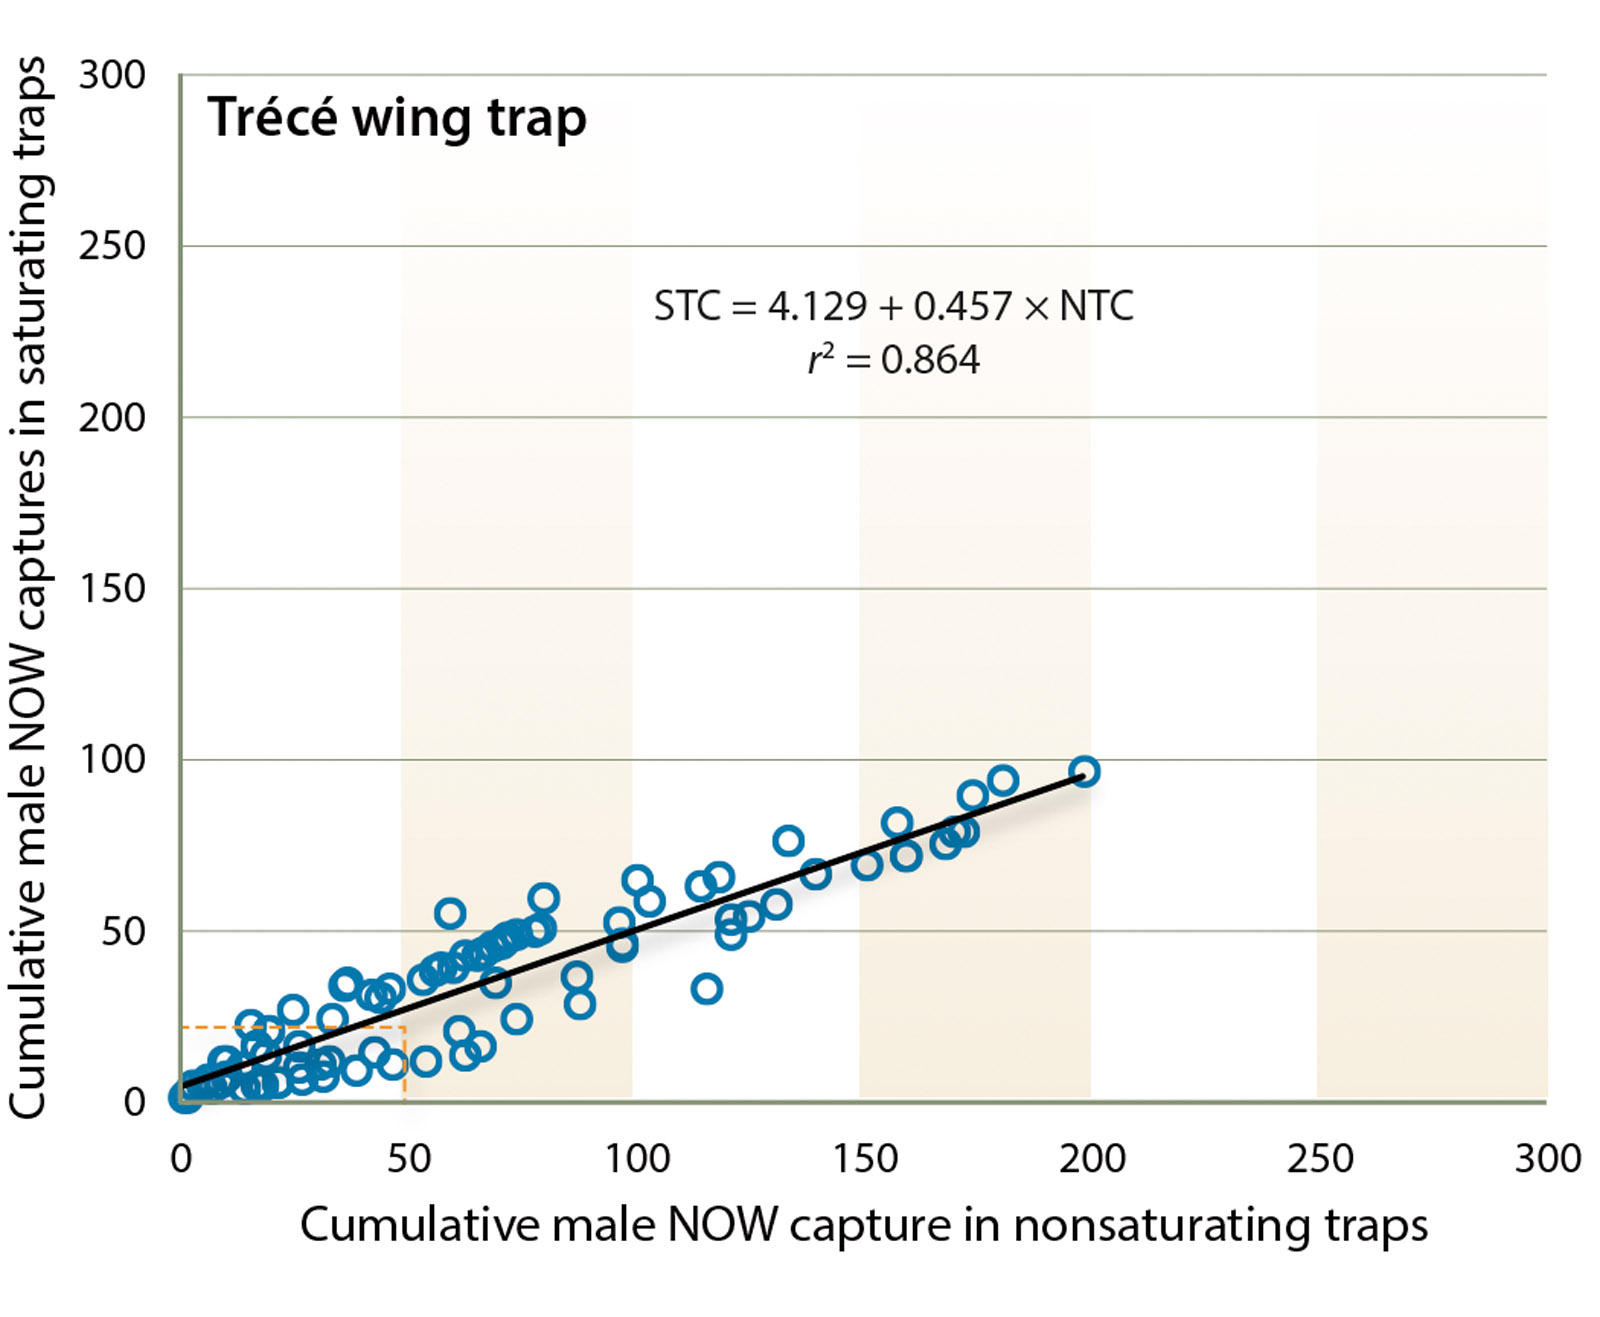
Fig. 2. Trécé wing trap. Plot of mean number of moths captured in saturating and nonsaturating traps (n = 5 tests). The relationship is linear and described by Saturating trap count = 4.129 + 0.457 × Nonsaturating trap count, r2 = 0.86. Dashed vertical and horizontal lines are guides to note deviation of saturating trap counts from nonsaturating trap counts.
Suterra wing trap.
For the Suterra wing trap, using the truncated dataset, the relationship between the saturating and nonsaturating traps is described by the power function
(r2 = 0.935; F = 674.163; df = 1, 48; P < 0.0001). When 50 moths are captured in the nonsaturating trap, the predicted catch in the saturating trap is 46.8, a reduction of 6.4%, confirming that saturation begins at approximately 50 moths for this trap. The relationship between the saturating and nonsaturating traps for the entire dataset is also a power function and described by the equation
(r2 = 0.938; F = 1,300.17; df = 1, 87; P < 0.0001) (fig. 3). If 50 moths visited the trap approximately 37 would be captured (30.0% reduction in trap capture). When the entire dataset is used, the reduced moth capture at high density flattens the curve, resulting in an equation that has greater error at densities of < 50 moths.
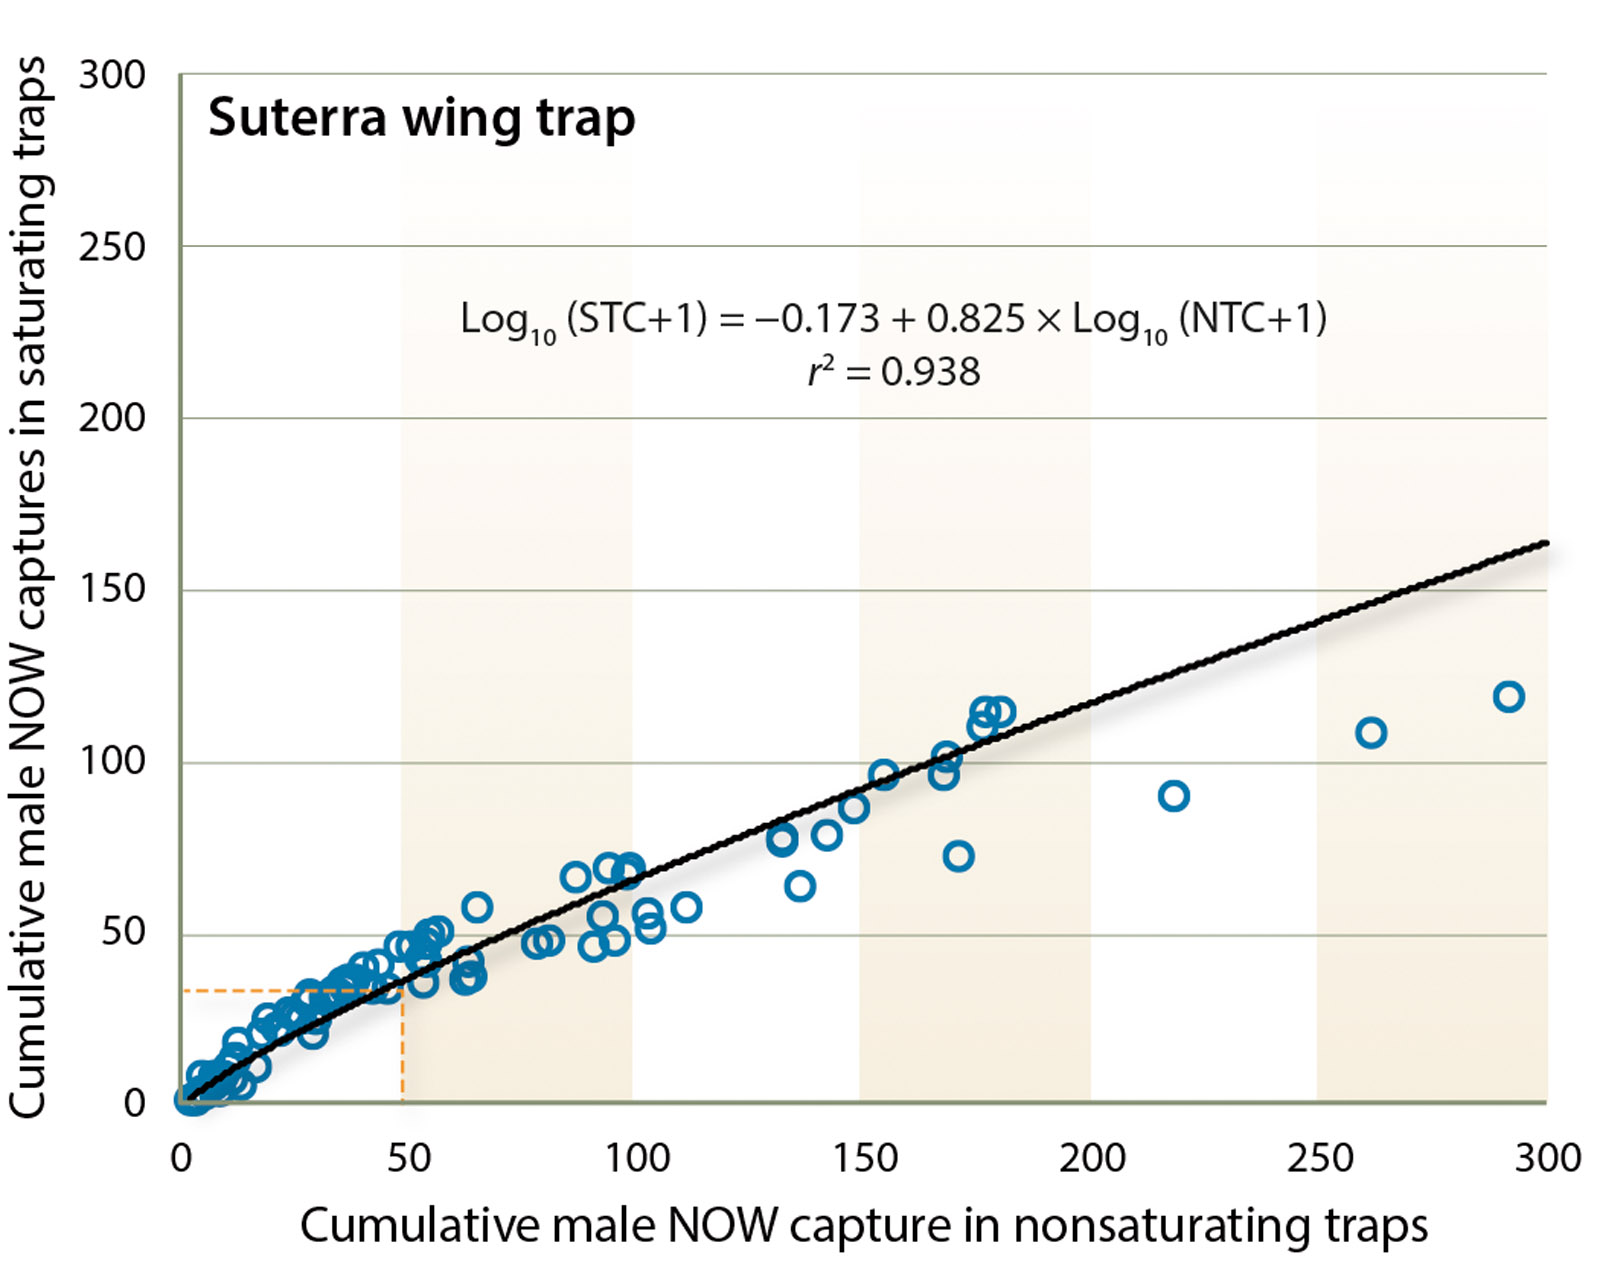
Fig. 3. Suterra wing trap. Plot of mean number of moths captured in saturating and nonsaturating traps (n = 5 tests). This is a power relationship described by Log10 (Saturating trap count + 1) = 0.173 + 0.825 × Log10 (Nonsaturating trap count + 1), r2 = 0.94. Dashed vertical and horizontal lines are guides to note deviation of saturating trap counts from nonsaturating trap counts.
AlphaScents wing trap.
For the AlphaScents wing trap, using the truncated dataset, the relationship between the saturating and nonsaturating traps is described by the power function

(r2 = 0.844; F = 199.81; df = 1, 38; P < 0.0001). When 50 moths are captured in the nonsaturating trap, the predicted catch in the saturated trap is 46.1, a reduction of 7.8%. This finding confirms that saturation also begins at 50 moths for this trap. The relationship between the saturating and nonsaturating traps for the entire dataset is also a power function and described by the equation

(r2 = 0.91; F = 823.78; df =1, 87; P < 0.0001) (fig. 4). If 50 moths visited the trap approximately 32 would be captured (36.0% reduction in trap capture). The reduced moth capture at high density flattens the curve, producing an equation that has greater error at the densities of < 50 moths.

Fig. 4. AlphaScents wing trap. Plot of mean number of moths captured in saturating and nonsaturating traps (n = 5 tests). This is a power relationship described by Log10 (Saturating trap count + 1) = −0.016 + 0.924 × Log10 (Nonsaturating trap count + 1), r2 = 0.91. Dashed vertical and horizontal lines are guides to note deviation of saturating trap counts from nonsaturating trap counts.
Suterra delta trap.
For the Suterra delta trap, using the truncated dataset, the relationship between the saturating and nonsaturating traps is described by the power function

(r2 = 0.896; F = 570.200; df = 1, 67; P < 0.0001). When 50 moths are captured in the nonsaturating trap, the predicted catch in the saturating trap is 40.0, a reduction of 20.0%. Saturation begins sooner in the delta trap than in the Suterra and AlphaScents wing traps. The relationship between the saturating and nonsaturating traps for the entire dataset is also a power function and described by the equation
(r2 = 0.905; F = 823.78; df = 1, 87; P < 0.0001) (fig. 5). There was an approximate 50% reduction in trap capture at 50 moths. Once again, the reduction in moth capture at high density flattens the curve, resulting in a greater error at densities < 50 moths than if the truncated dataset is used. The delta trap had a greater error than the Suterra and AlphaScents wing traps.

Fig. 5. Suterra delta trap. Plot of mean number of moths captured in saturating and nonsaturating traps (n = 5 tests). This is a power relationship described by Log10 (Saturating trap count + 1) = −0.019 + 0.898 × Log™ (Nonsaturating trap count + 1), r2 = 0.91. Dashed vertical and horizontal lines are guides to note deviation of saturating trap counts from nonsaturating trap counts.
Saturation at ∼ 30 to 50 moths.
Figures 6A–D are randomly selected examples of moth capture by trap type, from single field tests conducted during the 3-year period of our study. The points of separation of the saturating and nonsaturating lines are similar in number to departure points on the projection curves (figs. 2–5). Together these figures support our hypothesis that trap saturation began after ∼ 30 to 50 moths had been captured.
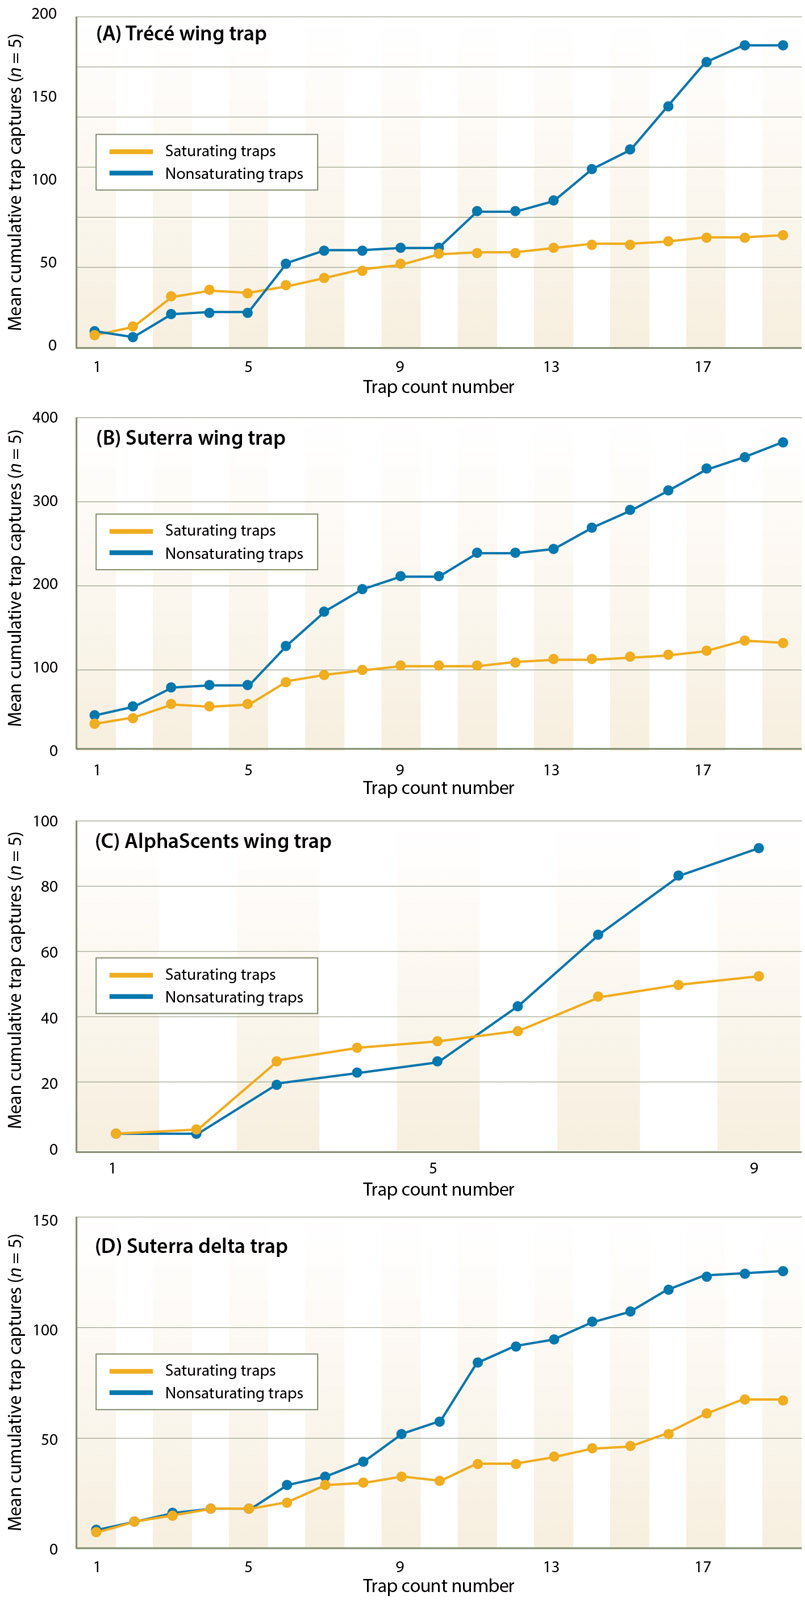
Fig. 6. Representative trap capture data from saturating and nonsaturating sticky trap pairs showing points of separation between saturating traps and nonsaturating traps (5 trap replicates within a single test). (A) Trécé wing trap; (B) Suterra wing trap; (C) AlphaScents wing trap; (D) Suterra delta trap.
Trap comparisons.
When the nonsaturating sticky traps and water trap were evaluated, there was no difference in overall capture between the water and glue traps (P > 0.05; table 1). Among the nonsaturating glue traps, the delta traps caught significantly fewer moths than the wing traps (F = 6.018; df = 4, 439; P = 0.0001). When the saturating traps were compared to the water trap and each other, there were significant differences in male recovery, F = 16.329; df = 4, 439; P < 0.0001. The water trap caught more moths than did the saturating glue traps (P < 0.0001) as expected, and the delta trap caught fewer moths than the wing traps (P = 0.0001). Among the wing traps, the Trécé wing trap caught the fewest moths (P = 0.023), followed by the Suterra and then the AlphaScents trap. When moth capture was standardized by converting the data to the number of moths recovered per square inch of glue, this pattern remained.
Previous studies of saturation
Sanders (1978) noted that some researchers regarded trap saturation as an all-or-nothing situation, where trap capture increases linearly until the traps reach capacity. Brown (1984) shows linear regression equations on his increased trap capture data; however, the data are presented as “relative efficiencies” and related in various ways to the changing day-to-day efficiency of the traps, apparently buffering out the curvilinear nature of trap saturation, which is still hinted at by the graphed data. Others (Houseweart et al. 1981; Riedl 1980; Sanders 1978, 1986) have also shown that trap saturation starts at some trap capture level and then trap capture begins to decline steadily from that point. We have demonstrated that for NOW, trap saturation progresses nonlinearly at densities below 50 moths per trap for all sticky traps tested, and also it progresses in a nonlinear manner above 50 moths per trap with the exception of the Trécé wing trap. Factors such as trap design and trap efficiency, which affect the likelihood of trap entrance, also contribute to the number of moths captured (Elkinton and Childs 1983; Ramaswamy and Cardé 1982; Sanders 1986).
Trap differences
In this study, we examined three wing traps that differed only minutely in dimensions but differed in sticky surface area, color, glue material/compound or a combination of these factors. For example, the Suterra trap, which has a sticky surface area 20% smaller than the other traps tested, has a red top and caught more moths than the Trécé white traps (L. Kuenen and J. Siegel, unpublished).
The two white-topped wing traps had equal sticky surface areas, but the Trécé trap had a conventional (polybutene-based) sticky surface, whereas the AlphaScents trap had a proprietary “magic” sticky surface that caught more males than the Trécé trap. On trap count days, males trapped in the AlphaScents traps appeared to flap their wings less frequently than moths in conventional glue, as they appeared to be closely adhered to these sticky surfaces. Such reduced wing fanning would clearly reduce glue fouling by scales and may explain the higher trap capture rate in the AlphaScents traps.
The delta traps caught disproportionately fewer moths even when their reduced sticky surface area was accounted for (table 1). We suspect that the trap entry behavior in these traps was responsible for the difference. The closed-tunnel delta trap design produces longer and more defined pheromone plumes than a wing trap (Lewis and Macaulay 1976), which likely led to a more straight-in trap entry (but only when the wind was reasonably aligned with the delta traps’ open ends) compared to wing trap entries. Wing trap plume structure is more diffuse but can come from 360 degrees. Lateral entries are possible in the wing traps and are often seen (personal observations in field and wind tunnel), whereas entry into the delta traps is limited to the two ends. When these two factors — plume structure and ease of entry access — are combined with the smaller sticky surface of delta traps, they help explain the lower trap catch for NOW.
Dry, nonsticky, traps are potential alternatives to sticky traps (Elkinton and Childs 1983; Knodel and Agnello 1990; Sanders 1986), but these traps can also begin to saturate due to insect escape as the trap fills toward the entry “port” level. In addition, both sticky and dry trap efficiencies may begin to decrease (saturate) due to the odor of the captured males (eastern spruce budworm, Sanders 1978) or the odor of decomposing corpses (gypsy moths, Elkinton and Childs 1983; eastern spruce budworm, Sanders 1986) but odor did not affect the trap capture of codling moth (Riedl 1980). This possible odor effect deserves future study to determine if dry traps are more appropriate for NOW.
Use in the field
In this study some wing traps captured more than 400 moths in a 3-day period, indicating that when populations are high, so many moths visit the trap that a fraction continues to be captured even though the trapping surface has been substantially reduced. In these high trap capture orchards, cooperating growers incorporated our catch information into their decision-making process and applied insecticides when the weekly trap count jumped. The absolute number of moths captured was not as important as the rapid increase in trap capture. In these orchards, our pheromone traps complemented egg traps and were more reliable later in the season when egg trap capture rates dropped because split nuts are both more attractive as oviposition sites than egg traps and vastly outnumber the number of egg traps deployed.
Our analyses validate our hypothetical saturation threshold of 50 moths for the Suterra and AlphaScents wing traps, and our graphs illustrate the process of trap saturation. This information can be used by growers and pest control advisers as they integrate the use of synthetic lures into their current methods of assessing NOW populations (primarily egg counts on egg traps (Rice et al. 1976)) and direct sampling for NOW life stages. Every technique has its own strengths and weaknesses, and the saturation effect above 50 moths per trap can be remedied by changing the trap bottoms more frequently.
The ultimate goal is to use trap monitoring to predict the potential for NOW damage. Trap saturation is one of several factors that can affect the relationship between capture in pheromone traps and subsequent damage to nuts. Standardization of trap type and lure as well as the density of traps affect the validity of trap data and its subsequent use for developing treatment thresholds. Further study on optimal trap density and trap design is needed before pheromone trap data can be used to determine an economic threshold for NOW.
Sticky traps saturate with navel orangeworm in a nonlinear fashion

