


All Issues
Biomass power plant feedstock procurement: Modeling transportation cost zones and the potential for competition
Publication Information
California Agriculture 69(3):184-190. https://doi.org/10.3733/ca.v069n03p184
Published online July 01, 2015
Abstract
Transportation of comminuted (processed) woody biomass from the production site to a utilization point is one of the most costly operational components in feedstock procurement. This study identified potential sources of feedstock based on transportation cost from which three woody biomass power plants in Humboldt County, California, could economically obtain their supply. We conducted service area and location-allocation network analyses for timberlands and sawmills, respectively, and created inclusive and exclusive networks to model three transportation cost zones (TCZs). The area within the $20/bone dry ton TCZ had the highest potential supply of woody biomass in the county (709,565 acres). All sawmills in the county were within an economically viable distance of the power plants. Even though there was no competition for raw materials at the time of this study, a competition risk analysis suggested that this could change with shifts in the demand for biomass or the price of electricity. The methods we developed for this study could be adapted to other regions with managed timberlands and a strong forest products industry.
Full text
Humboldt County, California, has approximately 1.7 million acres of forestland and maintains a strong forest products industry. Electrical power imports to the county are constrained by its remote location and lack of infrastructure. Consequently, it is a prime location for wood-based biomass energy plants. However, transportation costs have been a fundamental barrier to woody biomass utilization (Han and Murphy 2012). Even at 50 miles or less, transportation costs can be $10 to $30 per bone dry ton (BDT) (Galik et al. 2009). The fixed maximum weight limit on a chip truck of 40 tons in California increases transportation cost compared to neighboring states, which allow an increase of weight limits with an increase in the number of axles and axle spacing in a truck.
Therefore, the first objective of this study was to determine the transportation cost zones (TCZs) for procuring woody biomass (the byproducts, or residues, of forest management and sawmill operations) from various timberlands and sawmills to fuel wood energy power plants in the county.
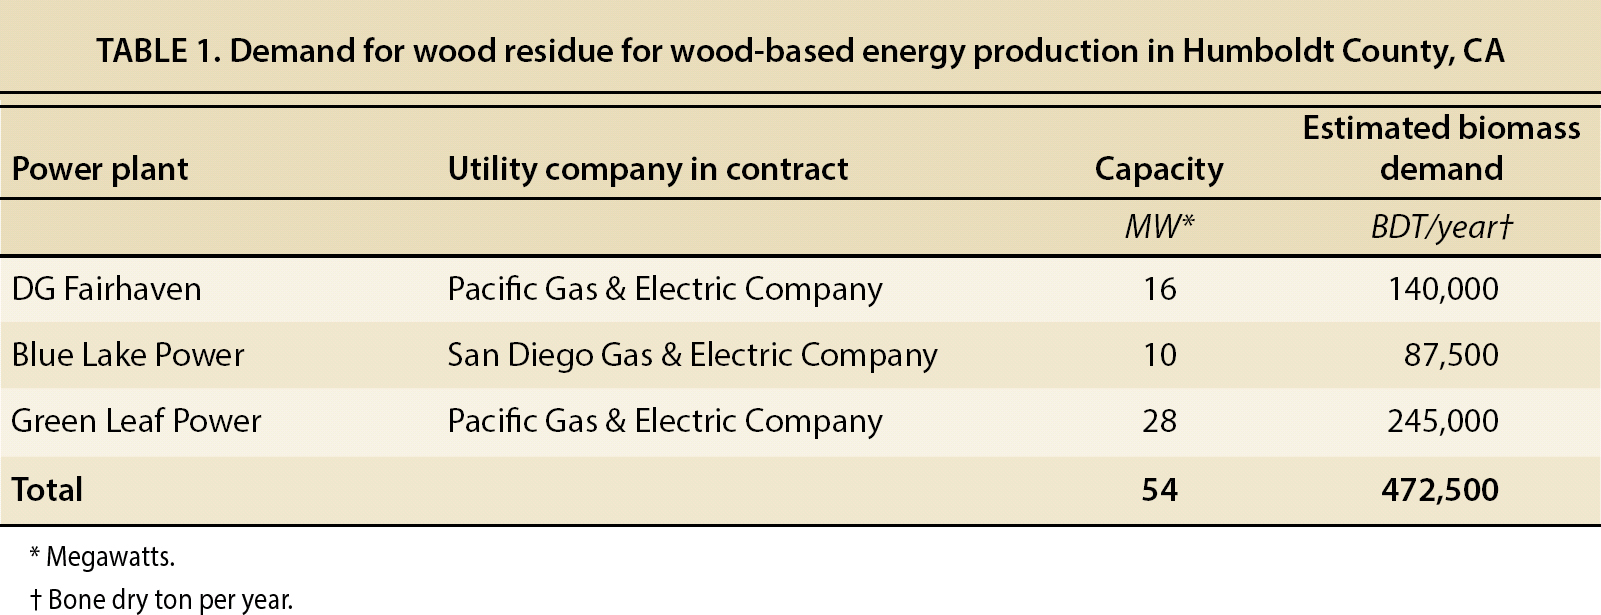
Humboldt County has three power plants that are primarily fueled by woody biomass: DG Fairhaven in Samoa, Blue Lake Power in Blue Lake, and Green Leaf (Eel River plant) in Scotia. Together, the plants have the ability to generate 54 megawatts (MW) of electricity (table 1). However, in the recent past, the Blue Lake Power and Green Leaf power plants have shut down temporarily due to the low price of electricity, emission permit issues and the inability to secure supply at an economical price (Sims 2012). Even though competition for raw materials among these three power plants does not seem severe in this region, high demand for renewable energy (e.g., woody biomass) or entry of an additional competitor for fuel resources can lead to increased competition for resources (Walter Nystrom, Blue Lake Power LLC, pers. comm.). Consequently, the second objective was to understand the potential competition for wood residues within the wood-based power production industry. To address this objective, we obtained information on the market and supply of wood residues from personal interviews with industry professionals.
The results provided by this study could be utilized by biomass contractors for maximizing their profit and for cost-effective delivery of wood residues from sawmills and timberlands to power plants. Furthermore, the methods developed for this study could easily be adapted to other locations where timberlands are actively managed and a strong forest products industry exists.
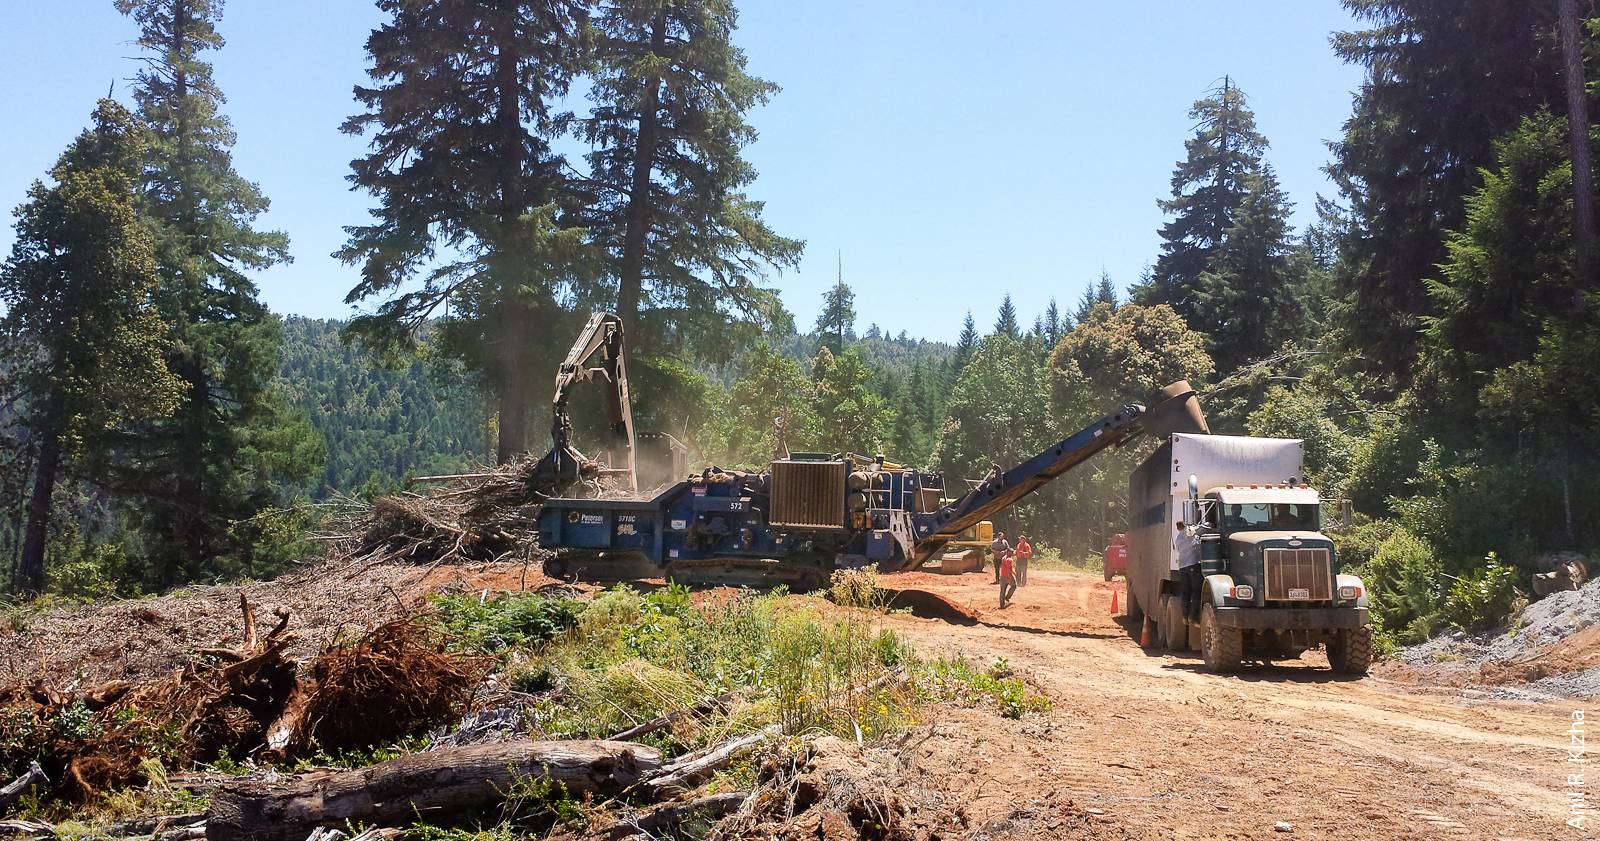
Forest residues are fed into a grinder at a centralized site and then loaded into a container for transport to the power plant. In Humboldt County, power plants use approximately 472,500 bone dry tons of biomass per year to generate electricity.
Data collection
All forested areas in the county, along with nine sawmills, were considered as potential wood residue sources. While the cost of acquiring sawmill residues was largely dependent on the transportation cost from sawmills to power plants, forest residues (tree tops, branches and non-merchantable whole trees) from timberlands had variations in the operational costs associated with in-woods processing, which were also considered. For this study, in-woods operational (stump-to-truck) costs to harvest, process (grinding or chipping) and haul were based on typical practices for the region.
Harvesting amounts and operational cost differences in the county have been directly influenced by the type of harvesting methods used, which varied by landowner type (Hohl et al. 2013; Morgan et al. 2012). Hence, using spatial data obtained from the Humboldt County Planning and Building Department, we classified the timberlands based on their ownership. Industrial timberlands were privately owned forests characterized by active forest management including timber harvesting. Land owned by tribal governments was also treated as industrial timberland for this study, as it was managed similarly to privately owned forestland. In the national forests (Six Rivers, Klamath and Shasta-Trinity), biomass harvesting was typically conducted via relatively expensive thinning operations to achieve environmental benefits such as fire hazard reduction and forest restoration. As a result, industrial timberlands generated forest residues at a lower stump-to-truck cost range of $26 to $30/BDT (Bisson et al. 2015; Harrill and Han 2012), while in the national forests, stump-to-truck biomass costs were approximately $52/BDT (Vitorelo et al. 2011). Both of these costs represent the direct cost of the operation in the field and did not accommodate any allowance for mobilization of equipment, overhead or profit.
Transportation model for biomass feedstocks
Forest residues.
While primary transportation (moving the forest residues from the stump to the landing, where the biomass is stacked and processed) was incorporated in the in-woods operational cost, secondary transportation (movement of the forest residues from the landing to the power plants) was modeled using road networks obtained from the U.S. Census's Topologically Integrated Geographic Encoding and Referencing (TIGER) data set. The service area tool of ArcGIS (10.1) Network Analyst was used to model the area for secondary TCZs. Information on average travel speeds over different road types and associated costs for the region were gathered from existing literature (table 2).
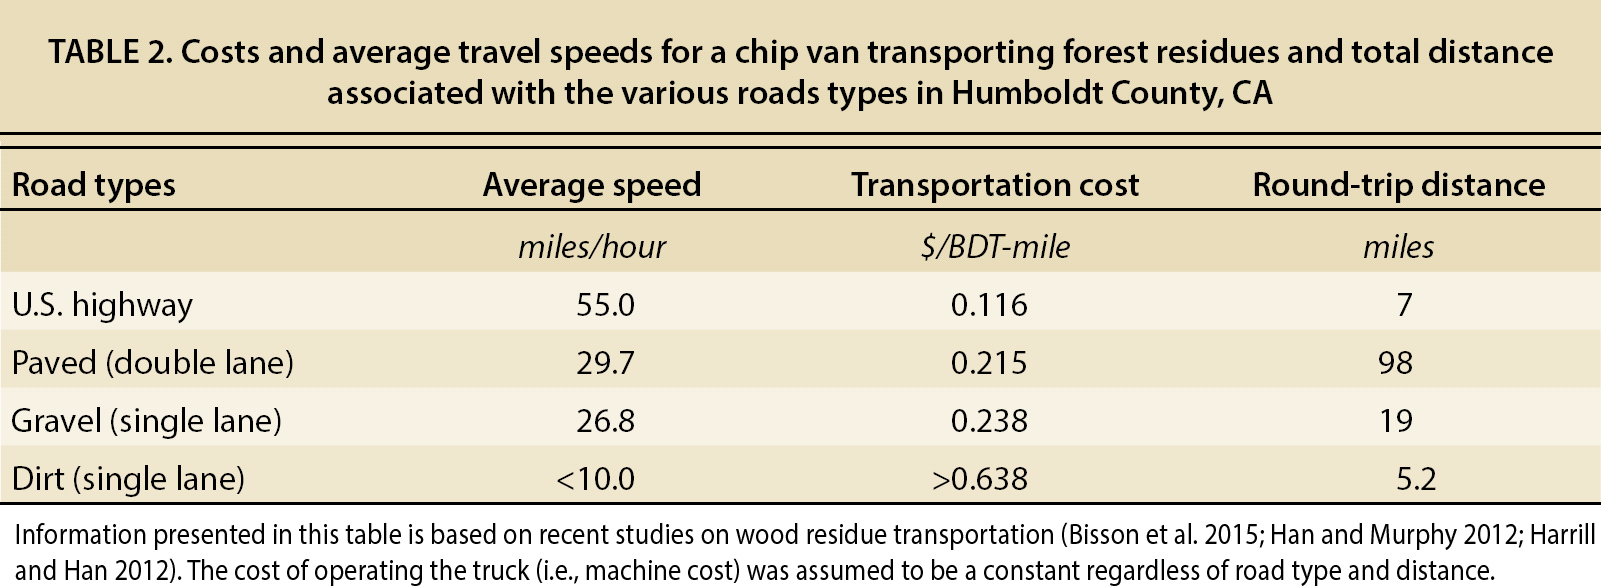
TABLE 2. Costs and average travel speeds for a chip van transporting forest residues and total distance associated with the various roads types in Humboldt County, CA
We assumed an average secondary transportation cost based on road types from a recent study in the region (Bisson et al. 2015) of 42-foot chip trailers carrying an average of 23.17 green tons of 25% moisture content wet basis hog fuel (wood chips and shavings). At this unit hauling cost, the TCZ thresholds of $10/BDT, $20/BDT and $30/BDT fell at 20, 41 and 61 miles. Each TCZ was associated with a range of costs: in the $30/BDT zone, the transportation cost ranged from $20.01 to $30.00/BDT based on a one-way distance between 41 and 61 miles. The TCZs were generalized to increments of $10; more refined TCZs (e.g., in increments of $1) would have complicated the model and yielded results with more or less the same utility.
To determine the actual area available for each power plant, we created two transportation networks: The inclusive transportation network, in which TCZs were classified based on the cost to provide biomass to any of the three plants (fig. 1); and the exclusive transportation network, in which the three power plants were considered individually to allocate the timberland available for each plant. The three exclusive TCZs were later intersected with the respective three inclusive TCZs to determine the actual timberland available for each plant. This also helped in determining exclusive and shared timberland zones (figs. 2 and 3).

Fig. 1. Exclusive and inclusive transportation networks in Humboldt County, CA. For the exclusive network, three TCZs for three biomass power plants were determined based on distance (round-trip) and road types (above). The TCZs in the inclusive network (far right) were classified based on the cost to provide biomass to any of the three plants.
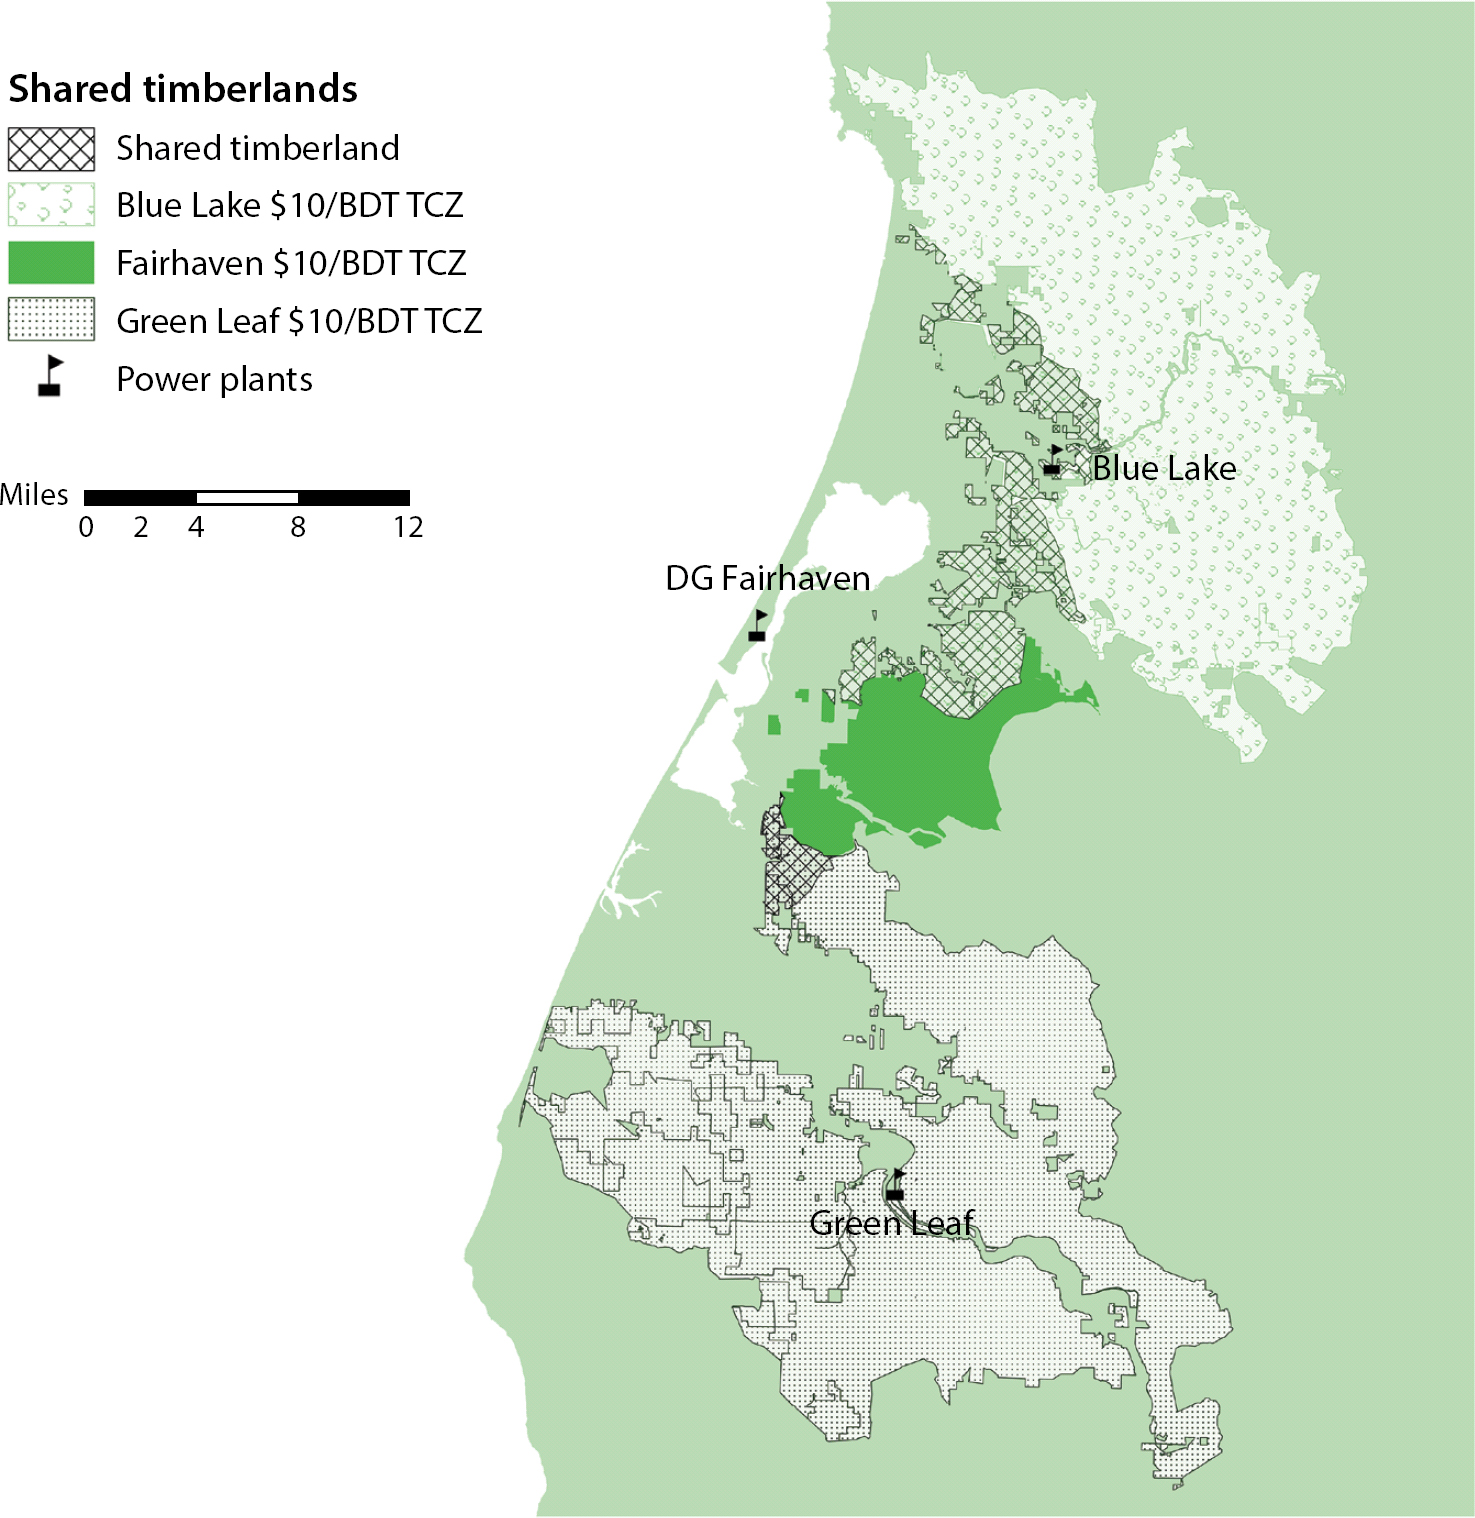
Fig. 2. Wood residue competition zones (shared timberland) for three power plants within the $10/BDT TCZ in Humboldt County, CA.
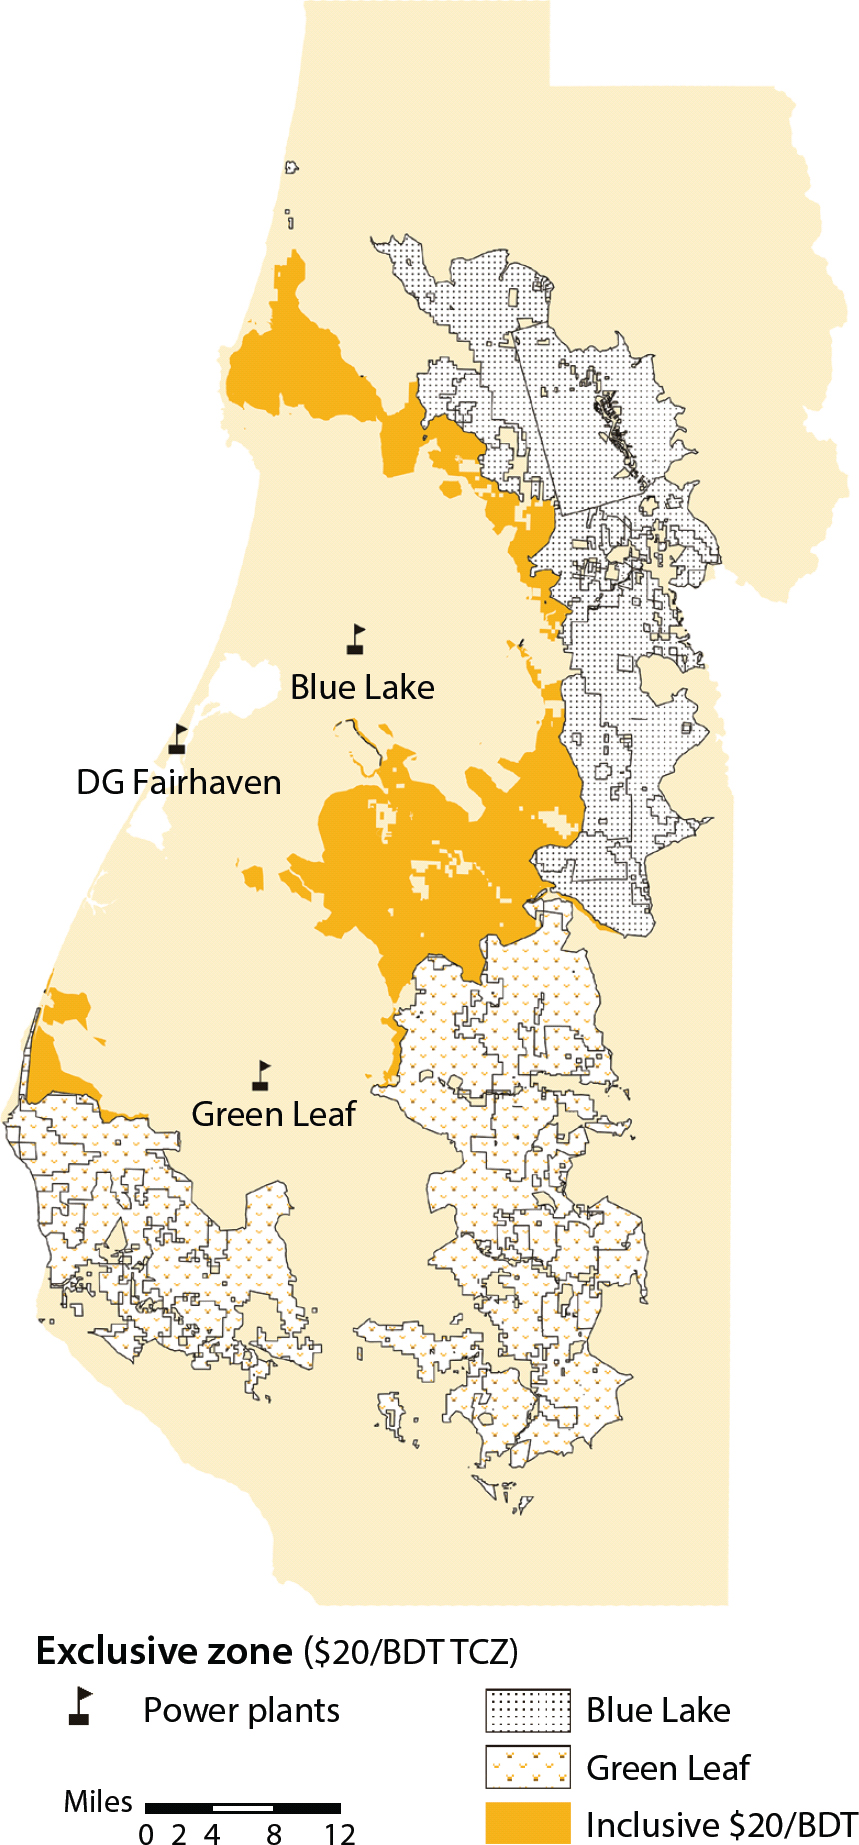
Fig. 3. Exclusive zone of timberlands for each power plant within the $20/BDT TCZ (round-trip) in Humboldt County, CA.
Exclusive timberland zones were regions around a power plant from which competing plants could not be supplied forest residues at lesser or equal price (with all conditions equal), due to the secondary transportation cost. Access to these timberlands could give the power plants an advantage if competition became an issue. Overlapping timberlands were regions within the same TCZ of two or more plants (i.e., multiple plants could be supplied at approximately the same cost). We made the following assumptions for areas where TCZs overlapped:
-
The plant with lower TCZ claims the area over the plant with higher TCZ. For example, if 30 acres of timberland fell in both the exclusive network model of the $20/BDT zone of Green Leaf power plant and the $30/BDT zone of DG Fairhaven power plant, the region would be taken out of the total area of the $30/BDT zone for Fairhaven because Green Leaf could have the material supplied at a lower cost.
-
When overlapping $/BDT TCZs are equal (shared timberland), the area is considered a “hot spot,” indicating a high risk of competition (fig. 2).
Hierarchical order was assigned to road type to give preference to existing highways ($0.12/BDT-mile), followed by paved roads ($0.22/BDT-mile), gravel roads ($0.24/BDT-mile) and dirt roads (more than $0.64/BDT-mile) to reduce the cost of transportation (table 2). Each TCZ was later intersected with the timberland ownership data in order to exclude non-timberlands and incorporate timberland ownerships into the TCZs.
Sawmill residues.
The location-allocation tool of ArcGIS (10.1) Network Analyst was used to estimate the transportation cost associated with sawmills and evaluate the relative advantage for each power plant to procure sawmill residues. This analysis is based on a proximity approach (competitive facility location) for estimating market share (Drezner 2014). All facilities (sawmills) in the county were selected such that the allocated demand for transporting the sawmill residues to the power plant was maximized in the presence of competitors based on a spatial interaction model (ESRI 2012). This method was used in determining the optimal sawmill(s), based on road types and distance, from which power plants could import sawmill residues within a maximum one-way haul distance of 61 miles (W. Nystrom, pers. comm.). Based on the theory of duopoly in a linear market situation, in which consumers (power plants) do not see any difference between the products (mill residues) sold by different producers (sawmills) and there is zero production cost for the producers (Drezner 2014; Hotelling 1929), Network Analyst created a weighting factor we called mill residue procurement (MRP) to assign the demand for sawmill residues from a particular sawmill to a power plant in the presence of competitors as a function of distance. Greater MRP implies a more favorable condition for obtaining sawmill residues for a particular plant. The sum of MRP for all sawmills reflects the overall advantage for a given power plant, relative to other plants, to procure available sawmill residues.
TCZs for forest residues
$10/BDT zone.
The $10/BDT TCZ was the region that provided forest residues from the timberlands at the lowest cost level due to proximity to the power plant. When stump-to-truck biomass costs were taken into account, more expensive forest residues close to a power plant were in many cases more economically feasible to procure than cheaper resources farther away. This zone included only industrial timberlands, with Green Leaf having the largest acreage (table 3). Our analysis of the risk for competition (fig. 2) showed that DG Fairhaven shared almost 53% of all its timberland with the other two plants (table 4), giving it little specific advantage in collecting forest residues over the other plants. Blue Lake and Green Leaf shared 15.5% and 2% of their timberland with DG Fairhaven, respectively. While all the facilities had an exclusive zone within this TCZ, Green Leaf had the largest exclusive area (table 4).
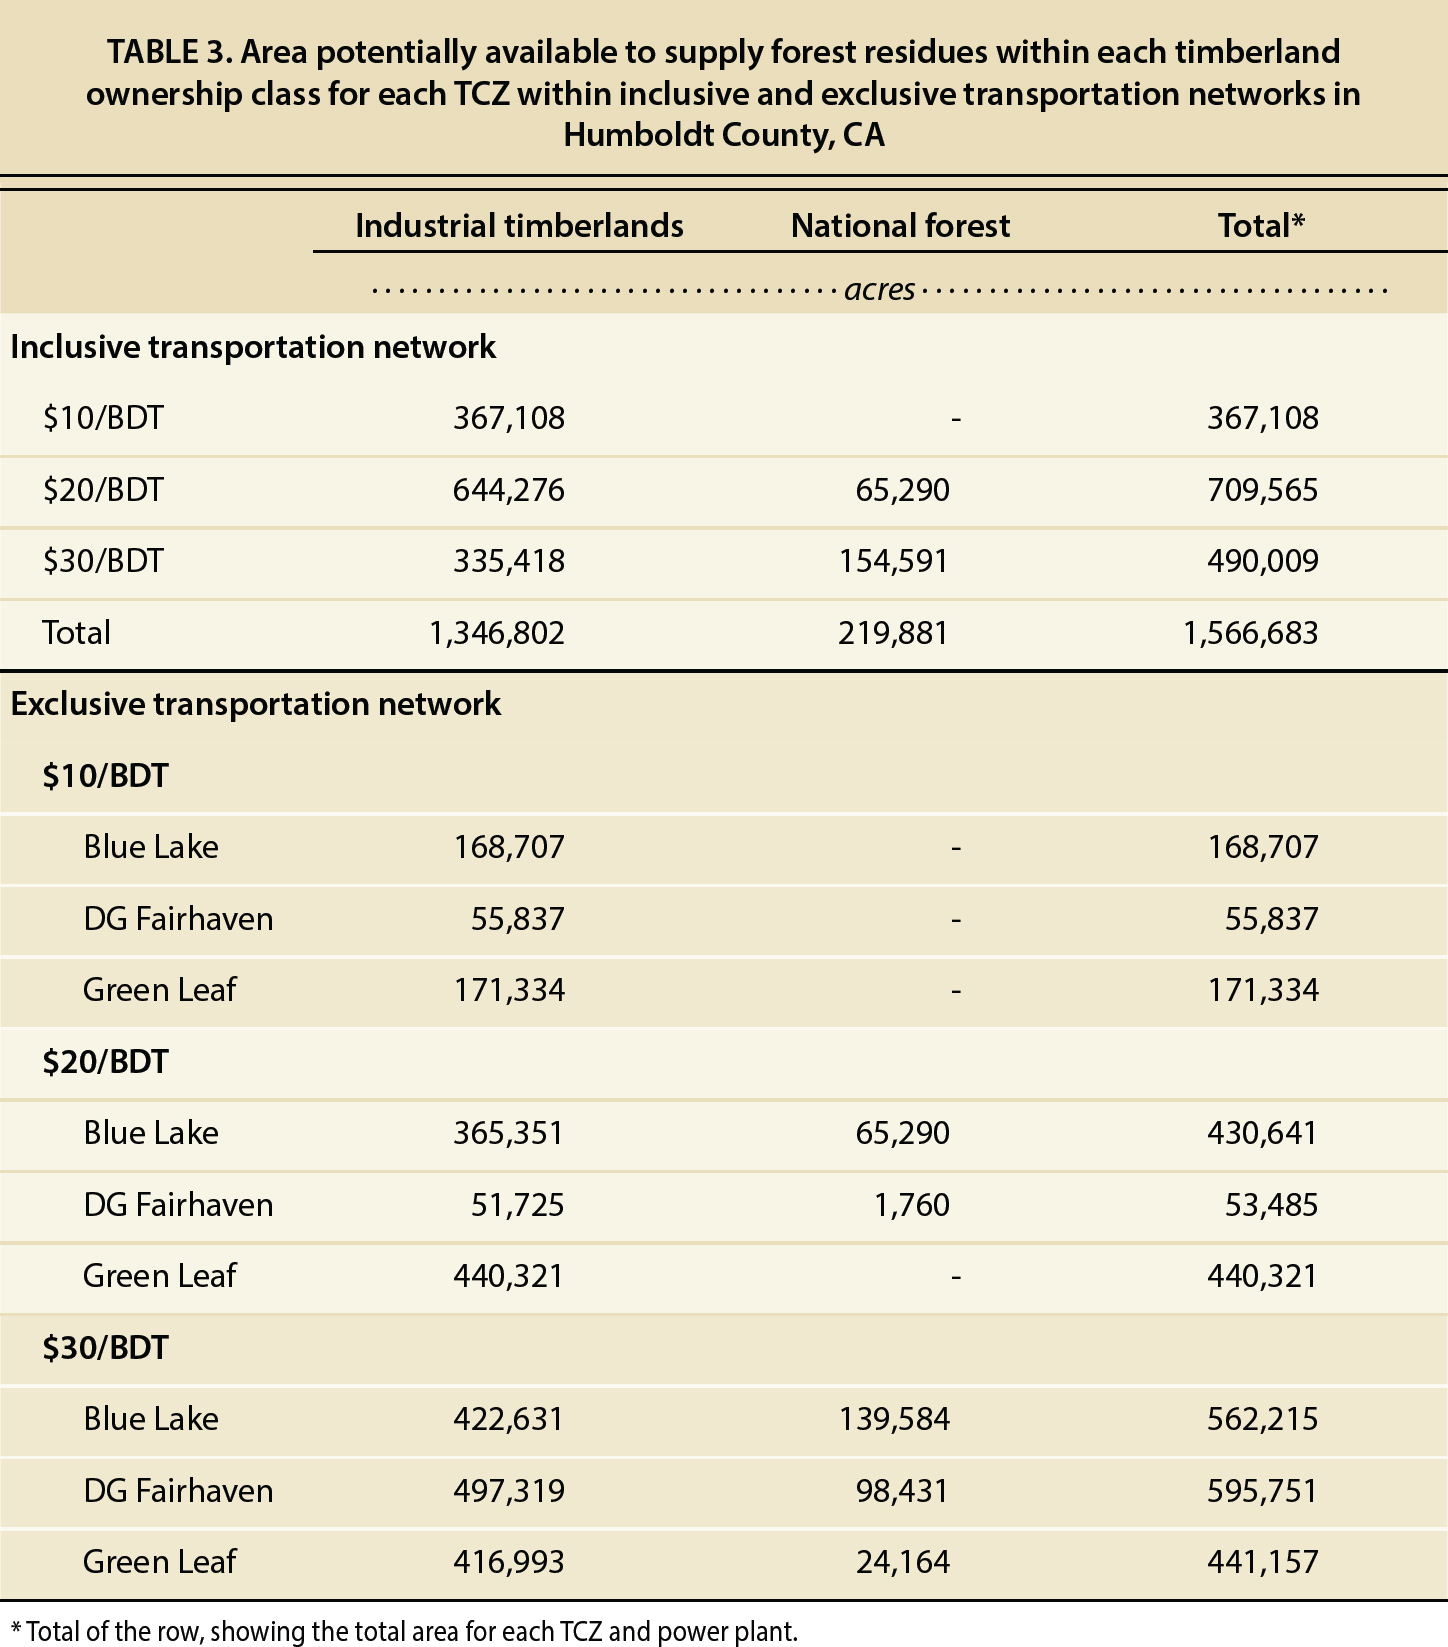
TABLE 3. Area potentially available to supply forest residues within each timberland ownership class for each TCZ within inclusive and exclusive transportation networks in Humboldt County, CA
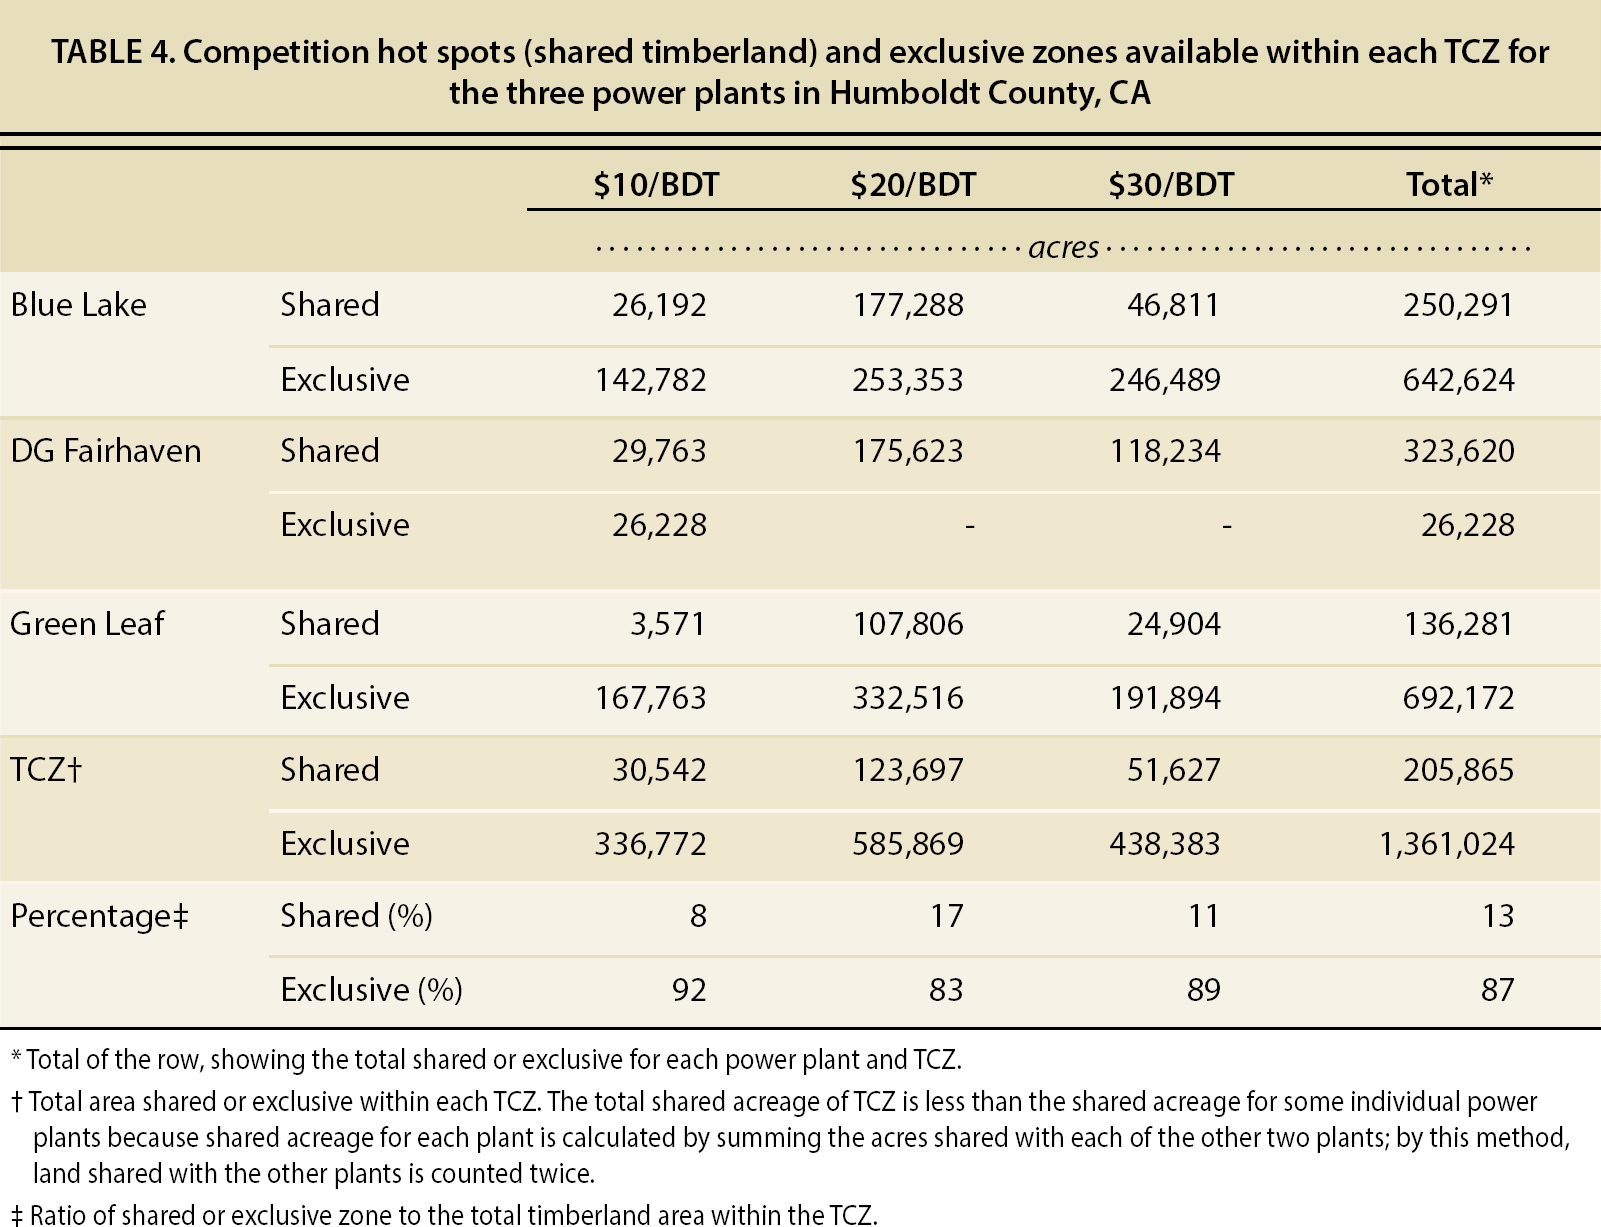
TABLE 4. Competition hot spots (shared timberland) and exclusive zones available within each TCZ for the three power plants in Humboldt County, CA
$20/BDT zone.
This zone had 709,565 acres of total timberland, with 644,276 acres of industrial timberlands (table 3). Approximately 17% of timberland was shared. Within this zone, DG Fairhaven had no exclusive timberland (fig. 3). Among the three TCZs, this zone had the highest acreage and supply of forest residues.
$30/BDT zone.
The $30/BDT TCZ is currently regarded as the outer limit for cost-effective procurement. Given the current cost of supply and market price for biomass in Humboldt County, this zone would typically generate zero profit margins for biomass contractors supplying the raw material, unless additional compensations were offered (e.g., government subsidies). In this zone, feasibility was highly dependent on hauling distance.
Supplies from TCZs
Industrial timberlands constituted 86% of the 1,566,683 acres of timberland within the three TCZs (table 3). The $30/BDT TCZ had a smaller area and supply of forest residues than the $20/BDT TCZ for the following reasons:
-
The $30/BDT TCZ was smaller than anticipated because much of the potential land base in this zone was actually in the ocean.
-
A large proportion of the acreage falling in the $30/BDT exclusive TCZ overlapped with the inclusive $20/BDT zone of other plants and had to be removed from the former TCZ and added to the latter.
-
Our analysis was carried out exclusively for Humboldt County. Much of the timberland outside the county that would have been in the $30/BDT zone was not included. However, even if these regions outside the county within the $30/BDT were considered, transportation would still not be feasible in the current market.
-
The $30/BDT TCZ had the highest amount of national forest acreage, almost 31% (table 3), compared to 9% in the $20/BDT TCZ.
Procurement of sawmill residues
Sawmill residues added an additional 408,000 BDT annually to the local supply of wood residues (Hohl et al. 2013). Unlike forest residues that were seasonal in nature, residues from sawmills could potentially be available all year long. Furthermore, this resource was less expensive ($10/BDT) when compared to the forest residues ($50/BDT) (Mayhead and Shelly 2012).
Results from the location-allocation analysis showed that DG Fairhaven had the greatest competitive advantage in collecting their mill residues, followed by Blue Lake (table 5). DG Fairhaven had the least acreage of exclusive timberland (26,278 acres) (table 4) and depended primarily on sawmills for its supply (Bob Marino, DG Fairhaven Power LLC, pers. comm.). Blue Lake, with a total MRP of 3.07, also received most of its supply from sawmills (W. Nystrom, pers. comm.).
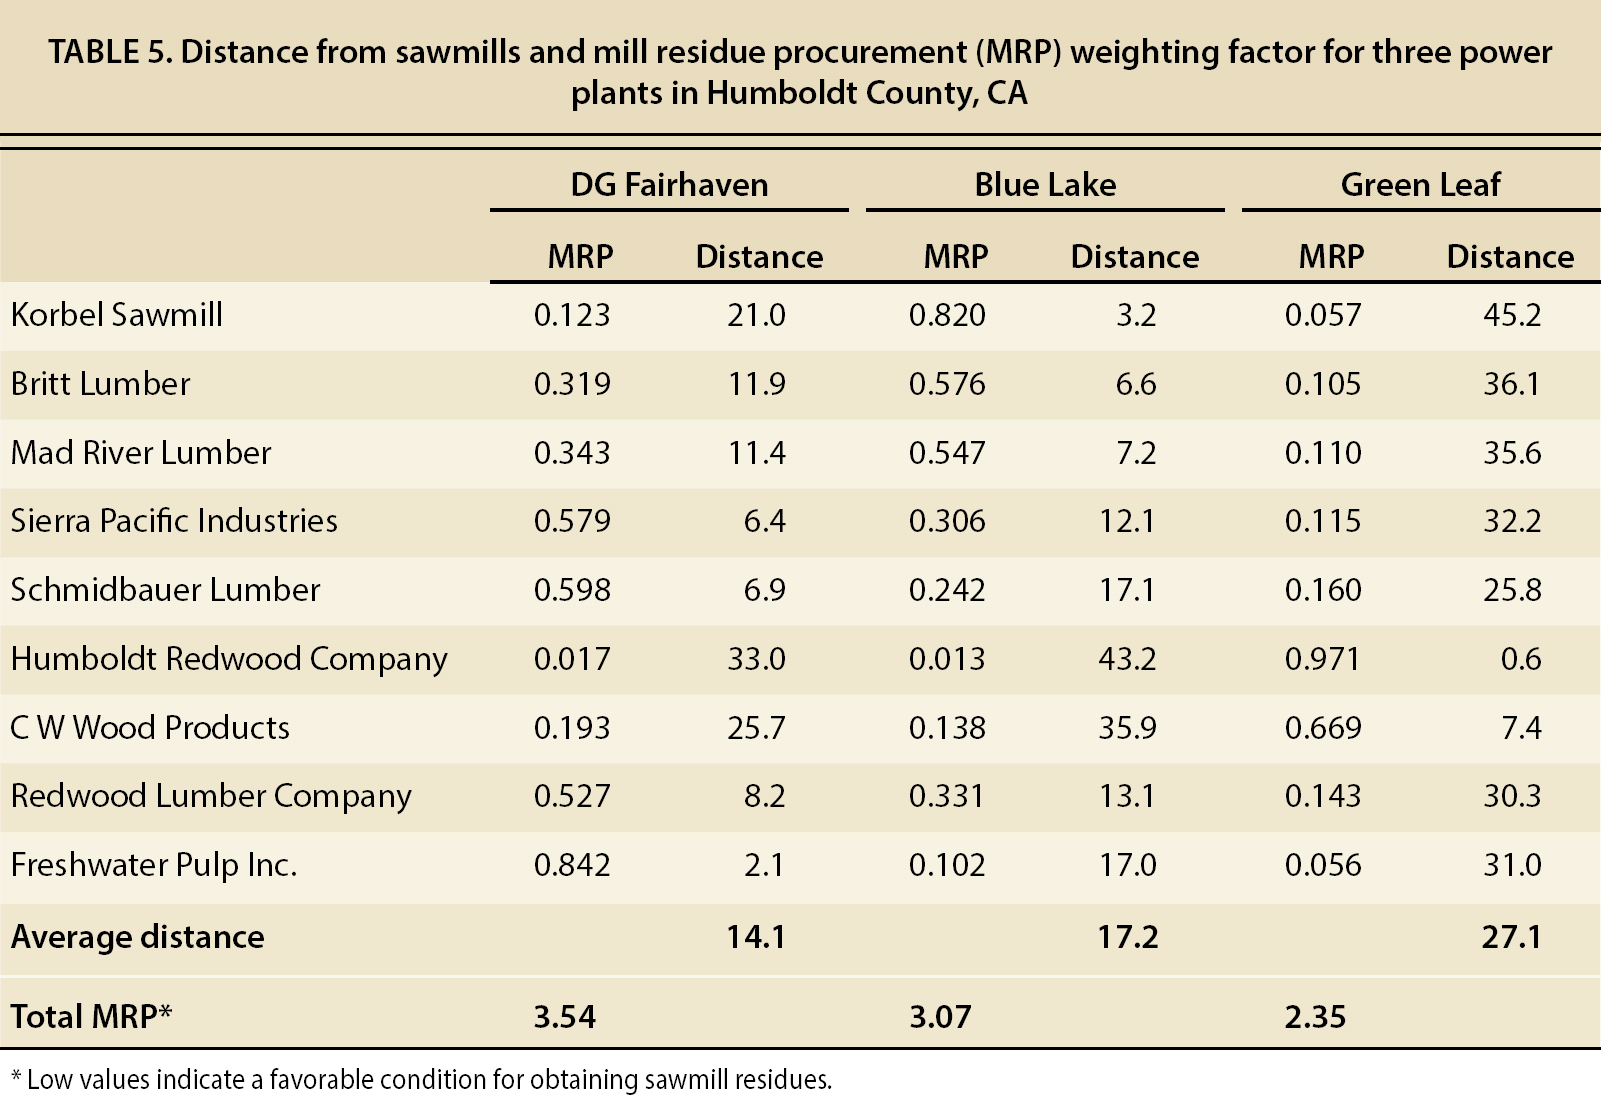
TABLE 5. Distance from sawmills and mill residue procurement (MRP) weighting factor for three power plants in Humboldt County, CA
Transportation model economics
Approximately 303,000 BDT of forest residues are available from Humboldt County's timberlands annually (Hohl et al. 2013). The U.S. Department of Energy reported $47/BDT as a target delivered feedstock price for 2012 to make biomass-based processes competitive with fossil fuel-based energy production (Wilkerson et al. 2008). Of this, the agency allocated $10/BDT to the landowner, leaving $37/BDT for collection and transportation (Greene et al. 2011).
In Humboldt County, the wood residues supplied to the power plant were priced around $50/BDT (W. Nystrom, pers. comm.). In the $30/BDT TCZ, there was only room to accommodate $20 to $30/BDT for the rest of the biomass harvesting operation. However, the stump-to-truck cost in industrial timberlands could account for about $26/BDT for biomass recovery operations (Bisson et al. 2015) and $30/BDT for biomass harvesting along with sawlog operations in Northern California (Harrill and Han 2012). Costs for mobilization of equipment, overhead and profit allowance were not included in the stump-to-truck cost figures. Hence, under present market conditions, we do not expect that contractors will operate outside the $30/BDT TCZ, especially in the three national forests, unless they are compensated in addition to the price paid by the power plant.
However, major industrial landowners often do compensate biomass contractors to remove forest residues from their property due to fire hazards and site preparation requirements. In Humboldt County's national forests, compensation has taken the form of stewardship funds or other grants for reducing the hazardous fuel loads and promoting biomass energy; the funds paid for long distance travel costs and allowed contractors to profitably supply woody biomass. There are similar examples from neighboring Siskiyou County, where biomass suppliers have delivered raw materials to power plants almost 75 miles away (Jim Johnson, Jim Johnson Logging, pers. comm.). In addition, a decrease in in-woods operational costs or fuel costs, or an increase in market price, could open up more areas for utilization. Harrill and Han (2012) found that a $1/gallon increase in the price of diesel could result in a $2.06/BDT increase in the stump-to-truck costs associated with a woody biomass project in Northern California; correspondingly, a drop in the fuel price would reduce stump-to-truck costs.
To evaluate the total cost of delivery (round-trip) from timberlands to power plants, we conducted a sensitivity analysis using a unit cost of $0.24/BDT-mile (Bisson et al. 2015) on distance traveled and the stump-to-truck biomass cost (table 6). As the stump-to-truck cost increased, the accessible distance to the timberlands decreased, and total delivery cost increased. Furthermore, this analysis confirmed that within a given TCZ, profit margins for contractors are directly determined by the type and efficiency of operation.
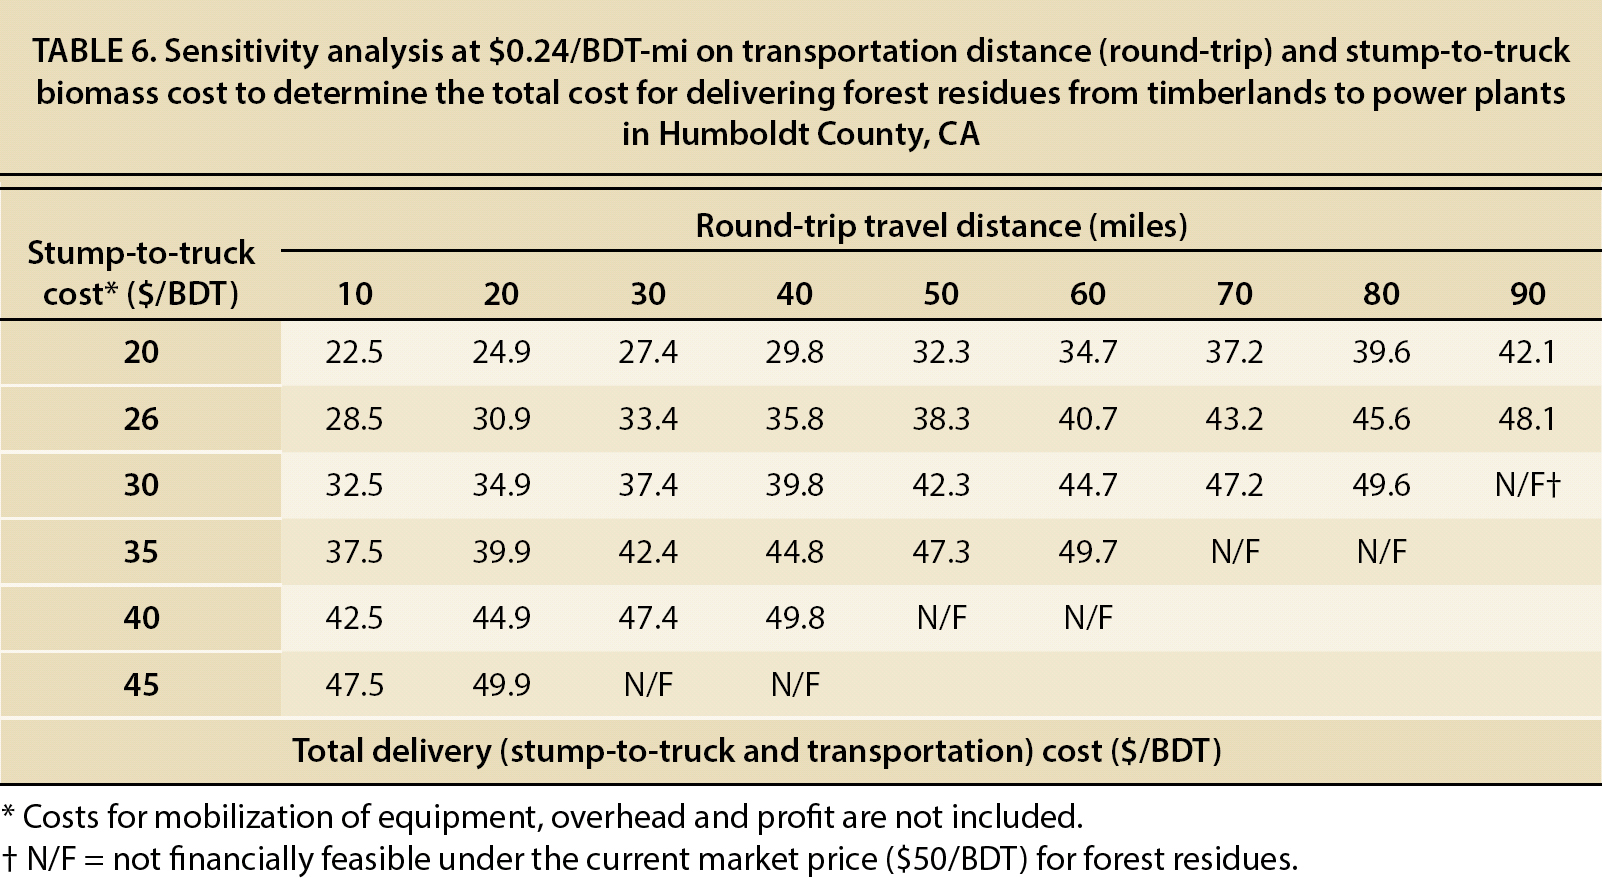
TABLE 6. Sensitivity analysis at $0.24/BDT-mi on transportation distance (round-trip) and stump-to-truck biomass cost to determine the total cost for delivering forest residues from timberlands to power plants in Humboldt County, CA
Competition for wood residues
Areas at high risk of competition, or hot spots, were identified throughout the county based on transportation distance and road types. The $20/BDT TCZ was subject to more competition among the power plants because it had the highest percentage of timberland shared (17%) (table 4). A contractor working within this area had the choice to supply forest residues to any of the power plants sharing the region. Competition can be further intensified by an increase in a plant's capacity or the entry of an additional biomass consumer, such as another bioenergy facility, a pulp mill, or compost and mulching facilities.

In Humboldt County, Blue Lake Power shut down for almost a decade before being re-commissioned in 2009; its closure was attributed to an increase in price of biomass feedstock and decrease in the price of electricity (W. Nystrom, pers. comm.). In addition, when the Green Leaf power plant temporarily shut down in 2012, the company stated that the primary reason for the shutdown was “inability to secure stable fuel supplies” (Sims 2012). These cases show that the wood residue utilizers in the county were facing a shortage of raw materials at an economical price (W. Nystrom, pers. comm.). It should also be noted that Green Leaf, located in the southern portion of the biomass power production hub, had almost 692,172 acres of exclusive timberland zone within the first three TCZs, making it the largest holder of exclusive timberland (table 4). However, because forest biomass harvesting operations were seasonal, in some cases operating roughly 100 days per year mainly due to weather conditions (Steve Morris, Steve Morris Logging, pers. comm.), power plants could not entirely depend on this resource. DG Fairhaven, which has the highest total MRP, did not need to shut down even though it had the least acreage of exclusive zone. Being the oldest plant in the region, the plant could secure long-term contracts with sawmills for stable feedstock supplies.
Blue Lake Power in Humboldt County, which utilizes 87,500 BDT per year to generate 10 MW of electricity, receives most of its biomass from sawmills.
Having the highest average distance to the sawmills, the total MRP for Green Leaf was much lower than the MRP for the other two power plants (table 5); as a result, the plant had to pay comparatively more to access mill residues produced in the county. However, all three power plants were within an economically feasible distance to sawmills. Further analysis on competition, such as a target market share analysis, could have revealed more information on the supply chain based on the type of sawmill residues produced and total production. Additionally, the analysis used distance (miles) as the determining factor rather than “time” because the latter required historic traffic data that was not available for Humboldt County.
Exclusive timberland zones were created to understand a power plant's supply advantage compared to others. The zone was determined by extracting areas that were not shared by the other power plants (or was solely available to a particular power plant) within each TCZ. The $10/BDT TCZ had the highest percentage of exclusive land (91.7%) compared to the total acreage in the TCZ, whereas the $20 BDT/TCZ had most land coverage (table 4).
However, given the annual production of wood residues in the county of over 711,000 BDT and a total power plant consumption of around 472,500 BDT/year, the market is relatively safe from competition at present (W. Nystrom, pers. comm.). Furthermore, major industrial timberland owners in the county have indicated that they could generate up to three times more if there was demand (Ewald 2013).
Extending the results
The transportation cost zone concepts developed in this study could be applied to other locations where more than one power plant competes for the same raw materials.
Traditionally, forest residues are grinded, chipped, bundled or crushed to increase bulk density and enhance the transportation efficiency. Apart from these, new evolving technologies that densify woody biomass, such as torrefaction, briquetting and densification, can significantly increase the energy value of the raw materials. These energy-densified products could thereby extend the TCZ up to 100 miles (Mayhead 2010).
Citations
Biomass power plant feedstock procurement: Modeling transportation cost zones and the potential for competition

