


All Issues
Soil suitability index identifies potential areas for groundwater banking on agricultural lands
Publication Information
California Agriculture 69(2):75-84. https://doi.org/10.3733/ca.v069n02p75
Published online April 01, 2015
NALT Keywords
Abstract
Groundwater pumping chronically exceeds natural recharge in many agricultural regions in California. A common method of recharging groundwater — when surface water is available — is to deliberately flood an open area, allowing water to percolate into an aquifer. However, open land suitable for this type of recharge is scarce. Flooding agricultural land during fallow or dormant periods has the potential to increase groundwater recharge substantially, but this approach has not been well studied. Using data on soils, topography and crop type, we developed a spatially explicit index of the suitability for groundwater recharge of land in all agricultural regions in California. We identified 3.6 million acres of agricultural land statewide as having Excellent or Good potential for groundwater recharge. The index provides preliminary guidance about the locations where groundwater recharge on agricultural land is likely to be feasible. A variety of institutional, infrastructure and other issues must also be addressed before this practice can be implemented widely.
Full text
California is experiencing its third major drought since the 1970s, and projections suggest that such episodes will become longer and more frequent in the second half of the 21st century (Barnett et al. 2008; Cayan et al. 2010). Droughts place more demand on groundwater resources to buffer surface water shortfalls. Ordinarily, about 30% of the water applied to crops in California (roughly 34 million acre-feet per year) is supplied by groundwater sources, but in times of drought the proportion can increase to as much as 60% (Megdal 2009). As a result, groundwater levels fall during droughts (Ruud et al. 2004). If groundwater is not replenished during wet years, long-term overdraft occurs. From 2005 through 2010, average annual overdraft in the Central Valley was estimated to be between 1.1 and 2.6 million acre-feet (Department of Water Resources 2015).
Two recent trends in California have tended to increase the rate of groundwater overdraft in agricultural regions.
First, over the past two decades, irrigation technologies have significantly improved water use efficiencies (Canessa et al. 2011; Howell 2001; Orang et al. 2008; Tindula et al. 2013; Ward and Pulido-Velazquez 2008). Where surface water is used for irrigation, a consequence of applying less water is that groundwater recharge is diminished because of a reduction in deep percolation of excess water.
Second, expanding worldwide markets have driven significant expansions of nut and wine grape acreage. For example, the almond acreage in California has doubled, to roughly 1 million acres, since 1994 (NASS 2014). Much of this expansion has occurred in the San Joaquin Valley where rates of rainfall and natural groundwater recharge are low. This shift in cropping systems to high value perennial crops reduces the flexibility of agricultural water demand because the economic costs of not irrigating are severe. Inflexible demand has made agriculture even more reliant on groundwater during dry periods when surface water resources are curtailed.
Groundwater recharge
Natural groundwater recharge is the predominant source of groundwater replenishment in almost all basins. It is typically unmanaged and can be slow. Water percolates into aquifers from a variety of surface water sources including precipitation, streams, rivers, lakes, surface water conveyance facilities — such as unlined canals — and applied irrigation water. Natural recharge also may occur from horizontal subsurface inflow from one part of a groundwater basin to another. Natural recharge requires no dedicated infrastructure or land.
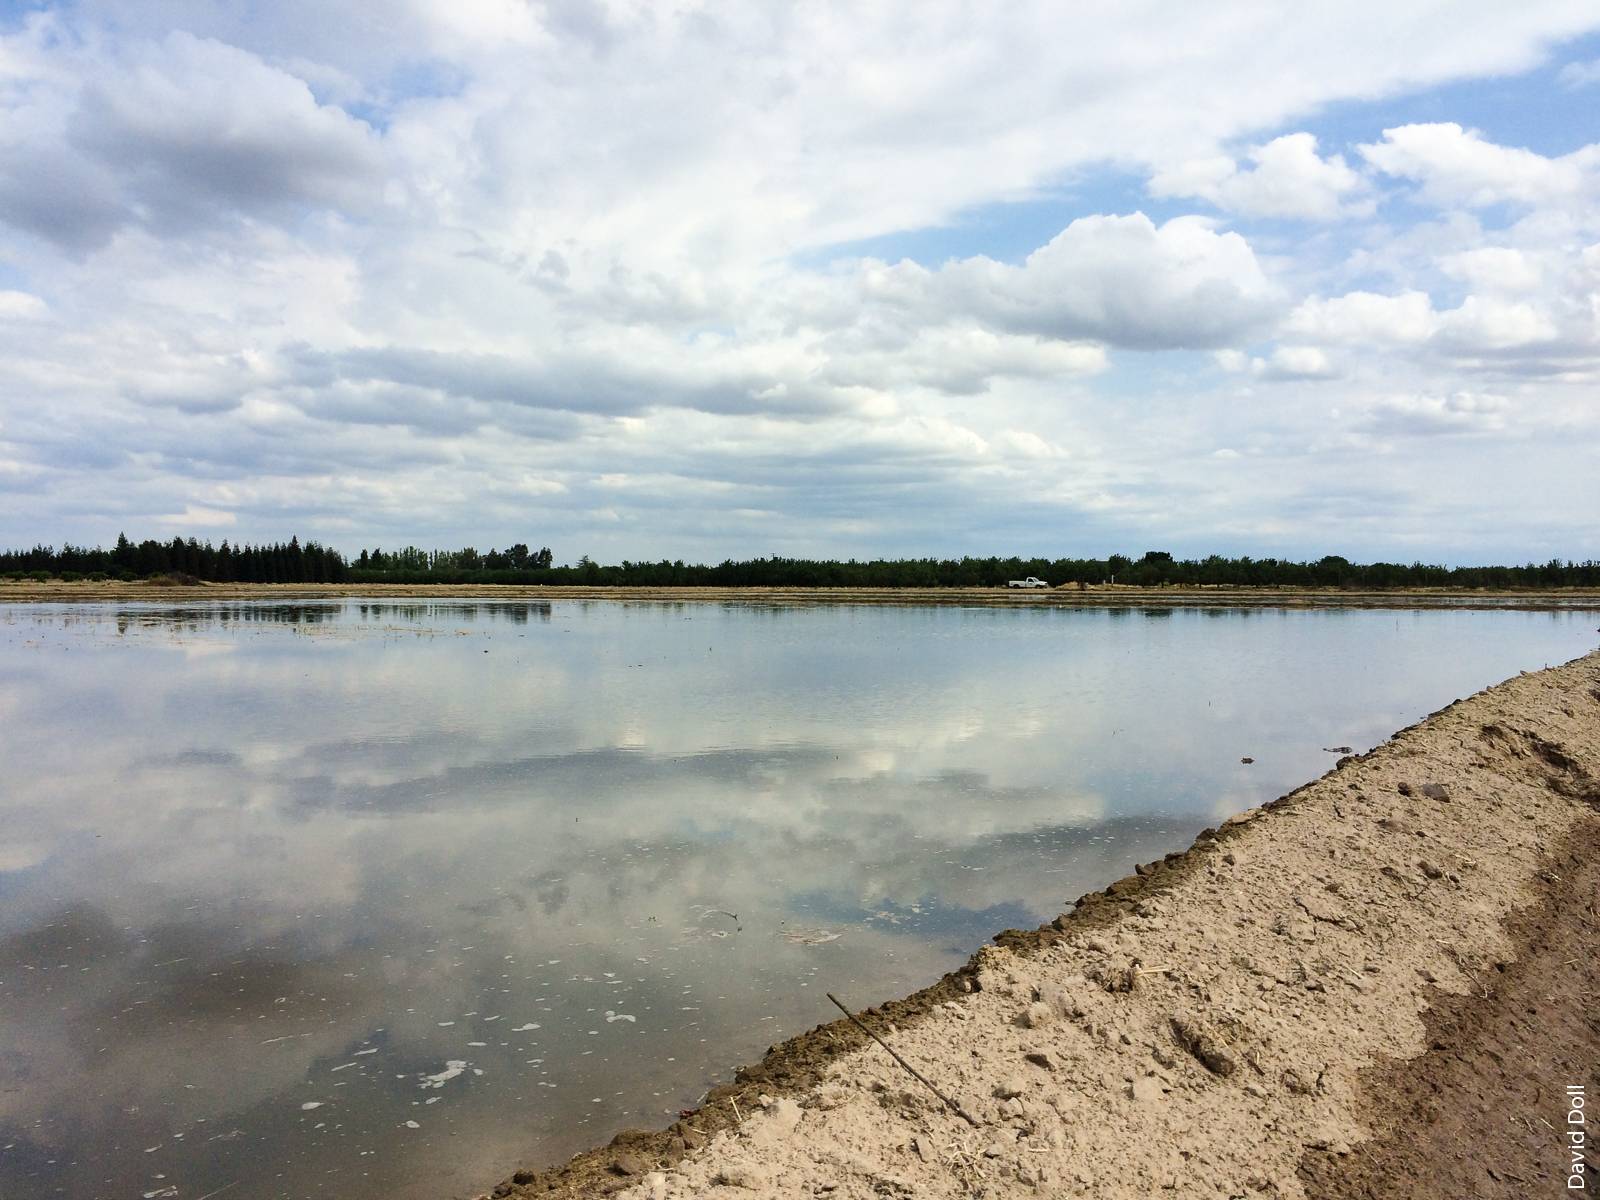
During fallow or dormant periods, agricultural lands have the potential to serve as percolation basins for groundwater recharge.
Groundwater banking is a management strategy that stores surface water in aquifers for future withdrawal. It expands managed water storage capacity, which in California consists mainly of surface water reservoirs. Groundwater banking is achieved through the intentional application of surface water. During hydrologic cycles when surface water is abundant, extra surface water can be “deposited” in a groundwater bank by application to constructed percolation basins, through injection wells, or through joint management of rivers and groundwater to effect riverbed infiltration into underlying aquifers.
A key limitation to groundwater recharge is the lack of suitable percolation basins available for deliberate flooding. In this paper, we consider a new strategy for groundwater banking that involves applying water to agricultural lands outside of the usual irrigation season for the specific purpose of recharging a groundwater basin. Given the millions of acres of irrigated farmland in California, using agricultural lands as percolation basins has the potential to increase groundwater recharge during wet periods when surface water is available.
In California, one potential source of water for recharge on agricultural land is river floodwaters, because surface water rights may be easily re-negotiated (or may not apply) for the excess water. This floodwater approach has the dual benefit of withdrawing large amounts of water from a river that is at or near flood stage and reducing downstream flood risks (Bachand et al. 2011). The frequency and intensity of river flooding is difficult to forecast. For instance, flood flows on the Kings River from 1975 to 2006 had an average reoccurrence interval of 2 to 3 years, though flooding has not occurred in recent years (Bachand et al. 2011). As the climate warms, flooding may become more frequent and extreme as a result of episodic snowmelt events driven by warm winter rains. Recycled water (highly treated wastewater) is another potential source.
There are a variety of institutional and other barriers to widespread agricultural groundwater banking in California. Water rights for operation of aquifers as reservoirs are challenging to navigate; water conveyance infrastructure has limited capacity; regional planning to capture river flood waters may be difficult to organize; fields with high percolation rates at the surface may be underlain by low-percolation layers that slow or block the recharge of deeper aquifers; it can be difficult to assess how much capacity a given aquifer has to store banked groundwater; certain crops and certain stages of crop growth do not tolerate flooded conditions; and the quality of water recharged to an aquifer via agricultural land may be degraded due to excessive leaching of contaminants from soil such as pesticides and nitrates.
To date, few well-documented trials of groundwater banking have been conducted on agricultural land. Since nearly all agricultural land is privately owned and operated, participation in groundwater banking programs depends on cooperation from the landowner or land manager. Therefore, a clear understanding of the risks and best practices associated with this practice is paramount.
In this study, we take a first step toward better understanding opportunities to recharge groundwater using agricultural landscapes in California by identifying and mapping the soil and topographic conditions most conducive to groundwater recharge.
Groundwater banking index
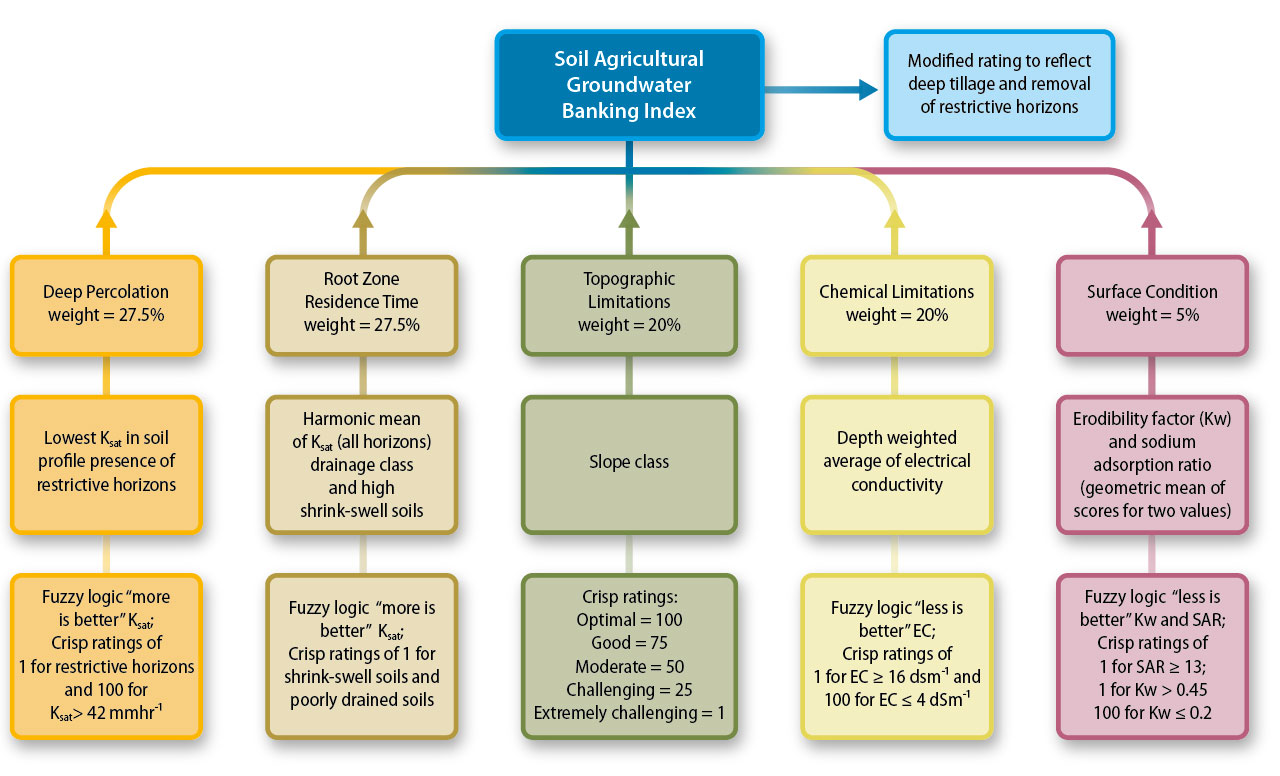
This study developed a Soil Agricultural Groundwater Banking Index (SAGBI) that provides a composite evaluation of soil suitability to accommodate groundwater recharge while maintaining healthy soils, crops and a clean groundwater supply. The SAGBI is based on five major factors that are critical to successful agricultural groundwater banking: deep percolation, root zone residence time, topography, chemical limitations and soil surface condition (see sidebar below).
Five factors that determine the feasibility of groundwater recharge on agricultural land
- Deep percolation: Soils must be readily able to transmit water beyond the root zone (1.5 m, 5 ft).
- Root zone residence time: The duration of saturated/near saturated conditions after water application must be acceptable for the crops grown on lands under consideration for groundwater banking throughout the entire crop root zone.
- Topography: Slopes that negatively influence the even distribution of water will be more difficult to manage.
- Chemical limitations: High soil salinity may result in saline leachate (poor water quality) that must be avoided to protect groundwater quality.
- Soil surface condition: Certain soils may be susceptible to compaction and erosion if large volumes of water are applied. Surface horizons with high sodium are prone to crusting that may contribute to decreased surface infiltration rates.
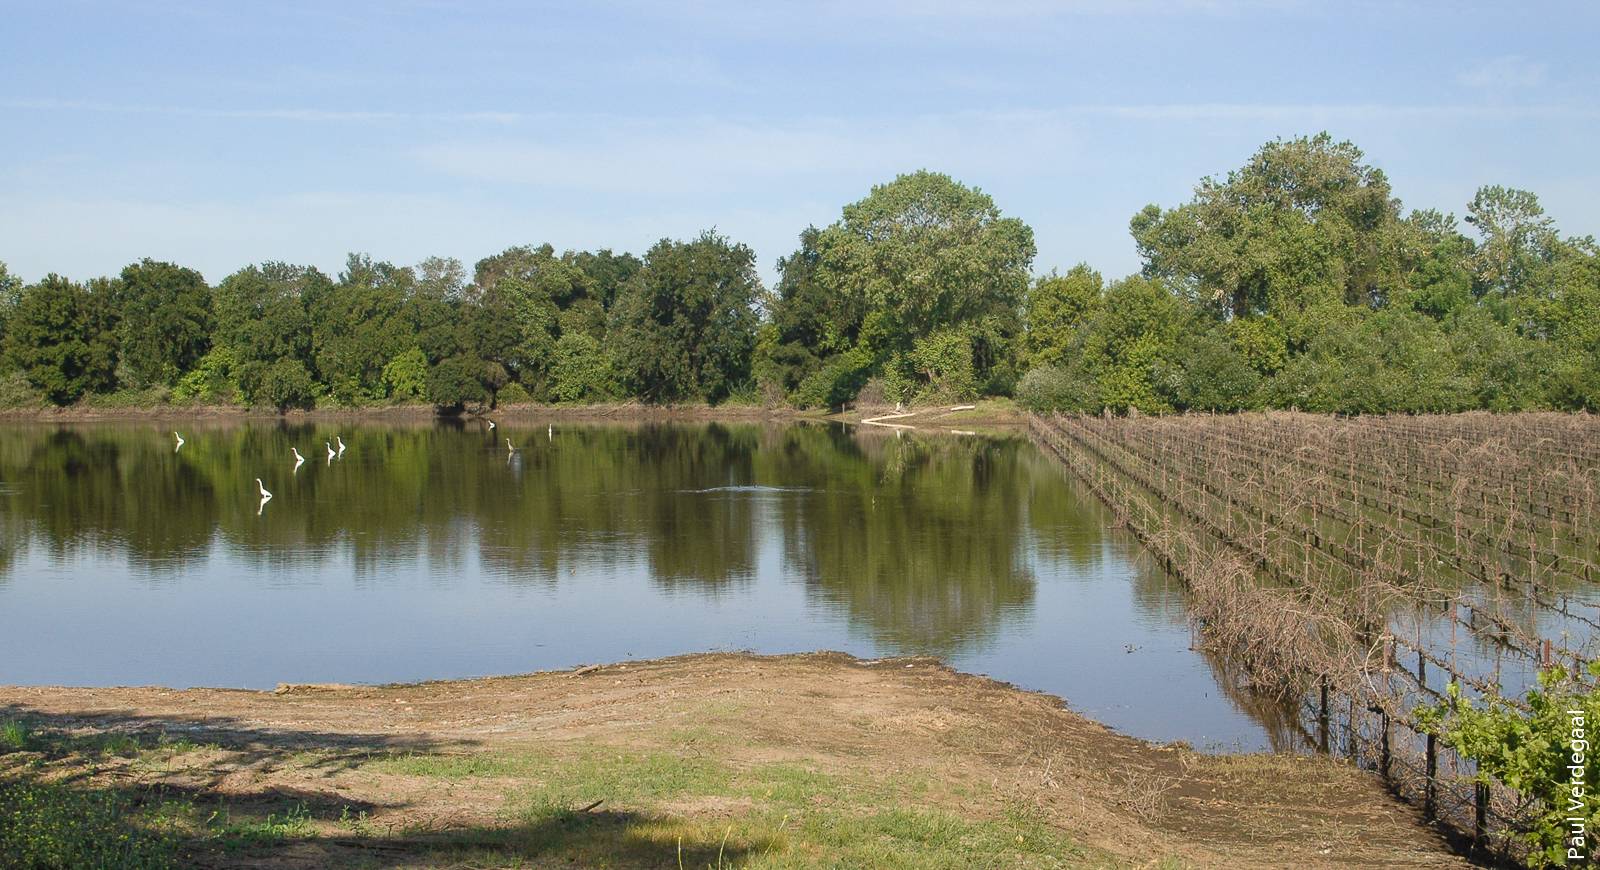
Wine grapes are especially tolerant of flooding. This field flooded following heavy rains in 2006; while the crop was reduced that year, the vines survived and are thriving today.
We modeled each of the five factors using U.S. Department of Agriculture Natural Resources Conservation Service (USDA-NRCS) digital soil survey data. The suitability of each factor was expressed through a scoring system based on a combination of fuzzy logic functions and crisp ratings (see sidebar below).
Fuzzy logic and crisp scores
Fuzzy logic is a method by which membership to a class or condition can be partial (maybe) rather than discrete (true or false; or A or B). Thus, fuzzy logic allows reasoning to be approximate rather than fixed and exact. Variables are evaluated via fuzzy logic scores that range between 1 and 100, reflecting the degree of vagueness of a membership being completely false (1) or completely true (100). Fuzzy logic is appropriate for this model analysis because in agricultural landscapes, the above five factors are relative as opposed to absolute, which poses challenges in quantifying them using the raw data.
We used fuzzy logic statements such as (1) “more is better” where the score increases with higher factor values; (2) “less is better” where the score increases as factor values decrease; and, (3) “optimum range” where the score is highest across a certain range of factor values and decreases above and below that range. Using the suitability of root zone residence time as an example, the fuzzy logic statement “less is better” enables the suitability of that factor to vary between 1 and 100 (from unsuitable to optimally suitable) rather than having to choose between absolutes, e.g., suitable (true) or not suitable (false). Crisp ratings are defined scores that apply to a well-understood system, and hence do not require fuzzy scoring. For example, slope classes as reported in soil surveys reflect limitations of common practices such as irrigation and cultivation practices and are scored in our model with crisp ratings.
Deep percolation factor.
Successful groundwater banking depends on a high rate of water transmission through the soil profile and into the aquifer below. A high percolation rate is especially important if floodwaters are the water source used because floodwaters are available for diversion over a narrow time frame. The deep percolation factor is derived from the saturated hydraulic conductivity (Ksat) of the limiting layer (the soil horizon with the lowest Ksat). Saturated hydraulic conductivity is a measure of soil permeability when soil is saturated. Many soils in California have horizons (layers) with exceptionally low Ksat values that severely limit downward percolation, such as cemented layers (duripan, petrocalcic), claypans (abrupt increases in clay content) and strongly contrasting particle size distributions. Soils with these horizons were given crisp scores of 1. For other soils, a “more is better” fuzzy logic rating curve was applied to a soil profile's lowest Ksat to score the likelihood of deep percolation (fig. 1).
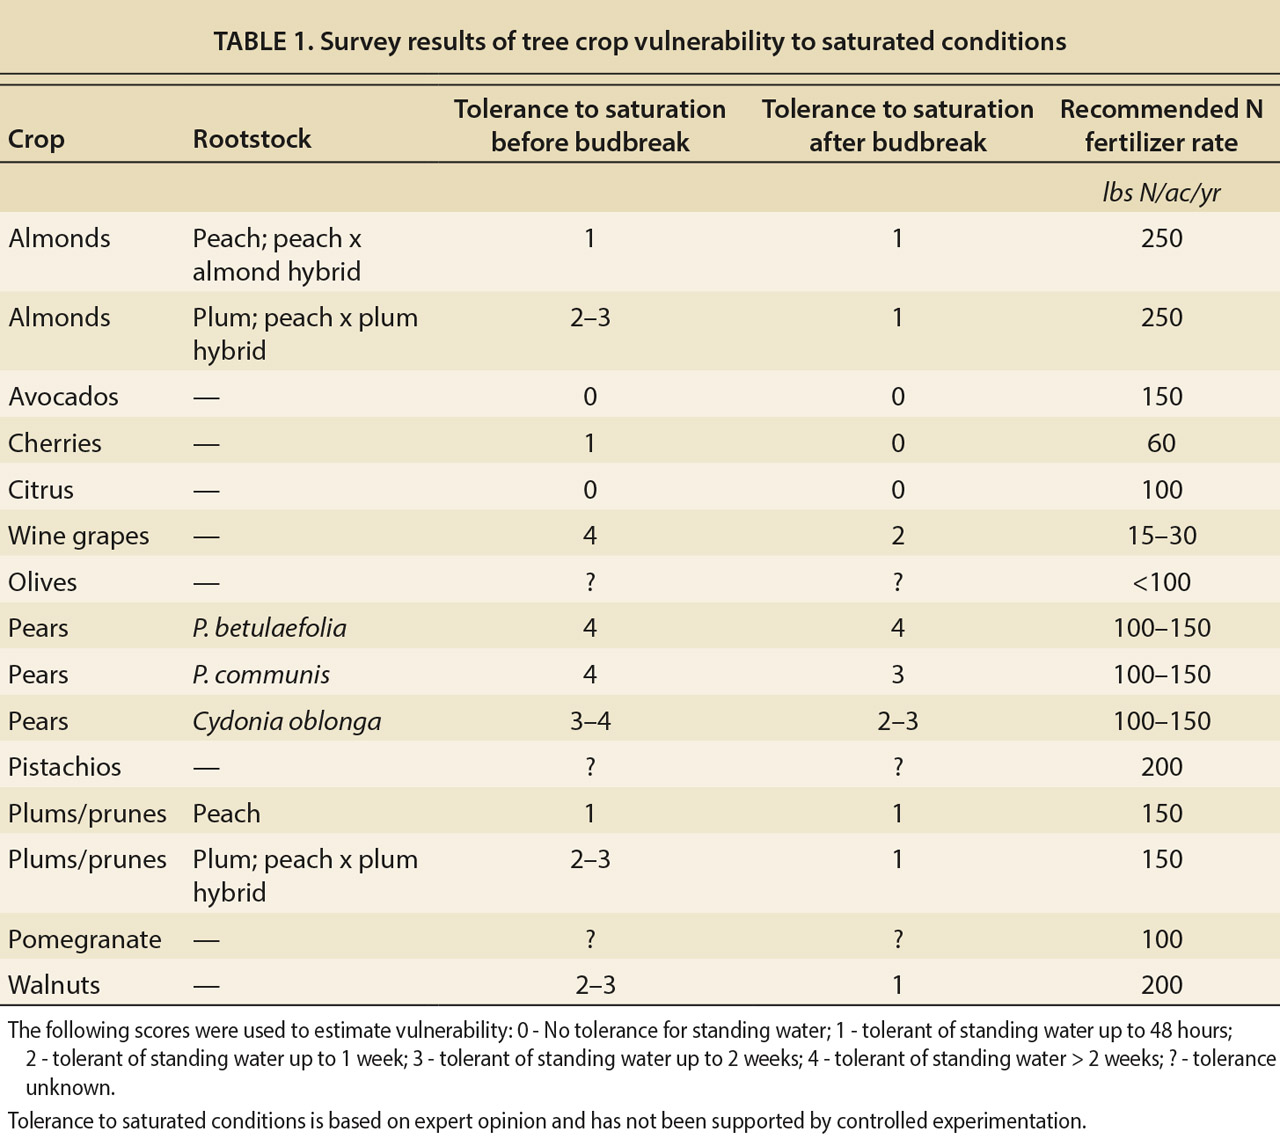
Root zone residence time factor.
Prolonged duration of saturated or nearly saturated conditions in the root zone can cause damage to perennial crops, and in some cases, crop loss (table 1). About one-third of California's irrigated cropland is occupied by perennial crops and vines. Table 1 provides estimates of tolerance to saturation for some common tree and vine crops before and after budbreak compiled through a survey of UC ANR Cooperative Extension (UCCE) commodity experts. Annual crops were not included in the survey because we assumed that these fields generally would be fallow during times of excess surface water availability. In general, crops become prone to damage after budbreak and there is a range in tolerance among crops and rootstocks (table 1). For example, wine grapes and pears may be able to withstand more than two weeks of saturated conditions before budbreak, while avocados and citrus have no tolerance.
Our survey identified that many crops are unable to withstand long periods of saturated conditions in the root zone. To account for this potential adverse outcome, we included in the model a saturation residence time factor for soils. The root zone residence time factor estimates the likelihood of maintaining good drainage within the root zone shortly after water is applied. This rating is based on the harmonic mean of the Ksat of all horizons in the soil profile, soil drainage class and shrink-swell properties. The harmonic mean is typically used when reporting the average value for rates and tends to be lower than a standard average. Poorly drained soils and soils with high shrink-swell received the lowest scores with a crisp rating of 1. All other soils were scored using a fuzzy logic rating curve of “more is better” for Ksat (fig. 1).
Topographic limitations factor.
Agricultural groundwater banking will likely be implemented by spreading water across fields. Level topography is better suited for holding water on the landscape, thereby allowing for infiltration across large areas, reducing ponding and minimizing erosion by runoff. Ranges in slope percent were used to categorize soils into four slope classes: Optimal (slope classes 0%-1% and 0%-3%), good (slope classes 0%-5% and 2%-5%), moderate (slope classes 0%-8% and 3%-8%), challenging (slope classes 5%-8%, 3%-10% and 5%-15%), and extremely challenging (slope classes 10%-30% and 15%-45%) (fig. 1). Topographic limitations were scored using crisp ratings that generally reflect the USDA-NRCS slope classes because these classes were designed in consideration of limitations for standard agricultural management practices (Soil Survey Division Staff 1993).
Chemical limitations factor.
Salinity is a threat to the sustainability of agriculture and groundwater in California, especially along the west side of the Central Valley (Kourakos et al. 2012; Schoups et al. 2005), where sediments are derived from marine sediments in the Coast Range. The chemical limitations factor was quantified using the electrical conductivity (EC) of the soil, which is a measure of soil salinity. A fuzzy logic rating curve “optimum and less is better” was used to score chemical limitations. The “less is better” statement implies that soils with low salinity score high and soils with high salinity values score low. Soil profiles with EC < 4 dS/m were considered optimal (score of 100). Beyond this threshold, scores decreased with increasing EC. Soils with EC values above 16 dSm-1 received a score of 1 (fig. 1). A variety of other contaminants such as pesticides and nitrate are also present in agricultural soils. However, because this type of contamination is dependent on management history, the USDA-NRCS soil survey does not document it and we were unable to evaluate it.
Surface condition factor.
Groundwater banking by flood spreading can subject the soil surface to changes in its physical condition. Depending on the quality of the water and depth of water, standing water can lead to the destruction of aggregates, the formation of physical soil crusts and compaction, all of which limit infiltration (Le Bissonais 1996). We used two soil properties to diagnose surface condition, the soil erosion factor and the sodium adsorption ratio (SAR). The surface condition factor was calculated by the geometric mean of fuzzy logic scores from these two properties. A geometric mean is a way to identify the average value of two or more properties that have different ranges in value. SAR values greater than 13 indicate that the soil is prone to crusting. A “less is better” fuzzy logic curve was used to evaluate SAR, where values greater than 13 were assigned a crisp rating of 1, and values of 0 were assigned an optimal rating of 100. Soil surface horizon Kw, the soil erodibility factor of the Revised Universal Loss Equation, was used to estimate the potential soil susceptibility to erosion, disaggregation and physical crust formation (USDA-NRCS 2014). A fuzzy logic rating curve, “optimum and less is better,” was used for scoring the surface condition factor. Kw values < 0.20 were considered ideal (score = 100); beyond this threshold, factor scores decreased with increasing Kw values.
SAGBI calculation.
Each of the five model factor scores was assigned a weight based on its significance to groundwater banking (fig. 1). The SAGBI score was calculated by the weighted geometric mean of the scaled factors. The factors were weighted as follows: Deep percolation (27.5%), root zone residence time (27.5%), topographic limitations (20%), chemical limitations (20%) and surface condition (5%). Factor weights were applied based on expert opinion. Factors with greater relevance to groundwater recharge were weighted more heavily, while factors that may be modified by management, such as surface condition, were given a lower weight. SAGBI scores were categorized into six groups: Excellent, Good, Moderately Good, Moderately Poor, Poor and Very Poor based on the natural groupings of the dataset.
Soils modified by deep tillage.
In recent decades, high value orchard and vineyard crops have expanded onto soil landscapes that contain restrictive horizons. A standard practice for tree and vine establishment on these soils is deep tillage up to a depth of 6 feet to destroy restrictive layers that impede root penetration. This practice increases deep percolation rates and drainage conditions compared to naturally occurring soils. Soils with root- and water-restrictive horizons in California have been altered to the point that they are now considered endangered in the Central Valley (Amundson et al. 2003).
As a result, soil surveys of much of the region — many of which were conducted decades ago — are outdated with respect to alterations by deep tillage. To address this problem, we created an updated soil disturbance map using geospatial analysis. A map of orchard and vineyard crops was created using California Department of Water Resources land use maps (issued between 2001 and 2011) and aerial imagery from the National Agricultural Imagery Program (NAIP) and Google Earth (2012 to 2014). This file was overlain in a geographic information system with a map of soils with water-restrictive horizons. We assumed that all tree and vine cropland with restrictive soil layers (based on soil survey data) has been modified by deep tillage, generating an updated map of modified soils.
To reflect the mixing of soil horizons in the calculation of the deep percolation factor, the depth-weighted average of Ksat for the entire soil profile was used in place of the lowest Ksat for each profile. We reduced the deep percolation factor rating for soils with claypans by 20% to reflect the risk that modified claypans will reform, which can occur in as little as four years in soils with weak structure (White et al. 1981). Cemented layers (not including bedrock) were assumed to have been removed by deep tillage and were not included in the weighted average. Data below the restrictive horizon was included in the depth-weighted average if populated in the database. The depth-weighted average of Ksat was used in place of the harmonic mean to estimate hydraulic conductivity for the root zone residence time factor.
Map unit aggregation.
SAGBI scores were calculated for most agricultural soils populated in the USDA-NRCS Soil Survey Geographic Database (SSURGO). Soil survey delineations represent map units, which often contain more than one soil type. The map units range in size from 5 acres to roughly 500 acres. To create a regional map, each map unit was scored with the SAGBI value using the soil component that comprised the largest percentage of the map unit area. If there was a tie (i.e., one map unit containing two components of equal area), the most limiting (lowest) SAGBI score was chosen for the map unit.
Spatial patterns of SAGBI
Our study area included over 17.5 million acres of agricultural land (irrigated and non-irrigated) as identified by the state Farmland Mapping and Monitoring Program. Based on our initial modeling, which did not initially consider the effects of deep tillage, soils in the Excellent, Good and Moderately Good suitability groups comprised over 5 million acres, or 28% of the study area (fig. 2 and table 2). These highly rated soils were most abundant on broad alluvial fans on the east side of the Central Valley stemming from the Mokelumne, Stanislaus, Merced, Kern and Kings rivers (fig. 2). Excellent, Good and Moderately Good ratings are also found throughout much of Napa, Salinas and Santa Maria valleys and in patches along the Russian River in Mendocino and Sonoma counties and the northern parts of the Coachella Valley. The best soils — the Excellent and Good groups — occupied about 3.2 million acres, representing 18% of the study area (fig. 2 and table 2). Some areas of Good and Excellent ratings were found on sandy floodplains of rivers and streams, especially along the Sacramento and Feather rivers.
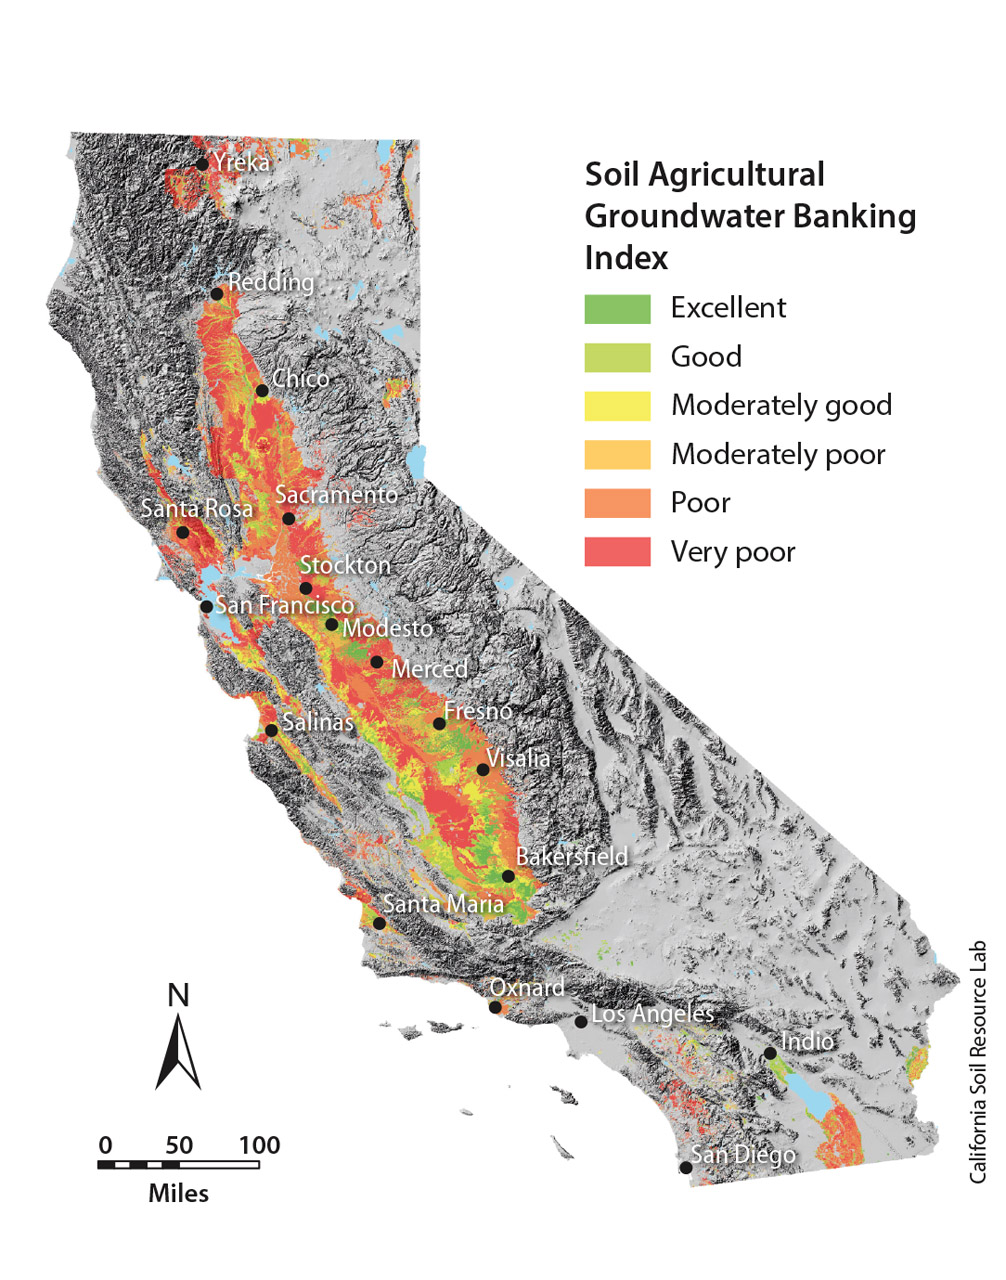
Fig. 2. Spatial extent of Soil Agricultural Groundwater Banking Index suitability groups when not accounting for modifications by deep tillage.

TABLE 2. Summary of the areal extent of Soil Agricultural Groundwater Banking Index groups generated from soil survey data
Floodplains may not be ideal locations for groundwater banking because of the potential for applied water to flow, by sub surface transport, into rivers and streams. Thus, these systems should not be prioritized for groundwater banking unless it is known that the surface water bodies are losing streams — that is, surface water bodies that discharge to groundwater. Most major streams that traverse the San Joaquin Valley, for instance, are known to be losing streams.
Extensive Moderately Good areas were mapped on the western margins of the San Joaquin and Sacramento valleys where soils tend to be finer textured and sometimes salt-affected (saline). Moderately Good groups were also mapped in basin alluvium where low energy flood events have deposited fine sediments. Moderately Good groups occupied 1,786,972 acres or 10% of the study area. These areas may require careful consideration for groundwater banking.
The majority of land in the study area (72% or ?12.6 million acres) was classified as Moderately Poor, Poor or Very Poor SAGBI groups (fig. 2 and table 2). Soils with low SAGBI scores were abundant throughout the basin margins of the Sacramento and San Joaquin valleys as well as across land interstratified between recent alluvial fan deposits of the Mokelumne, Tuolumne, Stanislaus, San Joaquin, Kings and Kern rivers. Very Poor and Poor ratings are also found on the northern portions of the Salinas and Santa Maria Valleys and throughout most agricultural regions in Sonoma County and southern parts of the Coachella Valley.
Of the SAGBI components, the deep percolation factor was limiting over the greatest area (fig. 3A). These limiting conditions arise from different characteristics of soils. For example, old, highly developed soils found along the margins of the Central Valley contain water-restrictive horizons (either cemented hardpans or claypans). The center of the valley contains young soils with fine (clay-rich) texture throughout the soil profile. Both of these soil landscapes contain at least one soil horizon with low permeability. In contrast, high deep percolation scores were found on coarse-textured soils derived from recent (e.g., < 80,000 years) alluvial fans with drainages sourced in granitic terrain of the Sierra Nevada and the Salinian block within the Coast Range.
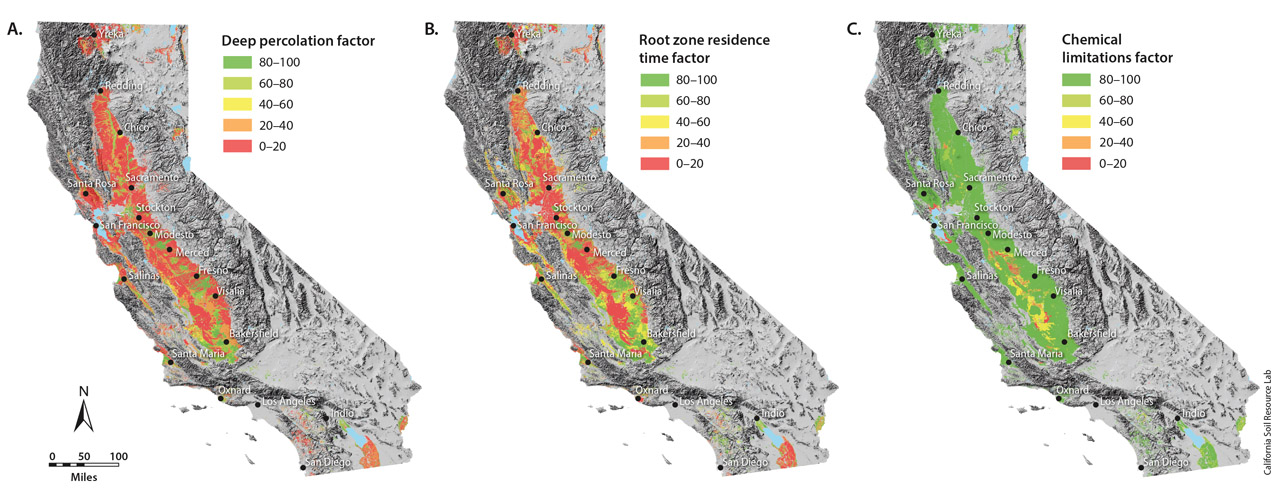
Fig. 3. Spatial extent of Soil Agricultural Groundwater Banking Index factors (A) deep percolation, (B) root zone residence time and (C) chemical limitations.
Areas limited by the root zone residence factor typically had soils with uniformly fine texture throughout the soil profile and poor drainage. Poorly and very poorly drained soils have properties or conditions that promote saturation in the upper parts of the soil profile, such as high clay content, water restrictive layers or regionally shallow water tables. The least suitable soils in this factor were those with poor drainage or high shrink-swell properties. Low scores for root zone residence factor were widespread along the west side of the San Joaquin and Sacramento valleys in soils weathering from Coast Range alluvium (fig. 3B). Poor drainage and fine textured soils were also found in the basin alluvium towards the center of valleys. Low scores for this factor were also found on alluvial fans that have drainages confined to the metamorphic portions of the Sierra Foothills such as the Calaveras River fan, which tend to have fine textured sediments compared to fans sourced in granitic terrain in the high Sierra Nevada.
Chemical limitations had a localized influence on the distribution of SAGBI ratings. Most of the salt-affected soils are present along the west side of the San Joaquin Valley and to a lesser extent along the western margin of the Sacramento Valley (fig. 3C). The distribution of salt-affected soils results from a combination of the salt-rich nature of the marine sediments within the Coast Range and poor drainage conditions on the west side that prevent salts from leaching out of soil. There are other chemical limitations of soils we could not evaluate that would influence groundwater banking, most notably the concentration of residual nitrate in soil. Crops with high nitrogen demand or high residual nitrate in soil in the fall after harvest may not be suitable for groundwater banking (table 1).
The surface condition factor was weighted lowest among all other factors because compaction from standing water can be fixed with tillage and amendments. Low surface condition factor ratings were abundant in soils with loamy surface textures or high SAR and were located throughout the study area but tended to be concentrated on the west side of the Central Valley where sodium-affected soils are common (fig. 4A).
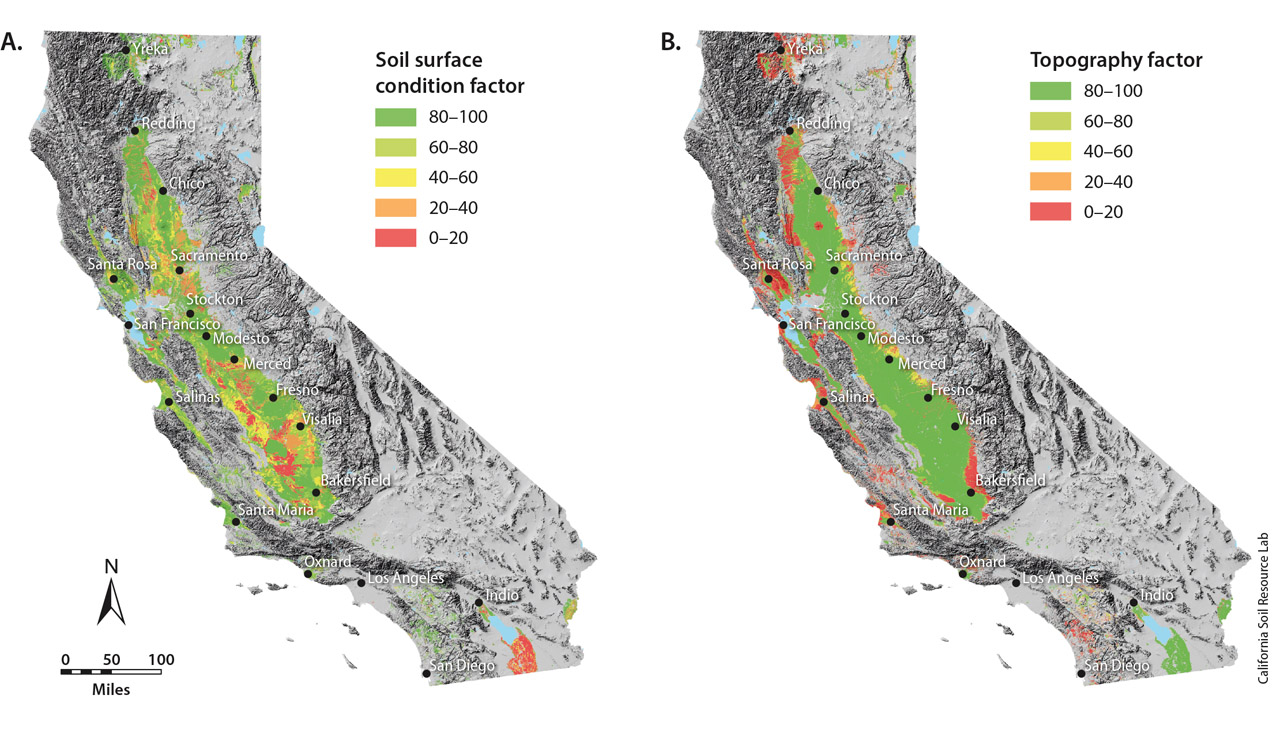
Fig. 4. Spatial extent of Soil Agricultural Groundwater Banking Index factors (A) surface condition and (B) topographic limitations.
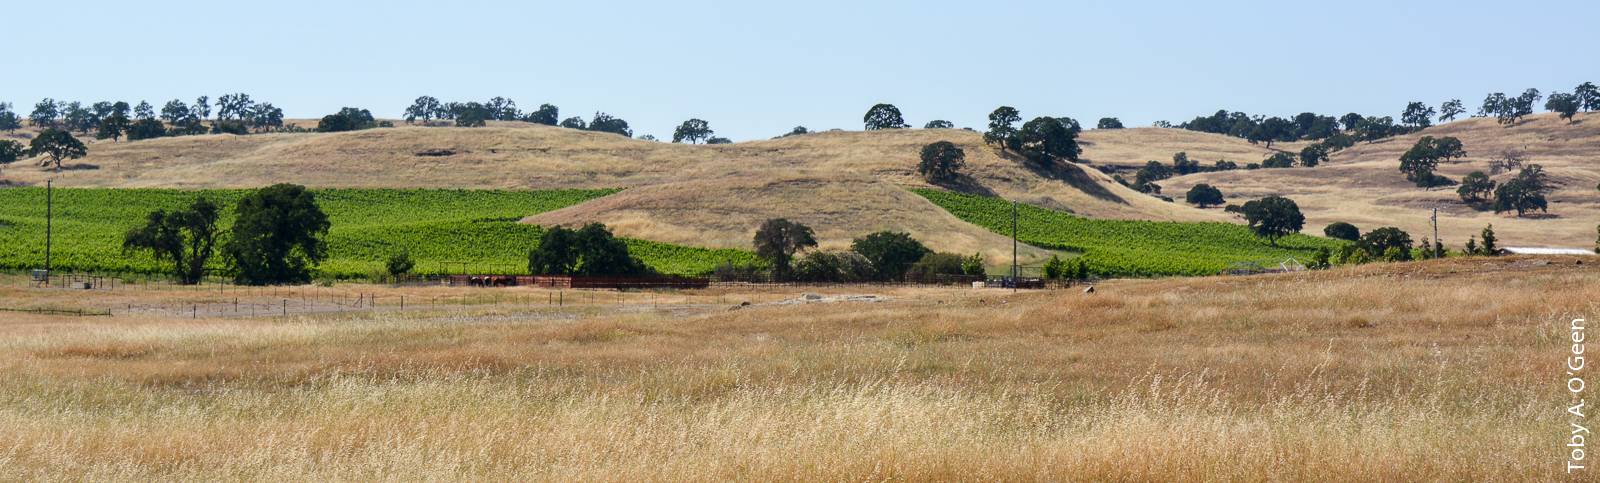
Soil landscapes with low slope factor ratings were limited to the margins of the valleys (fig. 4B). This sloping terrain is a result of uplift by the Coast Range and Sierra Nevada over geologic time scales, which increased slope gradients and accelerated erosion. The natural erosion of the valley margins has created gentle to steeply undulating landforms (see photo, below).
Modified SAGBI scores to reflect deep tillage
When deep tillage on orchard and vineyard croplands was incorporated into the model, the Excellent, Good and Moderately Good SAGBI suitability groups increased from 28% to 31% of the land area, adding 550,494 acres of suitable agricultural land for groundwater banking (table 2). A majority of improved SAGBI scores were located in the eastern San Joaquin Valley and Tulare Basin, where soils with restrictive horizons are common (fig. 5). It is possible that over time, more suitable land for groundwater banking will become available as marginal soils continue to be developed and modified for agricultural purposes (Charbonneau and Kondolf 1993).
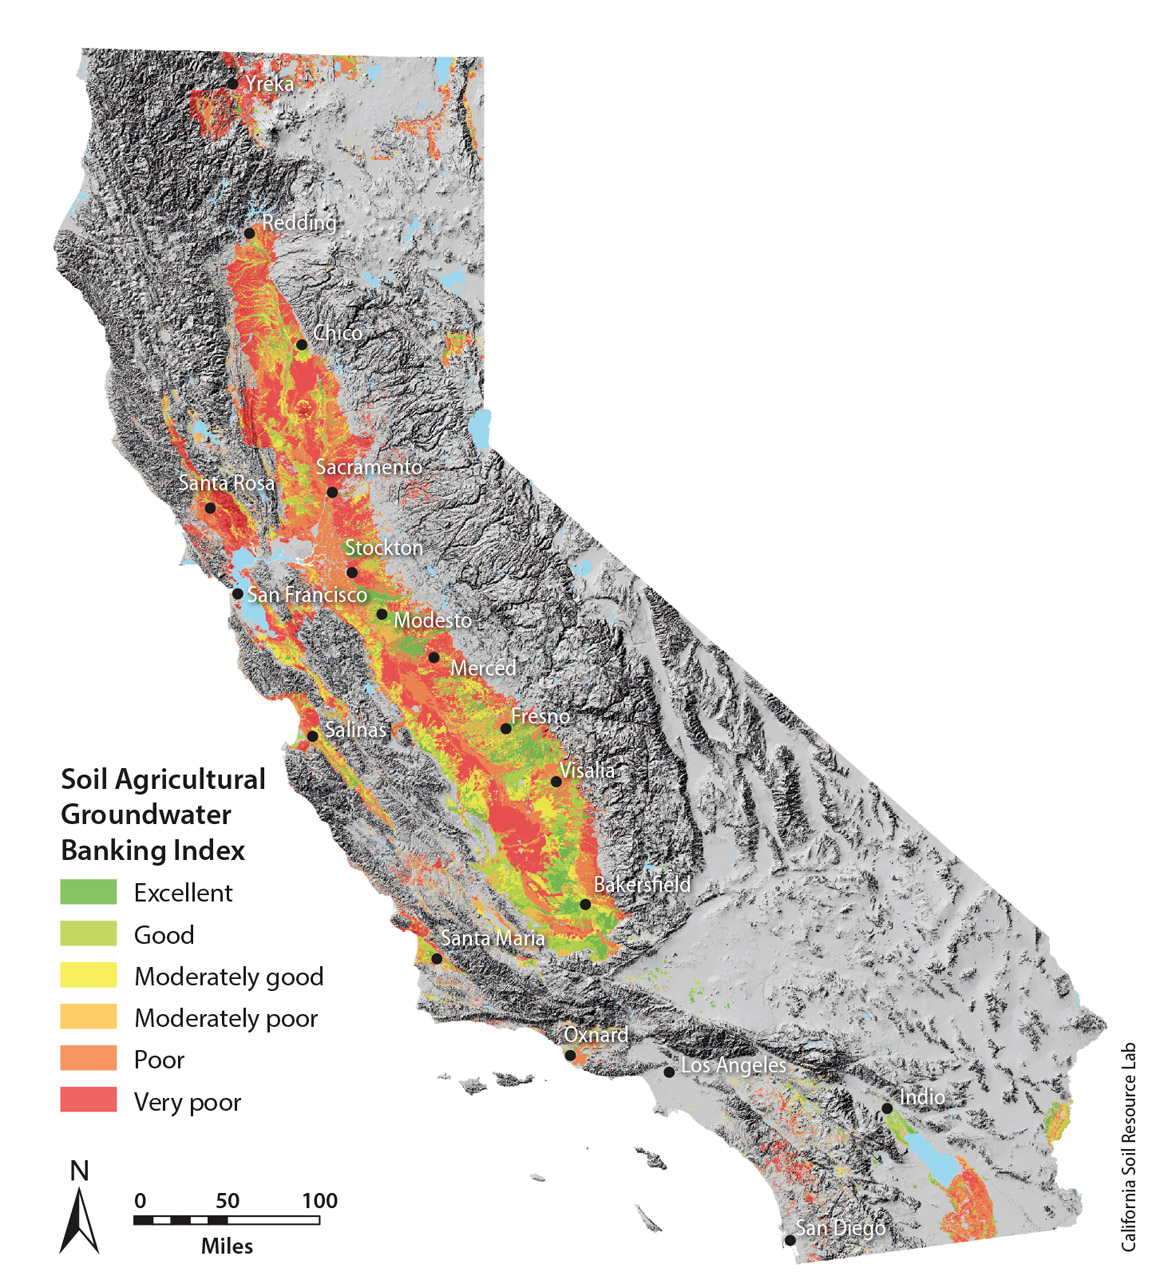
Fig. 5. Spatial extent of Soil Agricultural Groundwater Banking Index suitability groups accounting for modifications by deep tillage.
The final SABGI that accounts for deep tillage represents the best estimate of soil suitability for groundwater banking. Over 12 soil survey areas are classified as out-of-date in agricultural regions of California (USDA-NRCS 2014) and do not accurately document the extent of soil modification by deep tillage. These modified SAGBI ratings provide an updated assessment of the current state of soils in the study area.
Implications
There are approximately 5.6 million acres of land with soils in Excellent, Good and Moderately Good SAGBI suitability groups, a significant amount of agricultural land capable of accommodating deep percolation with low risk of crop damage or contamination of groundwater by salts. Most suitable soils for agricultural groundwater banking occur on or near alluvial fans created by rivers draining the Sierra Nevada. Perhaps not coincidentally, these are also the areas that have California's most successful groundwater banking programs (Water Association of Kern County 2014).
Our preliminary survey of UCCE perennial crop experts suggests that pears, wine grapes and some rootstocks of various Prunus species (i.e., almond, peaches and plums) are best suited for groundwater banking if planted on suitable soils and managed appropriately, especially after budbreak. While extensive in acreage, almonds may be less ideal because of the trees’ sensitivity to saturated conditions and high nitrogen demand (table 1). Walnuts may be an option given that budbreak typically occurs in late April. Wine grapes may be the best option because of the extensive acreage planted, low nitrogen demand and tolerance to standing water (table 1). Almonds with plum rootstocks may also be suitable; however, currently almonds with water tolerant rootstocks are generally planted in soils that are poorly drained and thus less likely to be suitable for groundwater banking.
The undulating agricultural land found along many valley margins in California is poorly suited to groundwater banking because application of floodwater or waste water would be difficult to apply at these sites, which are typically drip irrigated.
Recharge potential
A preliminary calculation based only on soil properties and crop type shows that landscapes rated Excellent or Good could be used to bank as much as 1.2 million acre-feet of water per day. This estimate assumes 1 foot per day of water infiltration on lands in the Excellent and Good categories that are planted with grapes (460,000 acres) or alfalfa (300,000 acres), or fallowed (440,000 acres). There are significant limitations to this estimate. Most importantly, California lacks the infrastructure to accommodate and route such large volumes of water to the fields in such a short time (presuming that floodwater is the source of the water). Plus, the heterogeneity in precipitation across the state makes this estimate improbable (that is, it is unlikely that floodwater availability would be geographically close to the best lands for recharge). Offsetting these limitations to some degree are other crop types that would be suitable for recharge (i.e., annual crops) but were not included in this estimate.
Agricultural groundwater banking must be approached with caution. The financial risk associated with crop loss may exceed the potential benefits of water savings. Perennial crops carry particular risks and uncertainties. For instance, while trees and vines are generally more tolerant of saturation before budbreak than after (table 1), determining a reliable cutoff date for this increased tolerance is difficult. Tree and vine roots generally start to grow several weeks before budbreak, so damage from waterlogging can occur well before budbreak. Moreover, budbreak for a given species varies by location across the state. In addition, standing water on trunks can lead to aerial Phytophthora or other diseases. Investigating this opportunity in less valuable cropping systems, such as alfalfa, irrigated pasture and annual crops may be more promising until further research on tree crop sensitivity to standing water has been conducted.
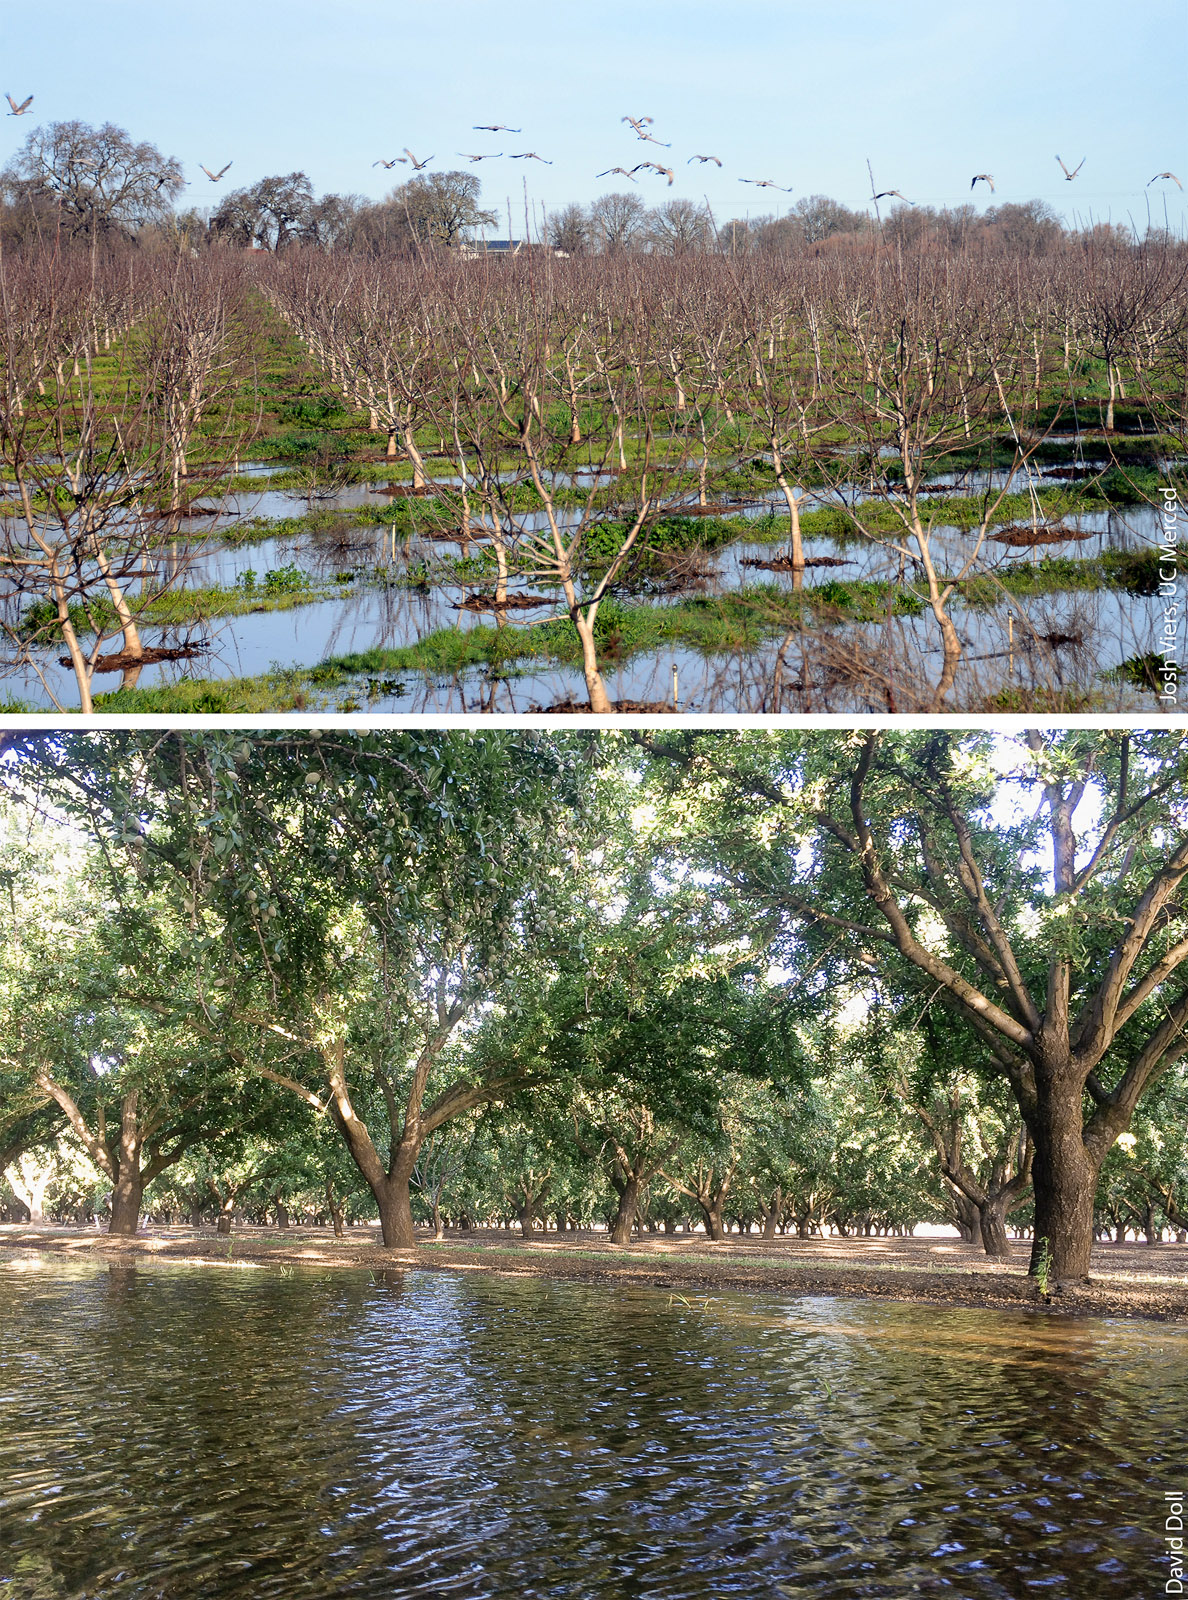
Orchards of walnuts (above) and almonds (below) may be viable sites for groundwater recharge, though the potential for water damage to such high-value crops adds risk.
If groundwater banking on agricultural lands becomes a priority, coordination at the policy, market and planning levels would be needed to provide an adequate land base ready to opportunistically capture floodwaters. Adoption of this practice would likely require some form of support to mitigate or protect growers from the risks of crop failure. For example, growers who make their land available for floodwater capture and groundwater banking could receive credits from municipalities or irrigation districts. They could also receive credits from irrigation districts for enrolling in a long-term program. Long-term commitments from growers likely would be needed for basin-scale planning purposes.
Although not included among the crops listed in table 1, alfalfa may be an ideal crop for groundwater banking because it requires little or no nitrogen fertilizer, reducing the risk that groundwater recharge would transport nitrates into aquifers. Alfalfa is sensitive to flooding and saturated conditions; thus the timing of flooding should coincide with older fields (typically 4 to 5 years old) slated for replanting. Because the financial risk associated with crop damage is lower in alfalfa than in tree and vine crops, the financial incentive needed to drive grower participation in groundwater banking programs likely would be lower as well.
Most annual cropping systems would be suitable for groundwater banking if water is applied when land is fallow. The major risk in annual crops is leaching of residual pesticides or fertilizer in the soil. Appropriate management practices for groundwater banking with specific annual crops would need to be developed. If agricultural groundwater banking becomes an important water security practice, the SAGBI may provide valuable information to guide future changes in cropping systems.
SAGBI can be a powerful aid to decision makers and stakeholders when considering the tradeoffs associated with the implementation of groundwater banks utilizing agricultural land for direct recharge. It was also developed with the intention of informing growers of the potential hazards associated with this practice. As is the case with any model, and with soil survey information in particular, ground-truthing at the field scale is necessary to verify results.
We acknowledge limitations to our model. It does not consider proximity to a surface water source, which is an issue especially in areas that are irrigated solely from groundwater wells and are not connected to conveyance systems that supply surface water. The SAGBI also does not consider characteristics of the vadose zone (the unconsolidated material below soil and above the groundwater table) or depth to groundwater. In arid regions, deep vadose zones may contain contaminants such as salts or agricultural pollutants that have accumulated over years of irrigation and incomplete leaching. These deep accumulations of contaminants could be flushed into the water table when excess water is applied during groundwater banking events. Furthermore, deep sediment likely contains hydraulically restrictive horizons that have not been documented, creating uncertainty as to where the water travels. An understanding of the depth to the groundwater table is also needed.
Given these issues, SAGBI may be most useful when used in concert with water infrastructure models and hydrogeo-logic models — which generally do not incorporate soil survey information in a comprehensive way — to develop a fuller assessment of the processes and limitations involved in a potential groundwater banking effort.
Information delivery
Our goal is to make SAGBI an interactive, web-based app. The decision support tool will display SAGBI groups as a map in Google Maps. Users will be able to navigate via standard map interface operations such as zoom tools and panning, or by entering a location in a search field to obtain SAGBI ratings. Users will also be able to query and display the individual ratings of each SAGBI factor for any location that has a SAGBI rating, illustrating the transparency of the model and allowing for further investigation of individual factors.
Citations
Soil suitability index identifies potential areas for groundwater banking on agricultural lands

