


All Issues
Water advance model and sensor system can reduce tail runoff in irrigated alfalfa fields
Publication Information
California Agriculture 68(3):82-88. https://doi.org/10.3733/ca.v068n03p82
Published online July 01, 2014
NALT Keywords
Abstract
Surface irrigation, such as flood or furrow, is the predominant form of irrigation in California for agronomic crops. Compared to other irrigation methods, however, it is inefficient in terms of water use; large quantities of water, instead of being used for crop production, are lost to excess deep percolation and tail runoff. In surface-irrigated fields, irrigators commonly cut off the inflow of water when the water advance reaches a familiar or convenient location downfield, but this experience-based strategy has not been very successful in reducing the tail runoff water. Our study compared conventional cutoff practices to a retroactively applied model-based cutoff method in four commercially producing alfalfa fields in Northern California, and evaluated the model using a simple sensor system for practical application in typical alfalfa fields. These field tests illustrated that the model can be used to reduce tail runoff in typical surface-irrigated fields, and using it with a wireless sensor system saves time and labor as well as water.
Full text
Although drip irrigation and other similarly precise irrigation methods have made significant improvements to on-farm irrigation efficiency, a large percentage (around 43% in 2011) of growers still use surface irrigation methods, such as flood or furrow (DWR 2013). These methods tend to be less water-use efficient due to excess deep percolation and tail water drainage (i.e., runoff) (Walker 1989). Because of the potential for greater water usage and loss, surface-irrigated crop production has come under severe scrutiny and is the target of many agricultural water-use efficiency programs in the United States, particularly in California. Growers are being encouraged to either increase the efficiency of their current irrigation systems or decrease the size of their farmland. In many situations, simple changes in water management or irrigation scheduling practices can decrease water losses and significantly increase a system's water-use efficiency (Bali et al. 2010; Grismer 2001).

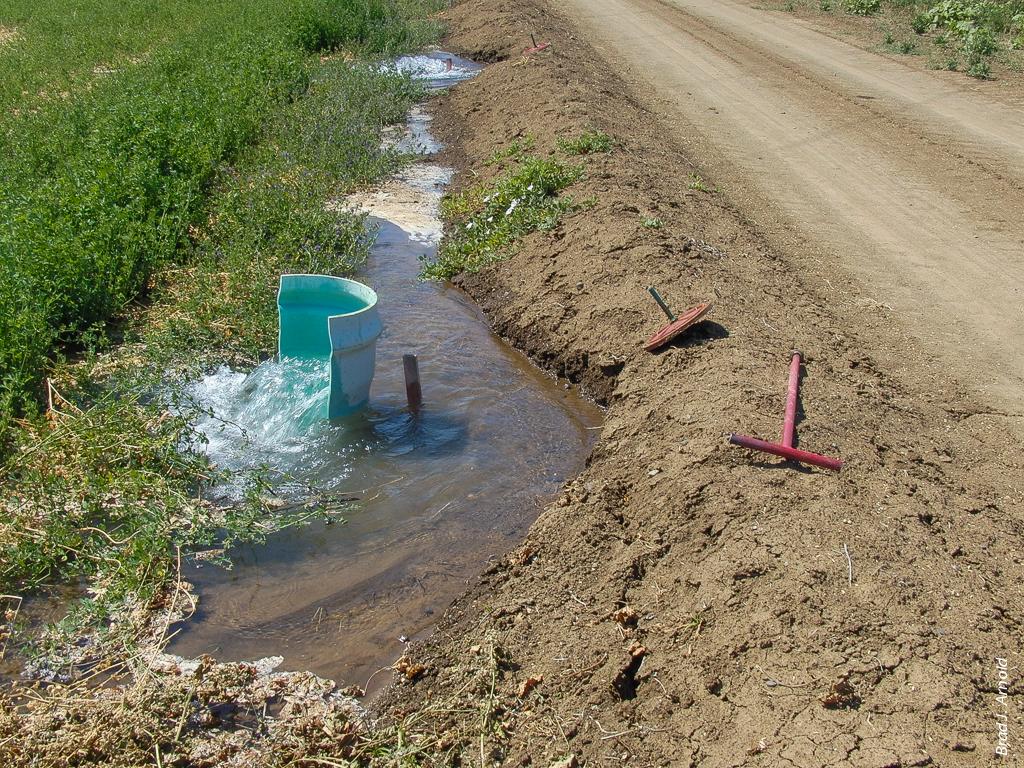
Surface irrigation can result in large amounts of water lost to runoff and excess percolation. UC researchers found that runoff in commercial alfalfa fields can be reduced significantly by using a mathematical model and sensors (above, white poles) to predict and track the advance of water in the field. Information from the sensors is relayed wirelessly to a central module, which notifies the irrigator via text message when the input water needs to be turned off.
Alfalfa (Medicago sativa L) is grown extensively in the western United States (Putnam et al. 2000) and frequently is surface irrigated (Schwankl and Pritchard 2003). Needing irrigation throughout the summer and fall months, it is the greatest water user of all California crops, accounting for about 19% of the state's agricultural water use (Putnam 2012). An alfalfa field is typically divided into checks (bays) separated by parallel ridges of soil, called borders. Water flows down the field slope, guided by the borders, to the tail end (bottom) of the check and then into a drainage ditch; this is frequently called check flood irrigation. Key limitations of this system include ponding of excess water at the tail end of fields, excessive runoff into drainage ditches or, if the inflow is turned off too early, deficient irrigation at the tail end of fields. These limitations lead to possible poor growth and crop yields at the tail ends of checks, applied water running off the site instead of being used for crop growth, and inferior water distribution uniformity (Hanson et al. 2008).
Research with surface-irrigated alfalfa has shown that proper water management can increase water-use efficiency while retaining production values such as crop yields and quality (Bali et al. 2004). Tail water runoff has been shown to have a strong correlation to cutoff distance (i.e., how far the wetting front, the front trajectory of the moving water, has advanced downfield when the inflow water is turned off) (Bali et al. 2010; Saha et al. 2011). As such, a significant opportunity for management improvements in check flood systems lies in developing strategies for cutting off the input water more precisely according to the advancement of the wetting front.
Irrigators usually do not apply a formulated cutoff strategy but instead use trial and error when establishing a cutoff distance. They make several trips to a field to determine when the water has reached a certain distance from the tail end of a check, based on field experience and using landmarks or following the path of birds or burrowing animals as the water advances. Then they turn off the inflow water to multiple checks, not just the check they have watched. However, the ideal cutoff distance is not always the same for all checks within a field or even for the same check over different irrigation events, due to spatial and temporal variability (e.g., soil moisture conditions). Even after making several trips to a field, an irrigator may miss the intended cutoff location or make an incorrect judgment of its location, leading to excessive runoff or inadequate irrigation.
Saha et al. (2011) reported details of a water advance model for managing water inflow cutoff in alfalfa fields with check flood irrigation. The model calculates an effective cutoff time using volume balance principles in an irrigated check, allowing an irrigator to define the desired amount of runoff. Their results in a controlled irrigated alfalfa field on the UC Davis campus using wired sensors that monitored the advance of the wetting front indicated that the model could reduce runoff to almost negligible levels compared with conventional cutoff practices.
Our goal was to assess this water advance model (Saha et al. 2011) for practical use by irrigators in commercially producing alfalfa fields with check flood irrigation, and determine its potential for decreasing runoff in these fields. Our specific objectives were (1) to compare runoff from a conventional cutoff practice to a retroactively calculated runoff from the model and (2) to assess the input measurements required to apply the model in typical alfalfa operations.
Field studies
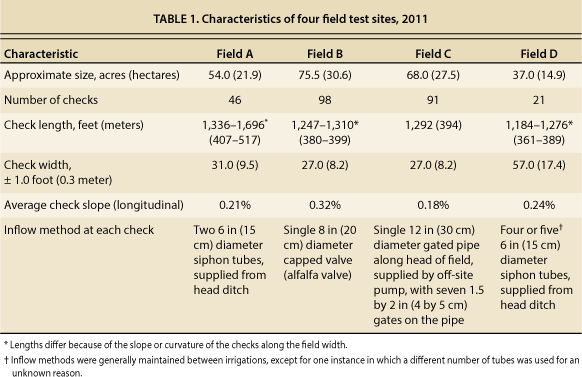
Field tests were conducted in four check flood–irrigated alfalfa fields in Solano and Yolo counties. All fields were either a majority Capay silty clay (Yolo series, Typic Haploxerets) or Marvin silty clay loam (Yolo series, Aquic Haploxeralfs), both heavy clay soils typical to these areas. Four typical alfalfa fields with three irrigation events monitored per field, except for one (field D) due to scheduling constraints, provided the replications. The details of these field sites, where we performed tests during the 2011 growing season between August and October, are presented in table 1.
For each of the three irrigation events, two checks were selected at random from the set being irrigated (not the same checks at each irrigation event). To monitor a predetermined (i.e., based on prior experience) cutoff location within each check, a wireless contact-type water arrival sensor pole (sensor) was placed by the irrigator at that point. When the wetting front arrived at the sensor, the sensor sent a wireless signal to a central module device, which delivered a time-stamped text alert message to the irrigator's cellphone. The wireless sensor system and central module, which is capable of monitoring up to 256 sensor poles within a half-mile range, were designed specifically for developing a practical cutoff strategy to reduce irrigation runoff (Arnold 2013).
Extra sensors were placed in each of the two checks (equidistantly before and after the cutoff location) to gather wetting-front advance data and assess the speed of the wetting front as it moved downfield. We recorded the times of all water arrival notifications at the sensors, from the text alert cellphone messages to the irrigator, as well as the corresponding sensor locations downfield from the head end of the check.
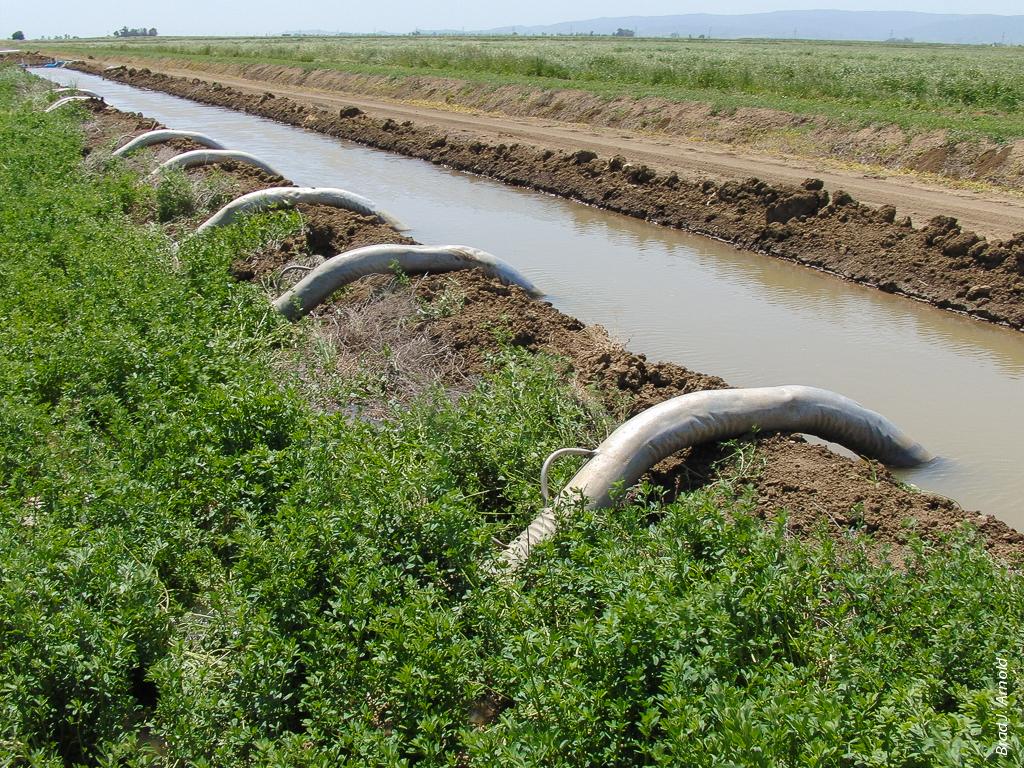
Siphon tubes, used in alfalfa fields A and D, deliver water from a head ditch to the checks.
Inflow to each check was monitored with a calibrated portable Doppler flow meter (PDFM 4.0; Greyline, Massena, NY), which was used to take hourly measurements manually prior to cutoff. As the wetting front proceeded toward the cutoff location, surface water depth was manually measured at the various sensor locations and averaged. The layout of our experiment, including the randomly chosen two checks, the sensors and the locations of water depth measurements, is shown in figure 1.
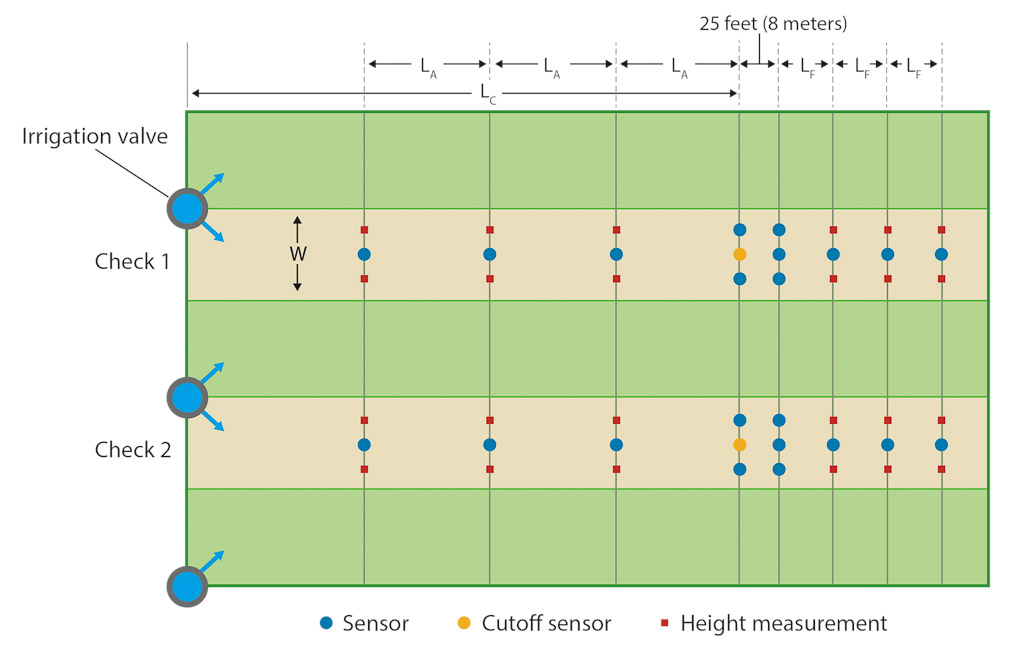
Fig. 1. Experiment layout: Each test included two checks, with an irrigation inflow at the head of the field, a sensor (the cutoff sensor, orange) at the irrigator-determined cutoff distance (LC), additional sensors (blue) to monitor the progression of the wetting front and the locations where the depth of the surface water was measured (red). The additional sensors were placed equidistantly before (LA) and after (LF) the cutoff location.
Conventional cutoff assessment
To assess the conventional cutoff method, irrigator-selected cutoff locations were used in the tests performed at each of the four fields. Table 2 lists, for each test, the cutoff distance, measured from the head of the check to the selected cutoff point. The inflow of water was cut off once a text alert was received that water had arrived at the cutoff sensor. Runoff was calculated using a volume balance model (see sidebar) and the sensor-collected wetting-front advance data.

TABLE 2. Additional sensor locations, irrigation inflow rate, cutoff distance, time to cutoff, and runoff volume in two checks during three irrigation events, at four fields, 2011
Runoff estimation model
The following volume balance model was used to calculate the runoff (R) in cubic feet from each irrigated check. The model assumes final infiltration rates, the long-term infiltration rate to the underlying soil following an initial saturation impulse of infiltration, considered negligible (Saha 2010):

Where the check width (w) and length (L), cutoff distance (LC), and cutoff time (tC) are measured in feet and minutes, respectively; the inflow rate (q) is measured in feet per minute; and the average surface water depth prior to cutoff (hA) and average surface water depth after cutoff (hF) are measured in feet. The model assumes negligible recession (i.e., retreating of water away from the head of the checks as the surface progressively dries) by the time the wetting front has advanced to the tail end of the check; this assumption was verified by Arnold (2013) through extensive field tests. It also assumes that the runoff value (R) in the model includes any cross-flow of water (i.e., uncontrolled water moving between checks due to deteriorated borders and soil cracking, which cannot be measured separately, as noted in table 2).
Table 2 also lists the calculated runoff volume from each check and the runoff calculated as a percentage of the water applied to the check (illustrated in figure 2). Cutoff distances were typically between 75% and 88% of the length of the checks. Runoff volumes were generally estimated between 13% and 40% of applied water (around 0.15 acre-foot per check on average), much larger than expected for heavy clay soils (Bali et al. 2001). These results suggest that, in typical practice, irrigators are waiting too long to cut off water inflow.
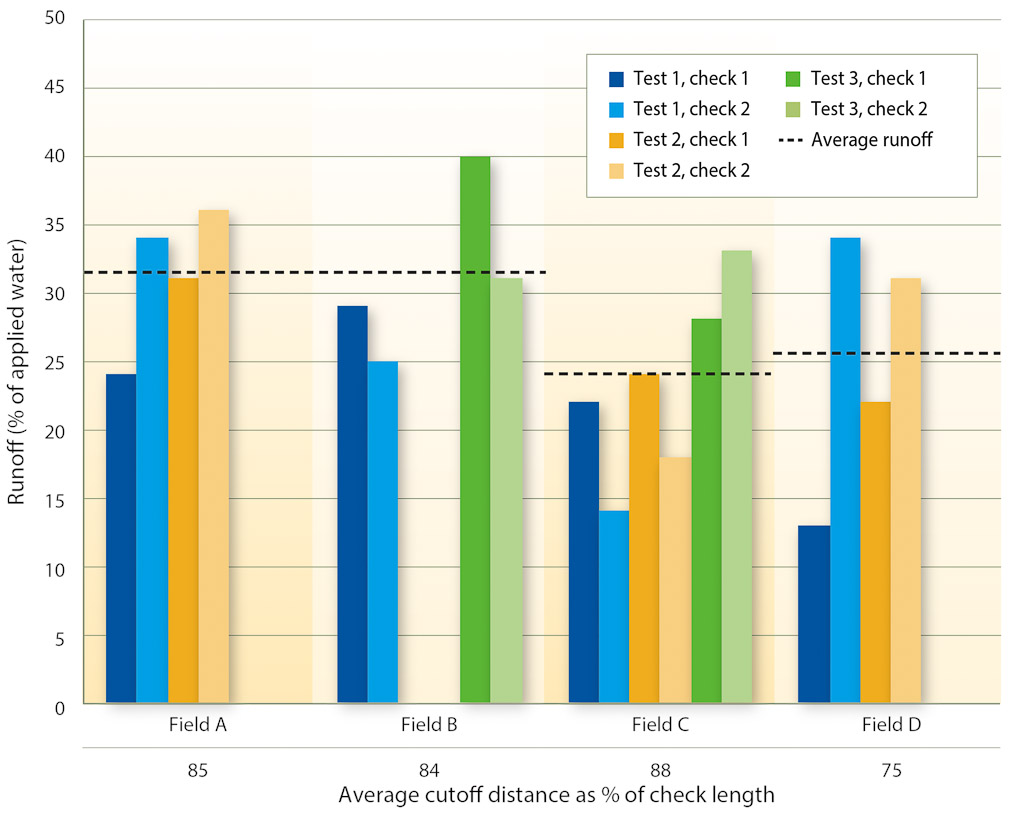
Fig. 2. Runoff percentages for each irrigated check and average cutoff distance per field. Differences in the configuration of field C (primarily the least amount of average check slope; see table 1) and lower inflow rates (see table 2) likely caused the runoff percentages in field C to be lower than for the other fields. Outlier results in fields A and B are not shown; see note, table 2.
Cutoff model assessment
Using a model developed by Saha et al. (2011), the ideal cutoff distance in each check to avoid excess runoff was determined retroactively (see sidebar) using the sensor-collected data. The results illustrate where cutoff sensors should have been placed, and when the inflow water should have been turned off. Further verification of this model was performed during the 2012 growing season in field C (Arnold 2013).
Water advance model
In development of the cutoff model, Saha et al. (2011) showed that in surface-irrigated alfalfa the wetting-front speed (v) in feet per minute becomes constant once the wetting front advances sufficiently downfield. That is,

Assuming the inflow rate (q) in cubic feet per minute, check width (w) and average surface depth of water (h), both in feet, are known or measured values, equation 2 can be solved for the magnitude of initial infiltration (II,) in feet since the wetting-front speed is known from water advance data. This value of II is substituted into equation 3 to obtain the irrigation water cutoff time (t0) in minutes:

Where t0 is the time (minutes) that water is cut off following wetting-front arrival at sensor S3, L3 is the distance (feet) from the head of the check to S3 downfield, L is the total check length, and hL is the surface depth of water (feet) when the wetting front arrives at the tail end. Note the irrigator selects a value of hL based on an acceptable amount of drainage.
Table 3 shows the model-defined cutoff distances for approximately 5% and 10% surface runoff (i.e., percentage of applied water), an equivalent of 0.25 and 0.5 inch of tail-end surface water depth (hL, see sidebar), respectively, which are both sufficient to ensure optimized crop production while improving upon typical values. Results indicate the cutoff sensor locations should have been at approximately 60% to 65% of check length, 220 to 245 feet (67 to 75 meters) farther upfield from where irrigators had placed them. This placement would have reduced runoff volumes significantly.

TABLE 3. Irrigator-determined cutoff distances and cutoff distances calculated using water advance model
The difference between irrigating for 5% and 10% runoff was about 0.02 acre-foot, or 24,670 liters, on average and approximately 46 feet (14 meters) in terms of cutoff distance, indicating that slight modifications to the cutoff distance can have significant effects on applied water use. For an average field size of around 58 acres (23.5 hectares) with 64 checks (table 1), the difference between model-calculated (i.e., 5% runoff) and irrigator-determined cutoff distances, and the presumed reduction in runoff, could mean around 8.5 acre-feet of water saved, or approximately $216 per field per irrigation using a conservative estimate for alfalfa production of $25.47 per acre-foot (Long et al. 2013).
Capped valves (alfalfa valves) provided consistent water inflow rates in field B.
Savings could be even greater for growers with higher water costs (e.g., in Kern County), and they would also multiply during the growing season with each irrigation. Savings might also be made from minimizing crop production losses at the tail ends of fields, due to better irrigation management. Note that the data in table 3 are dependent on the field conditions at the time of the irrigation tests and may be different for other irrigation events in the same field.
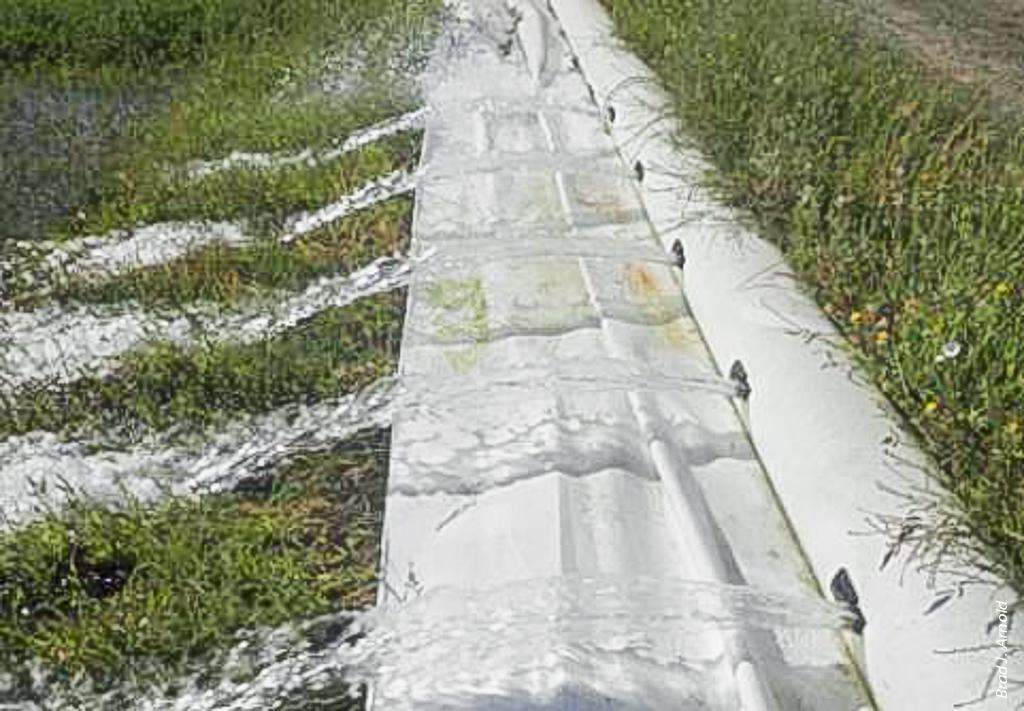
In field C, water was delivered to alfalfa checks from a gated pipe.
Practical application of model
For practical application of the model presented by Saha et al. (2011), certain values must be known or measured before and during irrigation to complete the model calculations (see sidebar). Field dimensions such as the check width and length and the sensor distances are easily measured using a tape measure or GPS before the start of the irrigation season and are assumed to be static over an entire season. The sensors are placed in each monitored check according to the setup shown in figure 3. The sensors may remain at their locations between irrigation events, moved between irrigated checks, or removed for cultural or machining operations and then replaced in the same configuration.
For each irrigation event, the average depth of water prior to cutoff (hA) is calculated by the irrigator once a text message is received for water arrival at sensor S3, by averaging (using a calculator) the manually measured depths at S1 and S2. The cutoff time (the number of minutes from the arrival of the wetting front at S3) is then calculated with a calculator in the field by the irrigator, using the mathematical model (sidebar, equation 3).
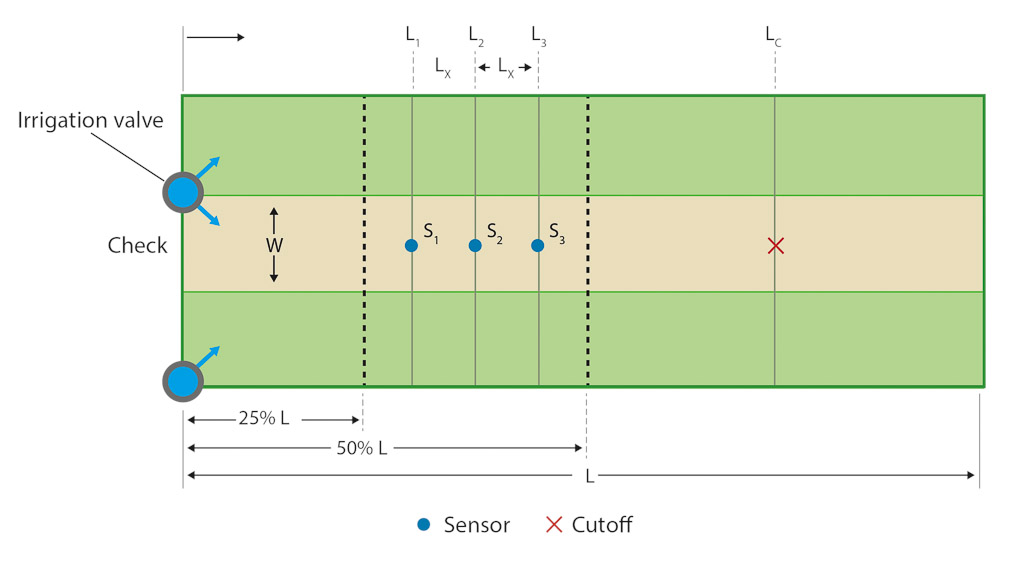
Fig. 3. To use the cutoff model, three sensors, S1, S2 and S3, must be placed equidistantly (LX) within a span of 25% and 50% of the check length (L); the cutoff distance (LC) is almost always beyond half of the length. The locations of all sensors must be measured from the head end of the check.
Although the irrigator must make these calculations during each irrigation event, which could be made easier with spreadsheet or calculation software, the primary benefit of the model-based cutoff system is that the irrigator now needs to return to the field only once, to turn off the inflow after receiving a cellular text message, thereby saving valuable time and labor costs. In conventional cutoff practice, the irrigator makes five or six or even more trips back to the field to visually monitor the water advancement downfield.
Beyond these measurements, the most tedious and time-consuming variable to acquire for the model during each irrigation event is the water inflow rate (q). Expensive flow meter equipment that is readily adaptable to field-specific inflow setups is typically required to obtain a reliable value. Our tests were performed in fields with different inflow setups: siphon tubes, alfalfa valves and gated pipes (table 1). Based on field data, it seemed conceivable that regulated inflow setups with uniform application rates could be developed and applied to the entire irrigation season for a particular setup.
Regardless of the inflow setup, in our tests the wetting-front speed remained constant for an irrigated check as the wetting front advanced downfield (Arnold 2013), indicating a constant inflow rate prior to cutoff (Saha 2010). Recall that all tests were performed in the same fields but not necessarily within the same checks. Therefore, to verify that separate irrigations illustrate similar behavior, inflow rates must be consistent between irrigated checks during a given irrigation (i.e., across the entire irrigated set of checks). Table 4 shows the variation in measured inflow rates (Arnold 2013) within a single irrigated check during one irrigation event, between different checks during the same irrigation event (i.e., for an irrigated set of checks) and between different checks during different irrigation events.
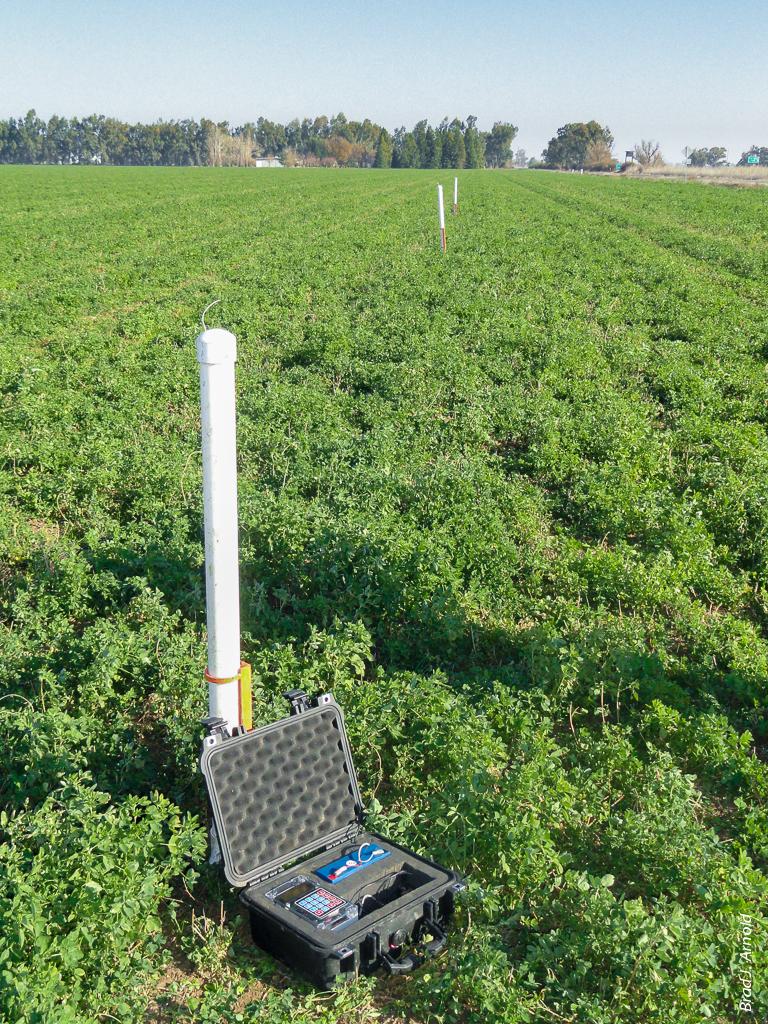
When a sensor (white pole) detects water arrival, a wireless signal is sent to the central module (black box), which generates a text message alert to the irrigator.
The variation between measurements during the same irrigation was generally low (coefficient of variation, CV, < 10%) for each inflow setup (table 4). In one instance with the siphon tubes, variation was large due to a loss of siphon charge midway through the test. Although the total inflow rate into the check was skewed as a result, separate measurements of the head ditch water height (Arnold 2013) indicated little variation (CV < 4%) from the time the ditch was filled, indicating the inflow rates should have remained constant. This suggests that the loss of charge may have been caused by improper tube setup by the irrigator. As seen in table 4, the pump-based systems (alfalfa valves, gated pipe) produced better consistency in inflow values.
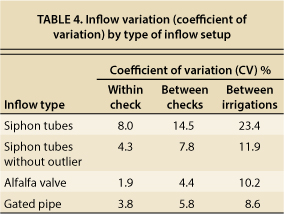
Overall, the results indicated reasonable stability in inflow values between checks irrigated at the same time, as well as in inflow values between irrigations (without the outlier). These data suggest that if inflow is properly maintained between irrigations (e.g., six siphon tubes used to feed every check from same head ditch), inflow rates will be relatively similar, and therefore an inflow measurement taken during the first irrigation of a season can be used for subsequent irrigations during the rest of that season with negligible error, thus reducing the effort needed to collect this data.
Application of sensors
Although the use of wireless sensors with the water advance model provides a suitable method for reducing tail water runoff in irrigated fields, the widespread use of these sensors may be limited because of the number of setups (multiple sensors per check, 64 checks per field) and measurements the irrigator must make. Due to the spatial and temporal differences between irrigated checks, multiple sensors are required in all checks to accurately apply the model; it is not feasible to apply the model to a “representative check” in an irrigated set.
The extra setup of the sensors required in the field may be of concern, but the sensors can be left in the field (at location) between irrigations and quickly removed for any cultural or machining processes, as mentioned above. Alternatively, the sensors can be moved from check to check following the arrival of water at a sensor or at the tail end of the field, making it easy for an irrigator to track multiple irrigated checks using the same set of sensors.
For monitoring the accuracy of the cutoff distance, irrigators may place a sensor toward the tail end of a check to receive a text alert to return to the field and record the results — whether irrigation is sufficient at the end of the check, whether runoff is reduced. Irrigators have the option, and are encouraged, to alter the cutoff sensor location in future irrigations, either upfield from the previous spot to further reduce runoff or downfield to ensure that water sufficiently covers the entire check (crop).
Potential uses
The level of savings in terms of irrigation water, reduced labor costs and reduced environmental impacts due to excess runoff makes the sensors and model system a viable option for most surface-irrigated fields similar to those in this study (check flood, furrow, etc.). Our results in the test fields showed that large quantities of water became runoff during irrigation and were not beneficial to crop production, and this water could have been saved. More importantly, the sensors and model combination offers a practical method for irrigators to enhance their irrigation practices while saving the time and labor needed to manually monitor an irrigated check. Beyond these immediate savings, the system also provides a path toward automating the surface irrigation process in the future, through the use of sensor alert messages that would be relayed to automatic inflow setups (e.g., electronic gates) or remotely controlled pump control panels.
Citations
Water advance model and sensor system can reduce tail runoff in irrigated alfalfa fields

